
Abstract
Excessive daytime sleepiness (EDS) is associated with quality of life and all-cause mortality in the end-stage renal disease population. This study aims to identify biomarkers and reveal the underlying mechanisms of EDS in peritoneal dialysis (PD) patients. A total of 48 nondiabetic continuous ambulatory peritoneal dialysis patients were assigned to the EDS group and the non-EDS group according to the Epworth Sleepiness Scale (ESS). Ultra-high-performance liquid chromatography coupled with quadrupole-time-of-flight mass spectrometry (UHPLC-Q-TOF/MS) was used to identify the differential metabolites. Twenty-seven (male/female, 15/12; age, 60.1 ± 16.2 years) PD patients with ESS ≥ 10 were assigned to the EDS group, while twenty-one (male/female, 13/8; age, 57.9 ± 10.1 years) PD patients with ESS < 10 were defined as the non-EDS group. With UHPLC-Q-TOF/MS, 39 metabolites with significant differences between the two groups were found, 9 of which had good correlations with disease severity and were further classified into amino acid, lipid and organic acid metabolism. A total of 103 overlapping target proteins of the differential metabolites and EDS were found. Then, the EDS–metabolite–target network and the protein–protein interaction network were constructed. The metabolomics approach integrated with network pharmacology provides new insights into the early diagnosis and mechanisms of EDS in PD patients.
1. Introduction
Sleep disturbances are extremely common in patients with end-stage renal disease (ESRD), as well as peritoneal dialysis (PD) patients, and are significantly associated with overall morbidity, hospitalization, mortality and low quality of life [Citation1,Citation2]. Excessive daytime sleepiness (EDS), or difficulty maintaining the alert, the awake state is one of the most important complaints in sleep disturbances [Citation3]. Despite its high prevalence, few studies have focused on the pathophysiology of EDS in PD patients.
Studies on human circadian and time-of-day variation have found that amino acids and lipid metabolism are involved in the pathogenesis of sleep disturbances, which suggests that the characteristics of endogenous metabolites could be used as a way to interpret EDS [Citation4,Citation5]. In addition, patients with ESRD on maintenance PD have significant alterations in their intracellular and plasma amino acid and lipid profiles, which has been attributed to a low-protein diet or inadequate intake, impaired protein or lipid catabolism, and long-term dialysis [Citation6]. Therefore, we assumed that potent metabolic alterations in PD patients with EDS should exist.
Metabolomics is an approach that assists in the understanding of the relationships and interactions between variations in endogenous metabolic processes and diseases. It utilizes ultra-performance liquid chromatography–high resolution mass spectrometry to quantitatively measure the dynamic metabolic response of living systems to pathophysiological stimuli to predict various diseases clinically [Citation7,Citation8]. Since rigorous, long-term intervention in humans is impractical, some animal experiments have been performed to analyze the metabolic profile of body fluid metabolomics for future dietary guidance and disease prevention [Citation9]. As a chemical reflection of the current phenotype of a particular biological system, metabolomics is frequently implemented to understand the pathophysiological processes involved in disease progression [Citation10–13]. Network pharmacology is an effective strategy for investigating the multiple targets of a disease from a molecular perspective [Citation14]. Network pharmacology integrated with metabolomics is commonly emerging as a holistic and efficient paradigm for revealing disease mechanisms from a systemic perspective. By integrating metabolomics and network pharmacology, we aimed to identify the metabolite features of EDS in PD patients and to establish an EDS–metabolite–target protein network to explore the mechanisms of EDS.
2. Materials and methods
2.1. Participants and collection of clinical data
From February 2013 to June 2013, forty-eight PD patients from the Dialysis Unit of Changhai Hospital were enrolled and took part in the questionnaire survey. All participants were CAPD patients admitted to the hospital for periodic evaluations. These patients undergo continuous ambulatory peritoneal dialysis, and the peritoneal dialysis fluid is kept in the body at night, so they represent a relatively stable homogeneous population. The inclusion criteria included a PD history of at least three months, no cognitive disorder, no history of stroke, stable heart function (NYHA stage I to II) and adequacy of dialysis (Kt/V > 1.7). The study protocol was approved by the Shanghai Changhai Hospital Ethics Committee, and written informed consent was obtained from all study participants. Enrolled patients completed our questionnaire during the outpatient interview, and the questionnaire was explained to the patients with necessary assistance, which was provided to clarify the questions. The immediate glucose exposure in the peritoneum is equal to the number of 2-L bags of peritoneal dialysis fluid used by the patient multiplied by the glucose concentration. The Epworth Sleepiness Scale (ESS) was used to define the existence of EDS in the PD population. The ESS has patients rank their likelihood of dozing in eight different situations, with “0” indicating “would never doze” and “3” indicating “high chance of dozing”. The validity and reliability of the Chinese version of the ESS have been assessed in the Chinese population [Citation15]. All of the evaluations were conducted by the same physician. A medical chart review was also conducted, including general information and biochemical parameters, to collect clinical data within one month of their interview.
2.2. Serum pretreatment
Blood samples collected from the 48 PD patients were centrifuged within 3 h of collection and stored at −80 °C prior to analysis. A 100-μL aliquot of serum samples with 5 μL of internal standards (4-chlorophenylalanine, 160 μg/ml) was extracted through the addition of 300 μL of methanol, incubation on ice for 10 min and centrifugation at 4 °C (18,000 × g for 10 min). The supernatant was dried in a Savant vacuum concentrator and then resuspended in 50 μL of acetonitrile/water (1:19, v/v). After centrifugation at 4 °C (13,000 rpm for 10 min), the supernatant was collected for analysis.
2.3. Measurement of interleukin-6
The level of interleukin-6 (IL-6) in the patients’ sera was detected by an enzyme-linked immunosorbent assay kit according to the manufacturer’s instructions (Uscnk Co. Ltd. Wuhan, P.R.China).
2.4. UHPLC-Q-TOF/MS analysis
An Agilent 1290 Infinity LC system with an Agilent 6538 Accurate-Mass Quadrupole Time-of-Flight (QTOF) mass spectrometer was used to conduct the UHPLC-Q-TOF/MS analysis (Agilent Technologies, Santa Clara, CA, USA). The mobile phase for chromatography was composed of 0.1% formic acid (A) and acetonitrile modified with 0.1% formic acid (B), while separations were processed with an ACQUITY UPLC HSS T3 column (2.1 × 100 mm, 1.8 μm; Waters, Milford, MA, USA) at 40 °C. The autosampler was kept at 4 °C. The flow rate was set as 0.4 mL/min, and the injection volume was 3 μl. In both positive and negative modes, an electrospray ionization source (ESI) was employed. The optimized UPLC elution conditions were 5% B for 0–2 min, 5–15% B for 2–10 min, 15–30% B for 10–14 min, 30–95% B for 14–17 min, and 95% B for 17–19 min. Additionally, the post time was set to 6 min for equilibrating the system. The following were the optimized conditions: capillary voltage of 4 kV for positive mode and 3.5 kV for negative mode, drying gas flow of 11 L/min, gas temperature of 350 °C, nebulizer pressure of 45 psig, fragmentor voltage of 120 V, skimmer voltage of 60 V, and collision energy of 10-50 eV. Data were collected in centroid mode from 50 to 1100 m/z. MS/MS has high sensitivity and allows the ability to combine and analyze multiple compounds, identify and quantify target analytes with high accuracy and high resolution, and analyze potential biomarkers.
2.5. Data processing and statistical analysis
Each sample was represented in an electrospray ionization (ESI) chromatogram. The UPLC samples were displayed with ESI mzdata files by Agilent Mass Hunter Qualitative software with a threshold set at 0.1% to exclude isotopic interferences. The data of each sample were normalized by filtering the ions according to the 80% rule. SIMCA-P software (version 11.0, Umea, Sweden) was used for partial least squares discriminate analysis (PLS-DA), permutation tests and variable importance in projection (VIP) values. Metabolite ions were selected for further analysis after filtering VIP values greater than 1.0. A visual data matrix was generated by the XCMS program (http://metlin.scripps.edu/download/) with peak detection, retention time (RT) alignment and peak integration. The concentration of metabolites is based on relative quantification. The relationship between the ESS score and metabolites was studied by Pearson’s correlation analysis. Continuous variables are shown as the means with standard deviations, and categorical variables are shown as percentages. In the case of non-parametric data distribution, medians with IQRs are shown. Student’s t-test or non-parametric test was used to compare the groups. Statistical significance for all analyses was set at p < 0.05. Statistical analysis was performed with SPSS 22.0 software.
2.6. Bioinformatics analysis with network pharmacology
The target proteins of the differential metabolites were searched for in the Search Tool for Interactions of Chemicals (STITCH, http://stitch.embl.de) database [Citation16]. Additionally, the target proteins related to EDS were identified with the Comparative Toxicogenomic Database (CTD, http://ctdbase.org/) [Citation17]. An EDS–metabolite–target protein network was constructed by using Cytoscape (http://cytoscape.org) software based on the overlapping target proteins [Citation18]. The Search Tool for the Retrieval of Interacting Genes (STRING, https://string-db.org/) database was used to obtain protein–protein interaction (PPI) data [Citation19]. The overlapping target proteins were further studied by the Database for Annotation, Visualization, and Integrated Discovery (DAVID, https://david.ncifcrf.gov/) database with Gene Ontology (GO) and Kyoto Encyclopedia of Genes and Genomes (KEGG) pathway enrichment analysis [Citation20].
3. Results
3.1. Demographic and biochemical data of the patients
Forty-eight patients completed the interview, and clinical information was collected. Twenty-seven (male/female, 15/12; age, 60.1 ± 16.2 years) PD patients with ESS ≥ 10 were assigned to the EDS group, while twenty-one (male/female, 13/8; age, 57.9 ± 10.1 years) with ESS < 10 were defined as the non-EDS group. General information on the enrolled patients is listed in .
Table 1. Demographic and biochemical data of the patients.
The continuous variables are reported as the mean ± SD, and categorical variables are presented as numbers. Medians with interquartile ranges are presented in the case of nonparametric data.
3.2. Metabolic analysis
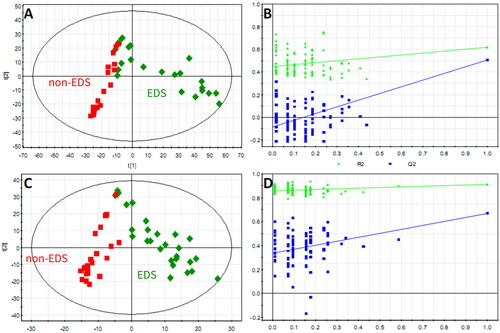
Typical UHPLC-Q-TOF/MS base peak chromatograms of sera from the EDS and non-EDS groups in positive and negative ion modes are shown in . After data transformation, there were 2379 ions left, of which the RSD of the internal standard peak ion was less than 10%, indicating that the stability of the metabolite extraction and the stability of the detection system were good. After internal standard normalization, all ions were introduced into SIMCA-P for PLS-DA analysis ().
Figure 1. Typical base peak chromatograms of the two groups. Typical base peak chromatograms of the representative serum sample from the EDS patients in positive (A) and negative (B) ion modes; the non-EDS patients in positive (C) and negative (D) ion modes. In positive and negative ion modes, the peaks and retention times between the groups were relatively similar. Small differences among time, peak height, and low energy observed intuitively indicate differences in metabolites across concentration and type dimensions.
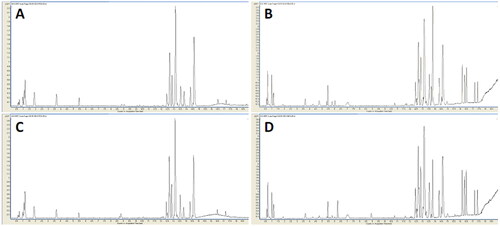
Figure 2. The PLS-DA score plot showed a global metabolic difference between the two groups. Score plots derived from PLS-DA in classifying PD patients with and without EDS in positive (A) and negative (C) ion modes, a clear separation trend between the two groups indicates that the plasma metabolic profile has changed significantly. Validation plots of the PLS-DA model in positive (B) and negative (D) ion modes.
A total of 39 metabolites with significant differences between the two groups were found. Then, the correlations between the relative intensity of these metabolites and ESS were analyzed, and 9 metabolites were further identified with correlation coefficients greater than 0.4. These 9 metabolites, specifically taurine, indoxyl sulfate, tryptophan, kynurenine, carnitine, 3-indoleacetic acid, lysophosphatidic acid (LPA), lysophosphatidylcholine (LPC) and 3-hydroxybutyric acid, were cataloged into three chemical classes, including amino acid, lipid and organic acid metabolism, which are summarized in .
Table 2. Differential serum metabolites identified for the EDS and non-EDS groups.
3.3. Network pharmacology analysis
3.3.1. Target proteins of the differential metabolites and EDS
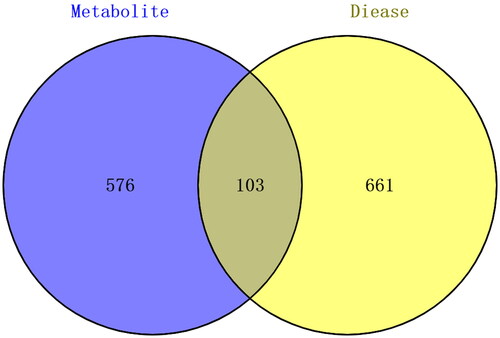
The 9 differential metabolites were entered into the STITCH database, and a protein set with 679 target proteins interacting with 9 metabolites was obtained (Supplementary Table S1). Moreover, the CTD database was searched to identify the protein set associated with EDS, and a total of 764 target proteins were found with an inference score greater than 20 (Supplementary Table S2). Then, we obtained 103 () overlapping target proteins of the two protein sets (Supplementary Table S3).
Figure 3. Venn diagram of the protein sets between metabolites and EDS.
3.3.2. EDS–metabolite–target protein network and PPI network construction
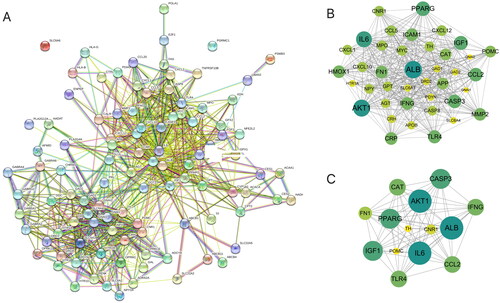
Cytoscape was used to construct an EDS-metabolite-target protein network (). In the network, the central region represents EDS; the green (8) nodes represent differential metabolites, with only 8 metabolites having metabolite targets; and the yellow (103) nodes represent overlapping target proteins. Afterwards, the 103 overlapping target proteins were input into the STRING database to establish the PPI network (). With the criteria of a degree greater than 30, a total of 14 critical nodes were further screened. They were ALB, IL6, AKT1, CASP3, PPARG, FN1, TLR4, CAT, CNR1, CCL2, IFNG, POMC, IGF1, and TH (). These 14 targets might be valuable targets to explore in the future.
Figure 4. EDS–metabolite–target protein network construction. Cytoscape software was used to build the EDS–metabolite–target protein network. The central region represents EDS; only 8 metabolites (green nodes) had metabolite targets (103 yellow nodes).
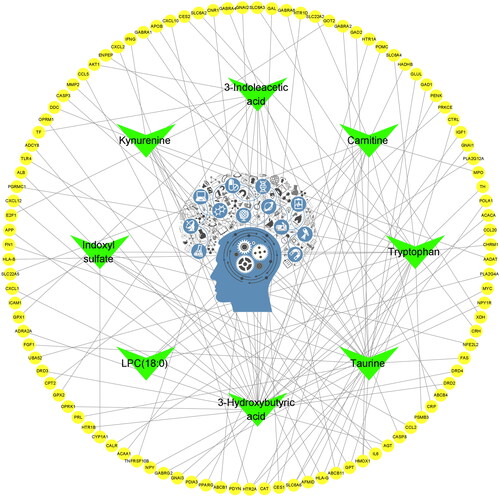
Figure 5. PPI network of the overlapping target proteins. (A) PPI network of the 103 overlapping target proteins; (B) PPI network of the critical targets according to the criterion of degree value greater than 20; (C) PPI network of the 14 critical targets according to the node degree (in B and C, the size and color saturation of the node are proportional to its significance).
3.3.3. GO and KEGG pathway enrichment analysis
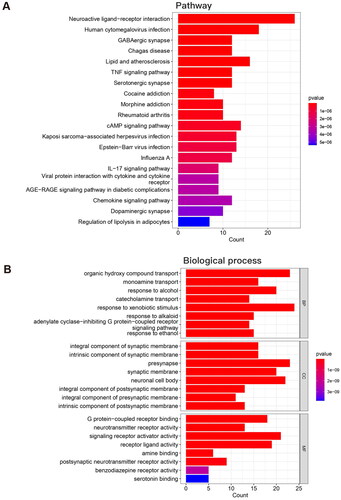
The GO and KEGG pathway enrichment analyses were acquired after the 103 overlapping target proteins were input into the DAVID database (Supplementary Tables S4, 5). According to the protein count, the top 10 pathways were neuroactive ligand–receptor interaction, human cytomegalovirus infection, lipid and atherosclerosis, cAMP signaling pathway, Kaposi sarcoma-associated herpesvirus infection, Epstein–Barr virus infection, pathways of neurodegeneration-multiple diseases, GABAergic synapse, Chagas disease, and TNF signaling pathway (). The results of KEGG pathway analysis also suggest that neuroactive ligand–receptor interactions play important roles in EDS. The top 10 biological process GO enrichment items were response to xenobiotic stimulus, organic hydroxy compound transport, signal release, presynapse, response to nutrient levels, response to extracellular stimulus, neuronal cell body, signaling receptor activator activity, response to alcohol and positive regulation of secretion (). The exact roles of these ten processes in EDS warrant investigation in the future.
Figure 6. GO and KEGG pathway enrichment analysis of the overlapping target proteins. (A) The top 10 pathways in the KEGG pathway analysis of the overlapping target proteins; (B) The top 10 biological process terms in the GO enrichment analysis of the overlapping target proteins.
3.4. Validation of the network analysis at the level of interleukin-6
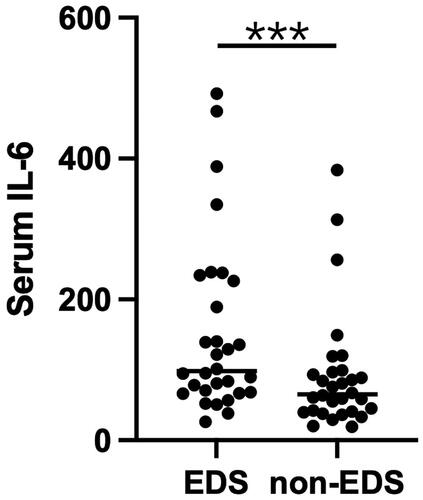
Using the biobank of the Dialysis Unit of Changhai Hospital from 2022.06-2022.12, 30 eligible EDS and 30 non-EDS patients were screened out, and a batch of patient serum IL-6 measurement was verified in January 2023. The serum level of IL-6 was significantly higher in the EDS group than in the non-EDS group (p < 0.0001, ).
Figure 7. Scatter plot of serum IL-6 levels in the EDS and non-EDS groups. ***P < 0.0001.
4. Discussion
In this study, the serum metabolites of the EDS and non-EDS groups were compared and analyzed by using metabolomic analysis. A total of 9 metabolites with significant differences, specifically taurine, indoxyl sulfate, tryptophan, kynurenine, carnitine, 3-indoleacetic acid, LPA, LPC and 3-hydroxybutyric acid, were identified and cataloged into three metabolic pathways, namely, amino acid, lipid and organic acid metabolism.
For amino acid metabolism, we found lower tryptophan and higher kynurenine and indoxyl sulfate levels in the EDS group than in the non-EDS group. Tryptophan is primarily metabolized in the body through three main pathways: the 5-hydroxyindole pathway, the kynurenine pathway and the microbiome pathway [Citation21]. The 5-hydroxyindole pathway is considered the main pathway that stimulates serotonin synthesis in brain neurons in the hope of producing benefits associated with sleep/wake regulation primarily by promoting wakefulness and inhibiting rapid eye movement sleep [Citation22,Citation23]. The kynurenine pathway requires the enzyme indoleamine 2,3-dioxygenase (IDO), which converts tryptophan to kynurenine, contributing to sleep disruptions and cognitive impairments [Citation24]. In the microbiome pathway, the microbiome of the gastrointestinal tract can convert tryptophan to multiple metabolites, such as indole, which is then absorbed across intestinal epithelial cells. Once indole is absorbed across the intestinal epithelial cells into the blood, it is taken up by hepatocytes; this indole can be metabolized by the hepatic microsomal CYP450 enzyme CYP2E1 and the sulfotransferase family 1 A member 1 (SULT1A1) to form IS, which is eventually removed by the kidneys via tubular secretion [Citation25]. Indoxyl sulfate is a well-known uremic toxin that accumulates in the blood of ESRD patients due to inadequate renal clearance and is associated with sleep deprivation [Citation26]. The results of our study suggested that the kynurenine pathway and the microbiome pathway are strengthened but that the 5-hydroxyindole pathway is weakened in EDS patients. As the precursor of serotonin, tryptophan is used to treat depression and various sleep disorders. Previous studies have revealed that tryptophan intake has a significant association with self-reported levels of depression and possibly duration of sleep without influencing liver function, kidney function and carbohydrate metabolism [Citation27]. In addition, an individual case showed that tryptophan intake might be a useful medication for EDS in children with Prader-Willi Syndrome [Citation28]. Therefore, we speculate that tryptophan intake may improve EDS in PD patients, which might be associated with enhancing the 5-hydroxyindole pathway.
Carnitine was another amino acid that was significantly different between the EDS and non-EDS groups. Previous studies have shown that mice with systemic carnitine deficiency exhibit a higher frequency of fragmented wakefulness and rapid eye movement sleep and reduced locomotor activity, indicating that carnitine is essential for normal sleep regulation [Citation29]. In clinical research, acylcarnitine levels in blood samples were significantly lower in narcolepsy patients than in controls. In addition, the expression of carnitine palmitoyltransferase 1B was higher in narcolepsy patients, suggesting that fatty acid β-oxidation is altered in narcolepsy patients [Citation30]. Then, a randomized, double-blind, crossover and placebo-controlled trial administering carnitine to patients with narcolepsy was performed. The results showed that carnitine is an effective and well-tolerated treatment for daytime sleepiness in narcolepsy patients [Citation31]. Therefore, we hypothesize that carnitine treatment may ameliorate EDS in PD patients by promoting fatty acid oxidation.
For lipid metabolism, there were lower LPA and LPC levels in the serum of EDS patients than in that of non-EDS patients. Both LPA and LPC are lysophospholipids, which are hydrolytic products of phospholipids catalyzed by phospholipase A (PLA). Phospholipids are important constituents of cellular membranes and lipoproteins, and compromised phospholipid metabolism results in poor cellular integrity and microinflammation status, which might lead to daytime sleepiness episodes. However, previous studies have shown that phosphatidylcholine (PC) was increased during total sleep deprivation, suggesting that sleep loss might modulate lipid metabolism [Citation32]. In addition, another clinical trial demonstrated that phospholipids had a positive correlation with the prevalence of sleep disturbances, while polyunsaturated fatty acids were inversely associated with the prevalence of sleep disturbances [Citation33]. Moreover, PLA activity in plasma was increased in obstructive sleep apnea patients, suggesting that LPA and LPC levels might be higher in apnea patients than in controls [Citation34]. Therefore, it remains to be determined whether our results regarding the lower LPA and LPC levels have real-world clinical relevance for PD patients with EDS.
For organic acid metabolism, we found that 3-hydroxybutyric acid levels were higher in EDS patients than in non-EDS patients. Interestingly, 3-hydroxybutyric acid is an inhibitor of histone deacetylases, resulting in the upregulation of genes involved in protection against oxidative stress and regulation of metabolism. It interacts with the inflammasome in immune cells to reduce the production of inflammatory cytokines and reduce inflammation [Citation35]. Therefore, the change in 3-hydroxybutyric acid may be the compensatory mechanism by which oxidative stress and inflammation are inhibited. Previous studies have shown that sleep restriction increased 3-hydroxybutyric acid levels, which might be associated with increased hepatic fatty acid oxidation promoted by peroxisome proliferator-activated receptor α [Citation36]. However, another trial demonstrated that plasma 3-hydroxybutyric acid levels were reduced in sleep restriction, which might be related to decreased nonesterified fatty acids [Citation37]. In our study, EDS might promote fatty acid oxidation to produce energy, which is consistent with the low carnitine and high 3-hydroxybutyric acid levels. Ketogenic diet consumption and exogenous ketone supplementation have been attempted in a wide variety of neurological diseases, including epilepsy, neurotrauma, Alzheimer’s disease and Parkinson’s disease [Citation38]. However, a ketogenic diet had no effect on subjective sleep quality in a sample of healthy individuals [Citation39]. Thus, whether a ketogenic diet can improve EDS in PD patients needs further research.
Additionally of interest was the relationship between target proteins and EDS in PD patients. It is conceivable that patients with poor sleep quality at night might experience immunological alterations, and a variety of clinical trials have confirmed that IL-6 is an important cytokine [Citation40–43]. Published evidence suggests that IL-6 is involved in physiological sleep regulation and that its increased secretion or exogenous administration in humans is associated with lethargy and fatigue [Citation40]. A previous study proposed that the regulation of sleep is homeostatically linked to the immune system and to the circadian timing of inflammatory cytokine release. However, in response to chronic stressors, as well as inflammatory disease states (such as CKD), in humans, the normally adaptive function of sleep can become dysregulated, such that sleep disturbance leads to increased inflammation at the expense of antiviral immune responses [Citation44]. Systemic levels of IL-6 are characterized by a circadian rhythm (peaking at 19:00 and 05:00), and nocturnal sleep appears to be critical for nocturnally increased IL-6 levels and Toll-like receptor 4 (TLR4)-stimulated monocyte-produced tumor necrosis factor (TNF) [Citation45–47]. However, experimental sleep deprivation shifted the secretion pattern of IL-6 from nocturnal to diurnal, resulting in hypersecretion of IL-6 during the day, whereas IL-6 production by TLR4-stimulated monocytes decreased at night and increased during the day [Citation46,Citation48]. A key transcriptional control pathway in the activation of inflammatory signaling cascades is the nuclear factor (NF)-κB pathway, which in turn upregulates the master circadian rhythm regulator, several immediate early genes that mark cell signal transduction and multiple inflammatory responses. Genetic ensembles of genes drive effects on transcriptome dynamics. Persistent EDS in PD patients may therefore translate inflammatory signals into increased systemic inflammatory markers [Citation49,Citation50]. Animal experiments have found that sleep deprivation can cause abnormal behavior in mice, increase the density of dendritic spines, reduce the shrinkage and loss of hippocampal neurons, and induce inflammatory responses and oxidative stress injuries, which may be related to TLR4-induced inflammatory responses [Citation51]. Similarly, albumin is considered to be an indicator of nutritional status. In the EDS process in PD patients, the patient is continuously in a microinflammatory state, and albumin acts as an indicator of the microinflammatory state at this time.
5. Conclusions
In summary, the application of metabolomics revealed the differential metabolites between the EDS and non-EDS groups, providing new insights into the early diagnosis and mechanisms of EDS in PD patients.
Institutional review board statement
The study was conducted in accordance with the Declaration of Helsinki, and approved by Shanghai Changhai Hospital Ethics Committee (CHEC2012-326).
Patient consent
Informed consent was obtained from all subjects involved in the study.
Written informed consent has been obtained from the patients to publish this paper.
Author contributions
Conceptualization, W.C. and Z.-Y.G.; methodology, Z.-H.L. and X.-L.L.; software, Y.-C.S.; validation, Y.X. and H.-Y.W.; formal analysis, Y.X.; writing—original draft preparation, W.C. and Y.X.; writing—review and editing, Z.-H.L.; visualization, H.-Y.W. and L.L.; project administration, X.-L.B.; funding acquisition, W.C. and X.-L.L. All authors have read and agreed to the published version of the manuscript.
Supplemental Material
Download PDF (2.1 MB)Supplemental Material
Download PDF (254.5 KB)Supplemental Material
Download PDF (108.8 KB)Supplemental Material
Download PDF (634.2 KB)Supplemental Material
Download PDF (414.5 KB)Acknowledgments
Authors are grateful to the peritoneal dialysis patients who participated in this study.
Disclosure statement
The authors declare no conflict of interest. Part of the results in this study was presented in abstract form at the 14th Asian-Pacific Congress of Nephrology in Tokyo, Japan, May15–17, 2014.
Data availability statement
The data presented in this study are available in supplementary materials.
Additional information
Funding
References
- Parker KP. Sleep disturbances in dialysis patients. Sleep Med Rev. 2003;7(2):131–143.
- Yang JY, Huang JW, Peng YS, et al. Quality of sleep and psychosocial factors for patients undergoing peritoneal dialysis. Perit Dial Int. 2007;27(6):675–680.
- Jaussent I, Morin CM, Ivers H, et al. Natural history of excessive daytime sleepiness: a population-based 5-year longitudinal study. Sleep. 2020;43(3):zsz249.
- Ang JE, Revell V, Mann A, et al. Identification of human plasma metabolites exhibiting time-of-day variation using an untargeted liquid chromatography-mass spectrometry metabolomic approach. Chronobiol Int. 2012;29(7):868–881.
- Gooley JJ, Chua EC. Diurnal regulation of lipid metabolism and applications of circadian lipidomics. J Genet Genomics. 2014;41(5):231–250.
- Chuang CK, Lin SP, Chen HH, et al. Plasma free amino acids and their metabolites in taiwanese patients on hemodialysis and continuous ambulatory peritoneal dialysis. Clin Chim Acta. 2006;364(1-2):209–216.
- Cai F, Ren F, Zhang Y, et al. Screening of lipid metabolism biomarkers in patients with coronary heart disease via ultra-performance liquid chromatography-high resolution mass spectrometry. J Chromatogr B Analyt Technol Biomed Life Sci. 2021;1169:122603.
- Sun J, Cao Z, Schnackenberg L, et al. Serum metabolite profiles predict outcomes in critically ill patients receiving renal replacement therapy. J Chromatogr B Analyt Technol Biomed Life Sci. 2021;1187:123024.
- Ning H, Shi D, Tian Z, et al. Metabolomics analysis of urine from rats given long-term high-protein diet using ultra-high-performance liquid chromatography-mass spectrometry. J Chromatogr B Analyt Technol Biomed Life Sci. 2022;1190:123082.
- Bujak R, Struck-Lewicka W, Markuszewski MJ, et al. Metabolomics for laboratory diagnostics. J Pharm Biomed Anal. 2015;113:108–120.
- Zhang F, Guo R, Cui W, et al. Untargeted serum metabolomics and tryptophan metabolism profiling in type 2 diabetic patients with diabetic glomerulopathy. Ren Fail. 2021;43(1):980–992.
- Yuan D, Kuan T, Ling H, et al. Serum metabolomics of end-stage renal disease patients with depression: potential biomarkers for diagnosis. Ren Fail. 2021;43(1):1479–1491.
- Luo M, Zhang Z, Lu Y, et al. Urine metabolomics reveals biomarkers and the underlying pathogenesis of diabetic kidney disease. Int Urol Nephrol. 2023;55(4):1001–1013.
- Boezio B, Audouze K, Ducrot P, et al. Network-based approaches in pharmacology. Mol Inform. 2017;36(10). doi:10.1002/minf.201700048
- Lai X, Chen W, Bian X, et al. Predictors of poor sleep quality and excessive daytime sleepiness in peritoneal dialysis patients. Ren Fail. 2015;37(1):61–65.
- Szklarczyk D, Santos A, von Mering C, et al. STITCH 5: augmenting protein-chemical interaction networks with tissue and affinity data. Nucleic Acids Res. 2016;44(D1):D380–4.
- Davis AP, Grondin CJ, Johnson RJ, et al. The comparative toxicogenomics database: update 2017. Nucleic Acids Res. 2017;45(D1):D972–D978.
- Shannon P, Markiel A, Ozier O, et al. Cytoscape: a software environment for integrated models of biomolecular interaction networks. Genome Res. 2003;13(11):2498–2504.
- Szklarczyk D, Morris JH, Cook H, et al. The STRING database in 2017: quality-controlled protein-protein association networks, made broadly accessible. Nucleic Acids Res. 2017;45(D1):D362–D368.
- Dennis G, Jr., Sherman BT, Hosack DA, et al. DAVID: database for annotation, visualization, and integrated discovery. Genome Biol. 2003;4(5):P3.
- Fernstrom JD, A perspective on the safety of supplemental tryptophan based on its metabolic fates. J Nutr. 2016;146:2601S–2608S.
- Monti JM, JM. Serotonin control of sleep-wake behavior. Sleep Med Rev. 2011;15(4):269–281.
- Sangare A, Dubourget R, Geoffroy H, et al. Serotonin differentially modulates excitatory and inhibitory synaptic inputs to putative sleep-promoting neurons of the ventrolateral preoptic nucleus. Neuropharmacology. 2016;109:29–40.
- Pocivavsek A, Baratta AM, Mong JA, et al. Acute kynurenine challenge disrupts sleep-wake architecture and impairs contextual memory in adult rats. Sleep. 2017;40(suppl_1):A40–A40.
- Banoglu E, Jha GG, King RS. Hepatic microsomal metabolism of indole to indoxyl, a precursor of indoxyl sulfate. Eur J Drug Metab Pharmacokinet. 2001;26(4):235–240.
- Giskeodegard GF, Davies SK, Revell VL, et al. Diurnal rhythms in the human urine metabolome during sleep and total sleep deprivation. Sci Rep. 2015;5(1):14843.
- Lieberman HR, Agarwal S, Fulgoni VL. 3rd. Tryptophan intake in the US adult population is not related to liver or kidney function but is associated with depression and sleep outcomes. J Nutr. 2016;146(12):2609S–2615S.
- Lee YJ, Marcu S, Berall G, et al. Tryptophan for the treatment of excessive daytime sleepiness in Prader-Willi syndrome. Indian Pediatr. 2011;48(4):319–328.
- Yoshida G, Li MX, Horiuchi M, et al. Fasting-induced reduction in locomotor activity and reduced response of orexin neurons in carnitine-deficient mice. Neurosci Res. 2006;55(1):78–86.
- Miyagawa T, Miyadera H, Tanaka S, et al. Abnormally low serum acylcarnitine levels in narcolepsy patients. Sleep. 2011;34(3):349–353.
- Miyagawa T, Kawamura H, Obuchi M, et al. Effects of oral L-carnitine administration in narcolepsy patients: a randomized, double-blind, cross-over and placebo-controlled trial. PLOS One. 2013;8(1):e53707.
- Chua EC, Shui G, Cazenave-Gassiot A, et al. Changes in plasma lipids during exposure to total sleep deprivation. Sleep. 2015;38(11):1683–1691.
- Tang J, Yan Y, Zheng JS, et al. Association between erythrocyte membrane phospholipid fatty acids and sleep disturbance in Chinese children and adolescents. Nutrients. 2018;10(3):344.
- Kheirandish-Gozal L, Philby MF, Qiao Z, et al. Endothelial dysfunction in children with obstructive sleep apnea is associated with elevated lipoprotein-associated phospholipase A2 plasma activity levels. J Am Heart Assoc. 2017;6:e004923.
- Achanta LB, Rae CD. Beta-hydroxybutyrate in the brain: one molecule, multiple mechanisms. Neurochem Res. 2017;42(1):35–49.
- Rao MN, Neylan TC, Grunfeld C, et al. Subchronic sleep restriction causes tissue-specific insulin resistance. J Clin Endocrinol Metab. 2015;100(4):1664–1671.
- Schmid SM, Hallschmid M, Jauch-Chara K, et al. Sleep loss alters basal metabolic hormone secretion and modulates the dynamic counterregulatory response to hypoglycemia. J Clin Endocrinol Metab. 2007;92(8):3044–3051.
- Stafstrom CE, Rho JM. The ketogenic diet as a treatment paradigm for diverse neurological disorders. Front Pharmacol. 2012;3:59.
- Iacovides S, Goble D, Paterson B, et al. Three consecutive weeks of nutritional ketosis has no effect on cognitive function, sleep, and mood compared with a high-carbohydrate, low-fat diet in healthy individuals: a randomized, crossover, controlled trial. Am J Clin Nutr. 2019;110(2):349–357.
- Tsaoussoglou M, Bixler EO, Calhoun S, et al. Sleep-disordered breathing in obese children is associated with prevalent excessive daytime sleepiness, inflammation, and metabolic abnormalities. J Clin Endocrinol Metab. 2010;95(1):143–150.
- Tanaka S, Honda M, Toyoda H, et al. Increased plasma IL-6, IL-8, TNF-alpha, and G-CSF in japanese narcolepsy. Hum Immunol. 2014;75(8):940–944.
- Tsai S-J, SJ. Role of interleukin 8 in depression and other psychiatric disorders. Prog Neuropsychopharmacol Biol Psychiatry. 2021;106:110173.
- Irwin MR, Olmstead R, Carroll JE. Sleep disturbance, sleep duration, and inflammation: a systematic review and meta-analysis of cohort studies and experimental sleep deprivation. Biol Psychiatry. 2016;80(1):40–52.
- Irwin MR. Sleep and inflammation: partners in sickness and in health. Nat Rev Immunol. 2019;19(11):702–715.
- Lange T, Dimitrov S, Born J. Effects of sleep and circadian rhythm on the human immune system. Ann N Y Acad Sci. 2010;1193:48–59.
- Vgontzas AN, Papanicolaou DA, Bixler EO, et al. Circadian interleukin-6 secretion and quantity and depth of sleep. J. Clin. Endocrinol. Metab. 1999;84(8):2603–2607.
- Dimitrov S, Besedovsky L, Born J, et al. Differential acute effects of sleep on spontaneous and stimulated production of tumor necrosis factor in men. Brain Behav Immun. 2015;47:201–210.
- Redwine L, Dang J, Hall M, et al. Disordered sleep, nocturnal cytokines, and immunity in alcoholics. Psychosom Med. 2003;65(1):75–85.
- Irwin MR, Wang M, Ribeiro D, et al. Sleep loss activates cellular inflammatory signaling. Biol Psychiatry. 2008;64(6):538–540.
- Irwin MR, Wang M, Campomayor CO, et al. Sleep deprivation and activation of morning levels of cellular and genomic markers of inflammation. Arch Intern Med. 2006;166(16):1756–1762.
- Wang W, Yang L, Liu T, et al. Ellagic acid protects mice against sleep deprivation-induced memory impairment and anxiety by inhibiting TLR4 and activating Nrf2. Aging. 2020;12(11):10457–10472.