
Abstract
Primary Sjogren’s syndrome (pSS) is a systemic autoimmune disease that is characterized by the infiltration of immune cells. Although the loss of salivary gland function is a major manifestation observed in pSS, the factors that could promote these changes in salivary gland tissue in pSS is not yet determined. Herein, we provide evidence that loss of alpha-1 antiproteinase antitrypsin could contribute to the induction of pSS. Alpha-1 antiproteinase antitrypsin belongs to the family of serpin proteins that function as protease inhibitors and protect secretory cells against proteases, especially to elastases that is secreted from lymphocytes. Importantly, expression of alpha-1 antiproteinase antitrypsin was decreased (more than 3-fold), along with an increase in elastase expression, in pSS samples when compared with age-matched non-SS-SICCA patients. Consistent with the human data, loss of alpha-1 antiproteinase antitrypsin, as well as an increase in immune infiltration, was observed in IL14α transgenic mice that exhibit SS like symptoms. Moreover, an age-dependent increase in elastase expression was observed in IL14α transgenic mice along with a decrease in total saliva secretion. Importantly, a 4-fold increase in microRNA132 expression, but not in other microRNAs, and increased DNA methylation in the promoter/noncoding region of serpina gene was observed in pSS, which could be responsible for the inhibition of alpha-1 antiproteinase antitrypsin expression in salivary gland cells of pSS patients. Together, these findings demonstrate that epigenetic regulations that include DNA methylation and microRNAs that could modulate the expression of alpha-1 antiproteinase antitrypsin in salivary glands and could be involved in the onset of pSS.
Introduction
Primary Sjogren’s syndrome (pSS) is a complex autoimmune disorder that affects around 0.1% of the adult population. In addition, pSS is second in rheumatic diseases, which is characterized by immune infiltration in exocrine glands that leads to functional impairment of the salivary and lacrimal glands [Citation1,Citation2]. Saliva has many notable oral health functions and salivary fluid is physiologically important for speech modulation, efficient mastication, maintaining the oral microbiota (increased oral bacterial and fungal infections), and lubrication of the soft and hard tissues [Citation3–5]. The oral and salivary manifestations observed in pSS include dry mouth, difficulty in chewing and swallowing food, and oral burning symptoms [Citation5–7]. Importantly, clinical manifestations from primary pSS patients and animal models of SS point to the loss of salivary gland function that results from abnormal autoimmune response; however, the mechanism that initiates loss of salivary gland secretion is not well understood [Citation8,Citation9]. Extra glandular manifestations are also common for these patients, who show an enhanced lymphoproliferation, with a greater risk of forming malignant lymphoma. Histologically, pSS is characterized by extensive lymphocytic infiltration that is observed in the salivary and lacrimal gland tissues [Citation8–12] and secretion of proteases, such as serine proteases, could induce the loss of salivary glands. Importantly, salivary gland cells have a measure that can protect them against the proteases secreted by immune cells; however, if these protective mechanisms are lost, they may induce cell death [Citation9,Citation13,Citation14].
Serpins are the largest and most broadly distributed superfamily of protease inhibitors. These inhibitors are characterized by the presence of three critical amino acids: histidine, aspartate and serine, which is present in the catalytic site [Citation15–18]. Proteases secreted from lymphocytes play a major role in tissue degeneration, thus tissues such as salivary glands have developed a protective mechanism that includes the presence of inhibitors that inhibits protease activity thereby prevent cell death. One such protease inhibitor is alpha-1 antiproteinase antitrypsin, which is a circulating serine protease inhibitor (serpin) that inhibits leukocyte elastase. One of these proteins, alpha-1 antiproteinase antitrypsin is a major proteinase inhibitor, which is produced in the gastrointestinal tract, liver, pancreas, gall bladder and inflammatory cells [Citation19]. Importantly, alpha-1 antiproteinase antitrypsin protein has been described previously in normal salivary gland cells and pleomorphic adenoma [Citation20], but its function, especially in disease conditions, is not clear. Also, alpha-1 antiproteinase antitrypsin has also been claimed to have diverse cytoprotective and anti-inflammatory effects, suggesting that alpha-1 antiproteinase antitrypsin evoke a “pro-survival” response [Citation17–20]. Alpha-1 antiproteinase antitrypsin is one of the main protease inhibitors in human serum and is important to control the inflammatory response by inhibiting the excess elastase that is produced from innate immune cells. Although the role of alpha-1 antiproteinase antitrypsin in immune modulation is been previously identified; its potential function in salivary gland dysfunction, especially pSS is not yet established. Importantly, alpha-1 antiproteinase antitrypsin therapy has been shown to prevent or reverse autoimmune diseases, and these effects were accompanied by changes in cytokine and transcriptional profiles and T cell subsets [Citation21–26], suggesting that manipulations that can restore alpha-1 antiproteinase antitrypsin expression, could be beneficial for autoimmune diseases such as pSS.
Although the aetiology of pSS remains obscure, it has been suggested that overactivation of the immune response upon the interaction of environmental and/or genetic factors may contribute towards the pathogenesis of pSS [Citation1–7,Citation27,Citation28]. A significant association between pSS development and a positive family history for autoimmune diseases has been documented, indicating the importance of a genetic predisposition [Citation29,Citation30]. Consistent with this, HLA DQB1*0201 -DRB1*0301 -DQA1*0501 haplotypes have been identified that exhibit the strongest risk factors to produce an anti-SSA/Ro, anti-SSB/La response. These responses are the hallmarks of the pSS disease [Citation30]. In addition, polymorphisms in certain genes, such as STAT4, IL-12A, TNIP1, IRF5, BLK and CXCR5 have been shown in pSS [Citation30]. However, most of these genetic mutations are far from DNA-coding regions and they are suspected to alter disease-susceptibility genes by altering their expression indirectly via an action on the epigenetic machinery [Citation31,Citation32]. Epigenetics is defined as changes in gene expression, that are inheritable and that do not entail changes in the DNA sequence. Epigenetic mechanisms are important to control the pattern of gene expression in response to biological or environmental changes. Therefore, epigenetic dysregulations have been linked with autoimmune diseases including pSS [Citation33,Citation34]. The precise mechanism and the consequence of the epigenetic changes are not known.
In this study, we have assessed the expression of alpha-1 antiproteinase antitrypsin in the salivary gland to see if it corelates with pSS. We report here that alpha-1 antiproteinase antitrypsin expression is important for Sjogren’s disease onset/propagation using both pSS patients and mouse models that mimic Sjogren’s like disease. Importantly, we have identified that certain epigenetic regulations could modulate the expression of alpha-1 antiproteinase antitrypsin. pSS patients displayed a severe reduction in stimulated saliva secretion and alpha-1 antiproteinase antitrypsin expression was substantially attenuated. Furthermore, mouse models that mimic SS also showed a decrease in alpha-1 antiproteinase antitrypsin expression that precedes acinar cell death. Importantly, increased epigenetic changes including an increase in expression of certain microRNA as well as DNA methylation in the serpin gene was observed in human pSS patients. Together, our findings suggest that regulation of gene expression probably via epigenetic modulations are key regulators for alpha-1 antiproteinase antitrypsin expression that could be critical for salivary gland function and survival.
Materials and methods
Human samples and their analysis
Individuals, referred to the Sjogren Expertise Centre of the University Medical Centre Groningen (UMCG) for evaluation of pSS were screened for eligibility. Exclusion criteria were age <18 years, an incomplete diagnostic workup (not all parameters evaluated), diagnosis of another systemic autoimmune disease, hepatitis C positivity, and renal impairment. Patients that fulfilled the 2016 ACR-EULAR criteria i.e. fulfil four out of six classification criteria for pSS were classified as pSS patients and the remaining patients that do not show at least four classification were identified as non-SS (nonSS-SICCA) and were used as controls [Citation35]. Serum samples of pSS patients were used for the characterization of Ro/La autoantibodies. Parotid gland biopsies from all patients were obtained as part of a complete diagnostic work-up, which was used for further studies as indicated below. A total of 12 confirmed pSS and 11 non-SS-Sicca were used for initial characterization followed by an additional cohort of 10 pSS and 6 age-matched control. The focus score was calculated by quantifying the total number of foci in the specimen, which is divided by the glandular surface area, and multiplied by 4, to give the number of foci per 4 mm2. Informed consent was obtained from all patients according to the Declaration of Helsinki and the study was approved by the Medical Research Ethics Committee of the UMCG.
Animals and reagents
All animal experiments were performed according to the ARRIVE guidelines. IL14α transgenic mice and related control B6 mice were housed in a 12-h light/dark cycle with ad libitum accesses to lab chow and water in germ free conditions as described previously by us [Citation36]. Animals were maintained in accordance with the guidelines established by the Institutional Animal Care and Use Committee. All animals used were females between 6 and 12 months of age and are regularly tested for common pathogens. Number of mice used for each experiment is included in the figure legends. Unless mentioned otherwise, all reagents used in the study were of molecular biology grade obtained from Sigma Chemicals (St. Louis. MO).
2D gel electrophoresis and mass spectrometry
Human parotid tissue samples from six control (non-SS-SICCA) and six pSS samples were ground using mortar and pestle and homogenized in lysis buffer using a glass homogenizer as previously described by us [Citation37]. Protein samples were quantified and labelled using spectrally distinct charge and mass-matched fluorescent dyes cyanine-3, (Cy3 – green for non-SS-SICCA), cyanine-5 (Cy5 – red for pSS) mixed and resolved simultaneously on a 2 D gel. Proteins labelled with different CyDye was visualized and quantified using DeCyder differential analysis software [Citation38]. The identity of individual spots was determined by using Liquid Chromatography that was linked with tandem mass spectrometry. Briefly, individual spots that were only present in controls and absent in pSS were excised from the 2 D gel, treated with trypsin for digestion, and the pool of peptides were separated using a Nano HPLC that are processed by a tandem mass spectrometer. The peptide data from individual spots were aligned using the MASCOT database search.
MicroRNA and RT-PCR
Human parotid tissues from individual (3 control and 3 pSS) biopsies (10 ng) as described above were extracted and pulverised using a mortar and pestle over dry ice. Total RNA, from the powdered tissues, were extracted using Trizol reagent, RIN calculations were performed to estimate the quality of the RNA, reverse transcribed, and PCR amplified using standard procedures as described earlier [Citation39]. miRNA was evaluated using a customised microarrays that had over 1600 known human miRNAs and control and pSS RNA samples were labelled with two different fluorophores and hybridised to identify the expression of individual miRNAs. Quantification of the flourophore of the hybridised microRNA was used to identify relative expression of individual microRNAs. Target validation was performed using Target scan and appropriate controls were used to naormalize the data. A 5-µl aliquot of the amplified product was resolved on a 1.5% agarose gel and the EtBr-stained bands were visualised using the Bio-Rad imager. Quantitative PCR was carried out using SYBR Green SensiMix (Quantace) according to the manufacturer’s instructions on a Light Cycler 480 (Roche). Pre-miR-132 primers used were CCGTGGCTTTCGATTG and GGCGACCATGGCTGTAGAC. Standard curves were constructed by plotting the threshold cycle (Ct) values against logarithm10 of the copy number and fitting by linear least square regression.
Immunohistochemistry and imaging
Human salivary glands (both parotid and minor glands from 6 control SICCA and 6 pSS) and parotid glands from mice were fixed in 4% paraformaldehyde in 0.1 M phosphate buffer (pH 7.2) containing 5% sucrose as previously described [Citation37,Citation39,Citation40]. Tissues were placed overnight in the same buffer as before containing 20% sucrose. Tissues were then embedded in Tissue-Tek OCT compound, frozen for 6 h and 10–12 µm thick cryosections were obtained. Haematoxylin and eosin (H&E) staining was performed on the sections using the standard procedure (Sigma, St. Louis, MO). Light images were obtained at 40× magnifications. For fluorescent confocal imaging, salivary gland sections from respective animals or from human biopsies were permeabilized at room temp with 0.1% TritonX-100 in PBS (pH 7.4), blocked (using 10% donkey serum and 5% BSA in PBS) and probed overnight with the respective primary antibodies in a hydrated chamber maintained at 4 °C. Following incubation with the primary antibodies, the slides were washed and incubated with fluorophore-conjugated respective secondary antibodies for 1 h at room temperature. Thereafter the slides were washed, and coverslip mounted using vectashield hardest mounting media with DAPI (Vector Laboratories, CA). Tunnel staining was performed using abcam tunnel assay kits. Images were acquired at 63× magnifications using a confocal laser-scanning LSM 510 Meta microscope (Carl Zeiss, Thornwood, NY). Morphological details and fluorescence were analysed using Image-J software (NIH). The antibodies used were the following monoclonal or polyclonal antibodies: anti-alpha-1 Antitrypsin Monoclonal Antibody (Invitrogen Cat# TMF1#4B5); Dilution in 1:100), anti-elastase (abcam; Cat# ab68672; Dilution used were 1:100), anti-F4/80 (abcam, MA; Cat# A3-1; Dilution used was 1:100), and anti-β-Actin (Cell Signalling, MA; Cat# 4970, at 1:200 dilution).
DNA methylation
Genomic DNA from non-SS-SICCA (control) and pSS samples were extracted using the Qiagen‐DNeasy Blood &Tissue Kit according to the supplier’s instructions (Qiagen). This included a proteinase K digestion at 55 °C overnight. DNA was quantitated with the Nanodrop ND‐1000 UV–Vis Spectrophotometer (Nanodrop Technologies, Wilmington, DE, USA). Site‐specific CpG methylation was analysed using Infinium® Human Methylation 450 K bead‐array‐based technique. Genomic DNA (1 µg) was treated with sodium bisulphite using the Zymo EZ DNA Methylation Kit™ (Zymo Research, Orange, USA) according to the manufacturer’s procedure, with the alternative incubation conditions recommended when using the Illumina Infinium® Methylation Assay [Citation41]. The methylation assay was performed from 4 µl converted gDNA at 50 ng/µl according to the Infinium® Methylation Assay Manual protocol. The quality of bead array data was checked with the GenomeStudio™ Methylation Module software.
Statistics
Data analysis was performed using Microsoft Excel or Origin 7.0 (Origin Lab). Statistical comparisons were made using one-way ANOVA. Experimental values are expressed as means ± SD or SEM. Differences in the mean values were significant at p < .05.
Results
Patient characteristics
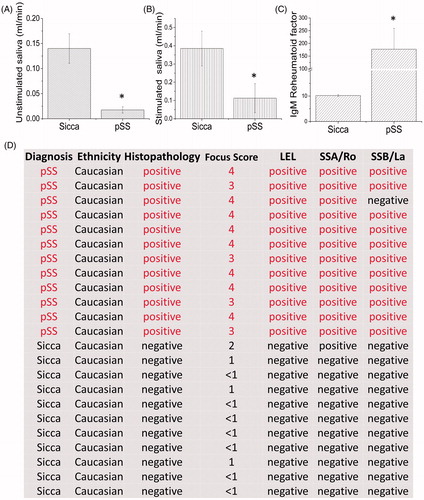
Control (non-SS Sicca) or pSS patients that were referred to the clinic were evaluated further based on the pSS criteria and samples from individuals that fulfil the pSS classification were used for this study. To identify changes in the expression of salivary gland proteins we used parotid gland tissues from age-matched non-SS-SICCA (as controls) and pSS patients. As shown in , a significant decrease in basal unstimulated saliva was observed in pSS samples when compared with age-matched non-SS-SICCA ((A), 80% decrease). In addition, stimulated saliva was also significantly decreased in pSS patients (). We next evaluated the IgM rheumatoid factor which was significantly increased (more than 10-fold) in pSS patients (). In addition, both anti-Ro and La autoantibodies were present in pSS samples, but absent in age-matched non-SS-SICCA samples, except in one patient where La antibody was not observed but had all other characteristics necessary to confirm pSS (). Tissues samples were sectioned and stained for H&E, which showed infiltration of immune cells in SS samples when compared with SICCA samples (, where positive indicates infiltration along with the focus score). Importantly, pSS samples also showed lymphoepithelial lesions (LEL) with a Chisholm score of more than 3 was termed positive for pSS samples. In addition, a shift to IgG anti-Ro/SSA was also observed in the biopsy samples of pSS when compared with non-SS-SICCA samples (). Together, these results confirm that the patients had pSS and were thus used for further evaluation.
Figure 1. Characterizationz of pSS patients. Patients (12 pSS and 11 control non-SS Sicca) were evaluated based on the ACR-EULAR criteria and saliva flow in control non-SS Sicca and pSS patients was evaluated. (A) indicates unstimulated, whereas stimulated saliva in non-SS-SICCA and pSS individuals is shown in (B). Error bars represent means ± SD, * indicates p < .05, respectively. C shows the quantification of the IgM RA factor between the non-SS-Sicca and pSS samples. * indicates a significant difference (p < .005). Description of non-SS-SICCA and pSS individuals along with histopathology and other parameters (including focus score, autoantibodies and histopathology) that were measured are provided in (D).
Loss of alpha-1 antiproteinase antitrypsin in pSS samples
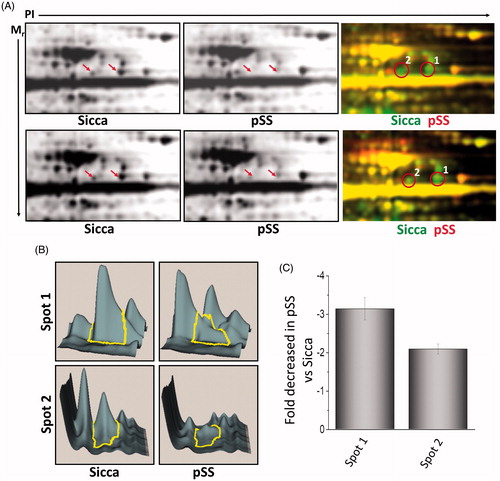
The use of 2 D-DIGE in quantitative proteomics permits the inclusion of multiple sample groups within the experimental design. Thus, we took advantage of this technology to investigate and compare the expression of various proteins in non-SS-SICCA and pSS samples. Total proteins were isolated from parotid glands of non-SS-SICCA and pSS and labelled with different fluorophores. This allowed us to compare both non-SS-SICCA and pSS conditions, as well as to compare individual samples, permitting the identification of proteins that showed a difference in abundance in pSS as compared to non-SS-SICCA. To minimize system and inherent biological variation, samples were labelled and multiplexed following these guidelines: (a) replicates from each group were alternatively labelled with Cy3 or Cy5, known as dye swapping; and, (b) two samples from the same experimental group were included in the same gel along with an internal standard used for quantification. A representative dye overlay gel image is shown in and as indicated two visible spots (labelled as 1-2 were observed in non-SS-SICCA samples that were either absent or decreased in pSS samples (). The DeCyder DIA module was used to detect and quantify the spots that exhibited statistically significant expression changes of ±1.3 fold (ANOVA, p < .05) and confirmed that the two spots were decreased in pSS samples (). Matching between the different gels was done through internal standard gel images using the BVA module. Expression changes were calculated for each protein spot between the two groups and derived from the log standardized protein abundance changes that were directly quantified within each DIGE gel, relative to the internal standard for the protein spot, which showed a 3-fold decrease in the expression of spot 1- and 2-fold decrease in spot 2 ().
Figure 2. Differential expression of proteins in control and pSS samples. (A) 2D separation of individual proteins based on PI and molecular weight in non-SS SICCA and pSS samples (data shown is representation of six control non-Sicca and six pSS samples). Individual proteins were labelled using two different dyes (green was used to label non-SS-SICCA; whereas, red was used to label pSS) and differential expression of individual proteins was evaluated based on the colour difference on the 2 D-gel. Individual spots were quantification using DeCyder analysis (B) and decrease in the fold change of spot 1 and 2 were determined in C.
To establish the identity of these proteins, both spots (from two individual gels) were excised from the gels and successfully identified using LC-MS/MS. The protein spots correspond to alpha-1 antiproteinase antitrypsin which was identified using 15 or unique peptides with a confidence of 99% at the protein level and 100% at the peptide level (). The MS/MS peptide sequence, precursor ion (m/z) and charge number are shown in the table and both the spots contained only a single protein. Furthermore, the experimental isoelectric focussing and molecular mass values agree with the corresponding theoretical values for all the spots identified, which increased our confidence. Overall, the data presented above suggest that alpha-1 antiproteinase antitrypsin expression is significantly decreased in pSS samples and could contribute towards the pathogenesis. To support the proteomic results, we next determined the expression of alpha-1 antiproteinase antitrypsin using confocal microscopy. As indicated in alpha-1 antiproteinase antitrypsin was expressed in the salivary gland cells obtained from non-SS-SICCA patient’s patients but was decreased in pSS samples (). In contrast, no change in the actin levels was observed between the two samples (non-SS-SICCA and pSS) (). The DIC and the DAPI image confirmed that the sections had both acinar and ductal cells and alpha-1 antiproteinase antitrypsin was expressed in the cytoplasm of the salivary gland cells. Overall the confocal studies confirm our proteomics data thereby showing that indeed salivary gland cells express alpha-1 antiproteinase antitrypsin, which was decreased in pSS samples.
Figure 3. Alpha 1 antitrypsin expression is decreased in pSS samples as well as in the mouse model for Sjogren’s syndrome. 10uM sections were obtained from parotid glands and the expression of individual proteins was assessed. (A) Representative confocal images showing staining with alpha 1 antitrypsin and actin antibodies in control and pSS samples data obtained was from four control and six pSS minor or parotid salivary glands. Similarly, parotid glands of SS mouse model (IL14α) were also sectioned and expression (data shown is a representation from three control and three IL14αTg mice) of alpha 1 antitrypsin was evaluated and shown in (B). (C) Shows H&E staining in salivary gland from control and IL14α mice (images are representation of three individual samples performed in duplicate). Marker for apoptosis (Tunnel staining) and immune cells (CD11b and F4/80) was also used to evaluate cell death and immune infiltration in control and IL14α mice. (D) Total saliva was estimated for 20 min in control (8 female mice) and 10 age-matched female IL14αTg mice. Error bars represent means ± SD and * indicates p < .05.
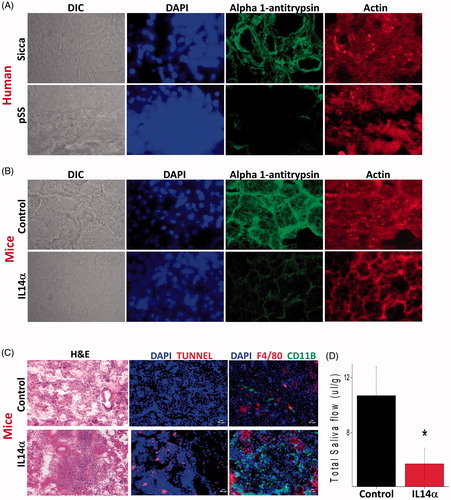
Table 1. Peptide information of the spots that were differentially expressed between control and pSS samples are shown in A.
Leucocyte infiltration and loss of alpha-1 antiproteinase in mouse models SS precede salivary gland degeneration. To establish that indeed loss of alpha-1 antiproteinase antitrypsin, which is observed in human samples is also observed in animal salivary gland, we used the IL14α Tg mouse model that shows characteristics like pSS [Citation36]. Sjögren’s syndrome patients expressed high level of IL14α in their peripheral blood. Similarly, IL14α overexpressing transgenic mice develop hypergammaglobulinemia, autoantibodies, infiltration of the parotid glands with lymphocytes, mild immune-complex mediated renal disease and large B cell lymphoma, and thus, are suggested as mouse models for SS. Importantly, 12 months old control mouse showed expression of alpha-1 antiproteinase antitrypsin in the parotid gland tissues, whereas 12 months old IL14α Tg mice showed decreased alpha-1 antiproteinase antitrypsin expression (). Again, no change in the actin levels was observed between salivary gland samples obtained from control and IL14α mouse models (). We next evaluated, if the expression of alpha-1 antiproteinase antitrypsin is decreased in earlier months and our results indicate that 3 months old IL14α Tg mice did not show any difference in alpha-1-antitrypsin expression (data not shown). Importantly, this decrease in alpha-1-antitrypsin expression coincides with the presence of immune infiltrates which were significantly increased in 12-month-old IL14α Tg mouse models of pSS (). Furthermore, tunnel staining that indicates apoptosis in salivary parotid glands was also increased in IL14α mouse models of SS when compared with age-matched controls (). Together these results suggest that loss of alpha-1 antiproteinase antitrypsin expression in the salivary gland epithelial cells could subject salivary tissues vulnerable towards enhanced protease activity that could lead to the loss of salivary tissues.
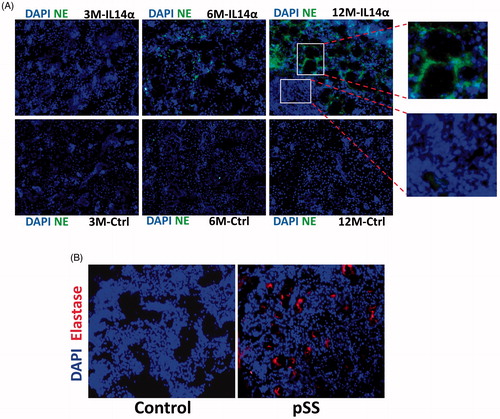
The data presented above suggest that in both pSS samples as well as in SS mouse models there is a decrease in alpha-1 antiproteinase antitrypsin expression, which could lead to an increase in leucocyte elastase. To confirm this, we again used the IL14α Tg mouse model, which showed an age-dependent increase in elastase staining. Importantly, 3 months old mice failed to show any expression of elastase and no difference in the staining between control and IL14α Tg mice was observed (). In contrast, 6 and 12-month-old IL14α Tg mice showed a gradual increase in elastase expression, which was absent in age-matched control parotid salivary gland cells. Importantly, a significant loss of acinar cells was observed in the region where elastase expression was present (). Like the mouse data, human samples also showed an increase in elastase activity (), which further supports that loss of alpha-1 antiproteinase expression could increase elastase activity. Together, these results suggest that loss alpha-1 antiproteinase expression in pSS leads to increased leukocyte elastase activity that promotes the loss of salivary gland cells.
Figure 4. Increased elastase expression in pSS samples as well as in IL14α mice. 10uM sections were obtained from submandibular glands and expression of leucocyte elastase was assessed in control and age-matched IL14α mice (A). Representative confocal images showing staining with elastase antibodies in control and pSS samples are shown in (B). Images shown are representation of three individual samples (three controls and three pSS or IL14-Τγ μιχε) περϕoρμεδ ιν δυπλιχατε.
miR-132 may be responsible for the loss of alpha-1 antiproteinase antitrypsin in SS
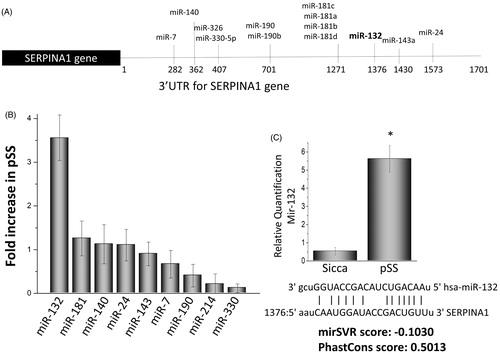
The results shown above provide substantial evidence that alpha-1 antiproteinase antitrypsin expression is decreased in pSS glandular tissue as well as in a mouse model of SS that could make them susceptible to various proteases that could subsequently lead to loss of salivary tissues. However, yet, there has been no report demonstrating why alpha-1 antiproteinase antitrypsin expression is decreased in pSS. Gene expression is controlled by several mechanisms that include epigenetic modifications as well as the up-regulation of certain microRNAs. Thus, we next evaluated if microRNAs that can inhibit expression of the gene that encodes for alpha-1 antiproteinase antitrypsin are altered in pSS. Importantly, we evaluated all the microRNAs that bind to the 3′ UTR region of the serpina1 gene (codes for alpha-1 antiproteinase antitrypsin) and thus could target alpha-1 antiproteinase, antitrypsin expression (). However, besides miR-132 that showed a ∼4 fold increased in the parotid samples obtained from pSS patients; whereas, all other microRNAs (miR-181, 140, 143, 24, 7, 190, 214, 330) that could target serpina1 expression did not show any significant changes in pSS (). To further confirm that indeed miR-132 expression is increased quantitative PCR was performed, which confirmed a significant increase in pSS samples when compared with non-SS-SICCA controls (). miR-330 was used as a control and did not show any difference between the two samples (data not shown). In addition, the seed sequence needed for target binding of miR-132 was conserved and the mirSVR (that uses the algorithm score), as well as the PhastCons score (that shows the conservation score), were substantially higher, suggesting that mir132 binds to serpin gene. It is thus conceivable that overexpression of miR-132 may be responsible for inhibiting alpha-1 antiproteinase antitrypsin expression in pSS.
Figure 5. Expression of microRNAs that affect the serpin 1 gene. (A) illustrations showing various microRNA binding sites at the 3′ untranslated region of the serpina1 gene. Alterations in the expression of various microRNAs in the parotid tissues of pSS patints as compared with control non SS Sicca are shown as fold change in (B) Data presented are representation of three individual samples (three controls non SS Sicca and three pSS) performed in duplicate. (C) Shows relative quantification of miR132 in non-SS-Sicca and pSS samples. Error bars represent means ± SD and * indicates p < .05.
An increase in DNA methylation of the serpin gene is observed in SS samples
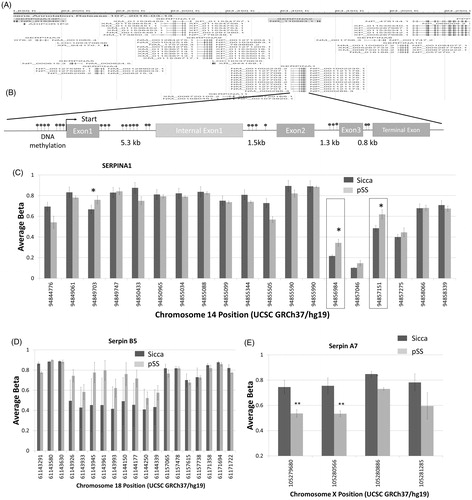
DNA methylation is also an important epigenetic control mechanism that regulates the pattern of gene expression in response to biological or environmental changes. Thus, we also probed if epigenetic modifications mainly DNA methylation patterns are altered as that could be another critical step involved in the regulation of alpha-1-antitrypsin expression. Using the gene browser, we looked at the gene region for all serpin genes. Importantly, all the serpin genes were clustered at a DNA location and showed the CpG islands that were present in both the promoter region as well as in the non-coding region of the gene (). Moreover, a comparison of the DNA methylation sites (evaluation of all predicated DNA methylation sites) in human pSS and non-SS SICCA parotid samples identified three main regions where the serpina1 gene has increased levels of methylation in pSS samples compared to non-SS SICCA, whereas other regions had no change in DNA methylation (). Hypermethylation in these DNA segments could also lead to a decrease in the expression of alpha-1-antitrypsin expression. We next evaluated if other serpin genes are also altered in their DNA methylation pattern. In contrast, serpin B5 did not show a significant increase in the DNA methylation in pSS samples when compared with non-SS-SICCA samples (), suggesting that hypermethylation was specific for serpina1 and more research is needed to fully evaluate the expression of these specific isoforms. In contrast, decreased methylation was observed in the serpin A7 gene region in pSS samples (), which could affect the expression of serpin A7. Together these results suggest that epigenetic modification such as DNA methylation could also alter the expression of these key genes that are important for the protection of salivary gland cells.
Figure 6. DNA methylations in the serpin gene. (A) Gene browser image showing the locus that clusters various serpin genes in humans. Model showing various DNA methylation sites as well as the exons/intron regions of serpina1 (B). Evaluation of all the DNA methylation sites on the serpina1 gene is shown as a bar graph in (C). Data presented are representation of samples from four controls non SS Sicca and four pSS samples performed in duplicate. Error bars represent means ± SD and * indicates p < .05. Evaluation of DNA methylation sites on the serpin B5 (D) and serpin A7 (E) gene are shown as bar graphs. Error bars represent means ± SD and * indicates p < .05.
Discussion
Regulated secretion of salivary fluid, which is mediated through the salivary glands, is a critical determinant of oral health. Salivary fluid secretion is decreased in various pathological conditions including pSS. However, the molecular mechanisms that underlie the loss of receptor-induced fluid secretion in pSS remain poorly defined. In this study, we showed that alpha1-antitrypsin protein expression was decreased in pSS samples when compared with age-matched non-SS SICCA controls. Our results not only confirm the expression of alpha1-antitrypsin in salivary gland cells but also suggest a potential role during the development of pSS. Alpha-1 antiproteinase antitrypsin has been shown as an acute-phase protein [Citation42], thus, it seems logical to assume that increase in the expression of alpha-1 antiproteinase antitrypsin could be important to combat immune activation and to protect against these proteases. Alpha-1 antiproteinase antitrypsin is widely distributed in body fluids, and its concentration is especially increased in acute inflammatory responses. Importantly, in intestinal epithelia, it is suggested that alpha-1 antiproteinase antitrypsin may be an important self-protective mechanism against various proteases such as the pancreatic proteolytic enzymes as well as and collagenase released from leucocytes [Citation43]. As salivary and pancreatic glands secrete similar proteases and have similar structure involving acini and the ductal system, it could be suggested that alpha 1 antiproteinase antitrypsin could be part of the self-defence mechanism in salivary glands as well. This is consistent with the data presented here, which showed that non-SS-SICCA salivary tissues have adequate expression of alpha-1 antiproteinase antitrypsin, which could support normal function. The self-controlling mechanism is important for maintaining the integrity of tissues in the oral cavity, which is related to the secretion of proteins that can counter the elastase and collagenase produced from immune cells. Lymphocytic infiltration of the salivary and lachrymal glands is the classical hallmark of pSS [Citation3] that also secretes proteases, such as serine proteases and could contribute to loss of salivary gland tissue. Our results show that a decrease in alpha-1 antiproteinase antitrypsin in pSS samples and an increase in cell death was also observed in mouse samples that are models for SS; however, if this is a causal relationship, it needs to be further explored. Importantly, the presence of an alpha-1 antiproteinase antitrypsin in salivary glands may indicate that one purpose of this protein could be to function as a defense mechanism and inhibit the degradation of the salivary gland cells. This is consistent with the data presented here as both increases in tunnel staining and a decrease in alpha-1 antiproteinase antitrypsin staining was observed in the animal models of pSS.
We next identified the factors that could explain as why the expression of alpha-1 antiproteinase antitrypsin was decreased in pSS. Epigenetic modifications have been shown to alter gene expression as well as contribute to pSS [Citation34,Citation44,Citation45], thus, we focussed our attention to see if epigenetic modifications are altered in pSS patients. DNA methylation has been long proposed that is responsible for the stable maintenance of gene expression patterns [Citation41,Citation46]. Specifically, DNA methylation establishes a silent chromatin state by collaborating with proteins that modify nucleosomes [Citation43]. Importantly, our results showed that DNA methylation was altered in serpinina1 gene encoding for alpha-1 antiproteinase antitrypsin. DNA methylation is a post-replication modification that is predominantly found in cytosines of the dinucleotide sequence CpG. The extent of DNA methylation changes in an orchestrated way and alterations in DNA methylation has been shown in various disease conditions. In cancer cells, methylation of CpG islands is known to contribute to gene silencing, suggesting that a similar mechanism could also be present in pSS, which needs to be further identified. Here we show that increased methylation in the promoter region of the serpinina1 gene was observed, which could inhibit the expression of alpha-1 antiproteinase antitrypsin protein. This was also specific as no significant decrease in other serpin genes was observed. Similarly, other epigenetic modifications such as histone modifications could also alter gene expression, and future research is needed to show if histone modifications are also altered in pSS.
Growing evidence indicates that microRNAs are involved in a variety of basic biological processes, including regulating gene expression and in pSS [Citation47]. microRNAs bind to a specific region of mRNA (mainly 3′ untranslated region) and as only a few bases of the seed sequence are needed to bind to the target mRNA, they may regulate multiple targets and can be important in every biological pathway. Here, we show that, compared with normal salivary tissue, microRNA 132 that binds to the serpina1 gene was increased (4-fold) in pSS sample versus non-SS-SICCA tissues. This is in accordance with previous studies which showed that the expression of alpha1 antitrypsin is dependent on the expression of mir-132 [Citation48]. Interestingly, the binding of mir-132 to the serpin mRNA could trigger translation repression or degradation of the serpin RNA, which could decrease its expression as observed in pSS samples. Of prime significance, our study identifies a possible epigenetic mechanism that increases proteases such as elastases that could contribute towards the loss of salivary gland tissues and explain why salivary gland function is decreased in pSS. Our data suggest that loss of serpin gene expression decreases alpha-1 antiproteinase antitrypsin protein which is unable to protect salivary gland cells against protease secreted by salivary and infiltrating immune cells. This attribute is mechanistically connected to the selective regulation of epigenetic mechanisms which results in the impaired expression of alpha-1 antiproteinase antitrypsin. Although the loss of an alpha-1 antiproteinase antitrypsin influences salivary gland cells, our data does not show if the expression of alpha-1 antiproteinase antitrypsin is decreased in other tissues. It is important to note that, alpha-1 antiproteinase antitrypsin is an acute-phase protein and more research is needed to establish if the expression of alpha-1 antiproteinase antitrypsin in other tissues is also epigenetically regulated. A distinct aspect of our study is that we show for the first time that loss of alpha-1 antiproteinase antitrypsin could contribute towards pSS. Thus, either reconstitution of alpha-1 antiproteinase antitrypsin expression or inhibition of elastase and other proteases could be a possible new therapy option to protect salivary gland dysfunction in pSS.
Author contributions
Conceptualization, methodology, and analysis, B.B.S. J.O, A.V., J.A and B.B.M. Investigation, J.O, F..Q. Z., P.C and Writing–Review and Editing, B.B.S. J.O, A.V., F.G.M.K. J.A, and B.B.M.
Acknowledgments
The authors acknowledge The Edward C. Carlson Imaging and Image Analysis core facility.
Disclosure statement
No potential conflict of interest was reported by the author(s).
Additional information
Funding
References
- Fox PC. Autoimmune diseases and Sjogren’s syndrome: an autoimmune exocrinopathy. Ann N Y Acad Sci. 2007;1098:5–21.
- Meijer JM, Meiners PM, Huddleston Slater JJ, et al. Health-related quality of life, employment, and disability in patients with Sjogren’s syndrome. Rheumatology. 2009;48(9):1077–1082.
- Mariette X, Criswell LA. Primary Sjögren's syndrome. N Engl J Med. 2018;378(10):931–939.
- Dawes C, Pedersen AM, Villa A, et al. The functions of human saliva: a review sponsored by the World Workshop on Oral Medicine VI Arch. Arch Oral Biol. 2015;60(6):863–874.
- Rischmueller M, Tieu J, Lester S. Primary Sjögren's syndrome. Best Pract Res Clin Rheumatol. 2016;30(1):189–220.
- Cartee DL, Maker S, Dalonges D, et al. Sjögren’s syndrome: oral manifestations and treatment, a dental perspective. J Dent Hyg. 2015;89:365–371.
- Baum BJ, Alevizos I, Chiorini JA, Cotrim AP, et al. Advances in salivary gland gene therapy - oral and systemic implications. Expert Opin Biol Ther. 2015;15(10):1443–1454.
- Leehan KM, Pezant NP, Rasmussen A, et al. Fatty infiltration of the minor salivary glands is a selective feature of aging but not Sjögren's syndrome. Autoimmunity. 2017;50(8):451–457.
- Rodrigues RA, Soares R. Inflammation in Sjögren's syndrome: cause or consequence? Autoimmunity. 2017;50(3):141–150.
- Kassan SS, Moutsopoulos HM. Clinical manifestations and early diagnosis of Sjogren syndrome. Arch Intern Med. 2004;164(12):1275–1284.
- Mavragani CP, Moutsopoulos HM. Sjögren’s syndrome. Annu Rev Pathol. 2014;9:273–285.
- Tzioufas AG, Voulgarelis M. Update on Sjögren’s syndrome autoimmune epithelitis: from classification to increased neoplasias. Best Pract Res Clin Rheumatol. 2007;21(6):989–1010.
- Nakata H, Yamamoto M, Kumchantuek T, et al. Synthesis, localization and possible function of serine (or cysteine) peptidase inhibitor, clade B, member 6a (Serpinb6a) in mouse submandibular gland. Cell Tissue Res. 2017;369(3):513–526.
- Sukumaran P, Sun Y, Zangbede FQ, et al. TRPC1 expression and function inhibit ER stress and cell death in salivary gland cells. FASEB Bioadv. 2019;1(1):40–50.
- Davies MJ, Lomas DA. The molecular aetiology of the serpinopathies. Int J Biochem Cell Biol. 2008;40(6-7):1273–1286.
- Krem MM, Di Cera E. Conserved Ser residues, the shutter region, and speciation in serpin evolution. J Biol Chem. 2003;278(39):37810–37814.
- Hunt JM, Tuder R. Alpha 1 anti-trypsin: one protein, many functions. Curr Mol Med. 2012;12(7):827–835.
- Janciauskiene SM, Nita IM, Stevens T. Alpha1-antitrypsin exerts in vitro anti-inflammatory activity in human monocytes by elevating cAMP. J Biol Chem. 2007;282(12):8573–8582.
- Gauldie J, Lamontagne L, Horsewood P, et al. Jenkins E Immunohistochemical localization of alpha 1-antitrypsin in normal mouse liver and pancreas. Am J Pathol. 1980;101(3):723–735.
- Perez P, Adriaansen J, Goldsmith CM, et al. Transgenic α-1-antitrypsin secreted into the bloodstream from salivary glands is biologically active. Oral Dis. 2011;17(5):476–483.
- Churg A, Dai J, Zay K, et al. Wright Alpha-1-antitrypsin and a broad spectrum metalloprotease inhibitor, RS113456, have similar acute anti-inflammatory effects. Lab Invest. 2001;81(8):1119–1131.
- Nita IM, Serapinas D, Janciauskiene SM. Alpha1-antitrypsin regulates CD14 expression and soluble CD14 levels in human monocytes in vitro. Int J Biochem Cell Biol. 2007;39(6):1165–1176.
- Goldstein S, Reddy P. Tolerance without toxicity? α1-antitrypsin as a novel alternative to immunosuppression. Expert Rev Clin Immunol. 2012;8(5):397–399.
- Tawara I, Sun Y, Lewis EC, et al. Alpha-1-antitrypsin monotherapy reduces graft-versus-host disease after experimental allogeneic bone marrow transplantation Proc. Proc Natl Acad Sci USA. 2012;109(2):564–569.
- McLean C, Greene C, McElvaney NG. Gene target therapeutics for liver disease in alpha-1 antiproteinase, antitrypsin deficiency. Biol Targets Therapy. 2009;3:63–75.
- Daemen MA, Heemskerk VH, van't Veer C, et al. Functional protection by acute phase proteins alpha(1)-acid glycoprotein and alpha(1)-antitrypsin against ischemia/reperfusion injury by preventing apoptosis and inflammation. Circulation. 2000;102(12):1420–1426.
- Ice JA, Li H, Adrianto I, et al. Genetics of Sjögren's syndrome in the genome-wide association era. J Autoimmun. 2012;39(1-2):57–63.
- Priori R, Medda EF, Conti EA, et al. Risk factors for Sjögren’s syndrome: a case-control study. Clin Exp Rheumatol. 2007;25:378–384.
- Cruz-Tapias P, Rojas-Villarraga A, Maier-Moore S, et al. HLA and Sjögren’s syndrome susceptibility. A meta-analysis of worldwide studies. Autoimmun Rev. 2012;11(4):281–287.
- Lessard CJ, et al. Variants at multiple loci implicated in both innate and adaptive immune responses are associated with Sjögren’s syndrome. Nat Genet. 2013;11:1284–1292.
- Dozmorov MG, Wren JD, Alarcón-Riquelme ME. Epigenomic elements enriched in the promoters of autoimmunity susceptibility genes. Epigenetics. 2014;9(2):276–285.
- Brooks WH, Le Dantec C, Pers JO, et al. Epigenetics and autoimmunity. J Autoimmun. 2010;34(3):J207–219.
- Renaudineau Y. The revolution of epigenetics in the field of autoimmunity. Clin Rev Allergy Immunol. 2010;39(1):1–2.
- Imgenberg-Kreuz J, Sandling JK, Nordmark G. Epigenetic alterations in primary Sjögren's syndrome - an overview. Clin Immunol. 2018;196:12–20.
- van Nimwegen JF, van Ginkel MS, Arends S, et al. Validation of the ACR-EULAR criteria for primary Sjögren's syndrome in a Dutch prospective diagnostic cohort. Rheumatology. 2018;57(5):818–825.
- Shen L, Zhang C, Wang T, et al. Development of autoimmunity in IL-14alpha-transgenic mice. J Immunol. 2006;177(8):5676–5686.
- Pani B, Xibao L, Bollimuntha S, et al. Impairment of TRPC1-STIM1 channel assembly and AQP5 translocation compromise agonist-stimulated fluid secretion in mice lacking caveolin1. J Cell Sci. 2013;126(Pt 2):667–675.
- Resing KA, Meyer-Arendt K, Mendoza AM, Aveline-Wolf LD, et al. Improving reproducibility and sensitivity in identifying human proteins by shotgun proteomics. Anal Chem. 2004;76(13):3556–3568.
- Liu X, Singh BB, Ambudkar IS. ATP-dependent activation of KCa and ROMK-type KATP channels in human submandibular gland ductal cells. J Biol Chem. 1999;274(35):25121–25129.
- Singh BB, Zheng C, Liu X, et al. Trp1-dependent enhancement of salivary gland fluid secretion: role of store-operated calcium entry. FASEB J. 2001;15(9):1652–1654.
- Baylin SB, Ohm JE. Ohm Epigenetic gene silencing in cancer - a mechanism for early oncogenic pathway addiction? Nat Rev Cancer. 2006;6(2):107–116.
- Ehlers MR. Immune-modulating effects of alpha-1 antitrypsin. Biol Chem. 2014;395(10):1187–1193.
- Huber-Lang M, Ekdahl KN, Wiegner R, et al. Auxiliary activation of the complement system and its importance for the pathophysiology of clinical conditions. Semin Immunopathol. 2018;40(1):87–102.
- Arvaniti P, Le Dantec C, Charras A, et al. Linking genetic variation with epigenetic profiles in Sjögren's syndrome. Clin Immunol. 2020;210:108314.
- Imgenberg-Kreuz J, Almlöf JC, Leonard D, et al. Shared and unique patterns of DNA methylation in systemic lupus erythematosus and primary Sjögren’s syndrome. Front Immunol. 2019;10:1686.
- Aslani S, Mahmoudi M, Karami J, et al. Epigenetic alterations underlying autoimmune diseases. Autoimmunity. 2016;49(2):69–83.
- Nayar G, Gauna A, Chukkapalli S, et al. Polymicrobial infection alter inflammatory microRNA in rat salivary glands during periodontal disease. Anaerobe. 2016;38:70–75.
- Hassan T, Carroll TP, Buckley PG, et al. miR-199a-5p silencing regulates the unfolded protein response in chronic obstructive pulmonary disease and α1-antitrypsin deficiency. Am J Respir Crit Care Med. 2014;189(3):263–273.