
Abstract
Sema4D, a member of the immune semaphorin family, plays crucial roles in the immune regulation, bone resorption and nervous system. It is also involved in angiogenesis and tumour progression. However, systemic studies on the correlation between Sema4D expression and the immune infiltration or clinical outcomes in tumours are still limited. Here, we analysed the landscape of Sema4D expression and its prognostic value in the cancer genome atlas pan-cancer as well as the correlation between Sema4D and immune cell infiltration by Tumour Immune Estimation Resource and Gene Expression Profiling interactive analysis online tools. Results showed that a higher Sema4D expression was significantly correlated with a favourable overall survival in diverse solid tumours including bladder cancer (Hazards Ratio (HR)=0.68, p = .0095), kidney renal clear cell carcinoma (HR = 0.61, p = .0016), melanoma (HR = 0.58, p = 6.6e-05) and thymoma (HR = 0.1, p = .011). Interestingly, Sema4D expression has positive correlation with various tumour infiltrating immune cells and immune cell biomarkers in these tumours. These results suggest that Sema4D could be a prospective biomarker for calculating hazard ratio of tumour patients and their tumour immune infiltration levels.
Introduction
Sema4D, also called CD100, is a type I transmembrane glycoprotein belonging to class 4 semaphorin [Citation1,Citation2]. It was first identified in immune cells, although it has been traditionally best described in the nervous system where it played a crucial role in axonal guidance [Citation1–5]. Lately, the physiological and pathological role of Sema4D in other systems have also been well explored, including cardiovascular system and immune system [Citation3,Citation6–11]. Increasing number of studies have revealed that Sema4D is involved in tumour growth and progression such as tumour angiogenesis and invasiveness [Citation12–18].
Sema4D has been reported to be highly expressed in several types of cancers including prostate, colon, breast, oral, lung, and pancreatic cancers, head and neck carcinomas, and soft tissue sarcomas [Citation13,Citation19–21]. The absence of Sema4D impaired tumour growth and angiogenesis in several tumours such as head and neck sarcomas, breast cancers [Citation22,Citation23]. Furthermore, the presence of Sema4D, originated from tumour-associated macrophages in tumour microenvironment was important for tumour growth and metastasis [Citation24]. In addition, Sema4D expression was associated with prognosis in several tumours such as soft tissue sarcomas, ovarian epithelial cancer, and cervical cancer [Citation25–29].
The role of Sema4D in the immune system including autoimmune disease has been well studied [Citation30,Citation31]. Sema4D commonly interacts with its low affinity receptor CD72 in the immune system [Citation9]. Sema4D is highly expressed in resting T cells, and activated B cells and APCs [Citation1,Citation32]. Sema4D was reported to promote the aggregation and survival of B cells, and enhance the antibody production, and the activation and maturation of APCs via interacting with CD72 [Citation1,Citation32,Citation33]. Sometimes, Sema4D might act as a receptor to regulate T cell activation and B cell terminal differentiation [Citation34–36]. In addition, lack of Sema4D resulted in a reduction of tumour-macrophages in tumour microenvironment, although the mechanism is still unclear [Citation24]. High expression of Sema4D influences the infiltration and distribution of leukocytes in tumour microenvironment [Citation37]. Blockade of Sema4D promoted immune cell infiltration and enhanced response to immunotherapies [Citation37]. All these studies suggested that engagement of Sema4D and its receptors play an important role in tumour progression. In this study, we comprehensively analysed the correlation of Sema4D expression with tumour immune infiltration and prognosis of pan-cancer in TCGA.
Materials and methods
Gene expression analysis
The expression level of the Sema4D gene in various cancers was identified in the Tumour Immune Estimation Resource (TIMER) tool (https://cistrome.shinyapps.io/timer/) [Citation38] based on TCGA pan cancer study. The protein levels of Sema4D and its receptors were investigated by CPTAC analysis module of the UALCAN online tool (http://ualcan.path.uab.edu/index.html), which provided protein expression analysis option using data from Clinical Proteomic Tumour Analysis Consortium (CPTAC) Confirmatory/Discovery dataset [Citation39]. The plots showed Z-value for relative protein expression level. Z-values represent standard deviations from the median across samples for the given cancer type. Log2 Spectral count ratio values from CPTAC were first normalised within each sample profile, then normalised across samples.
Survival analysis
Overall survival (OS) and disease-free survival (DFS) were analysed based on The Gene Expression Profiling Interactive Analysis (GEPIA) (http://gepia.cancer-pku.cn/index.html) [Citation40]. The patients were divided into the high and low groups by the median expression of Sema4D, PlexinB1, PlexinB2 or CD72 genes. The hazard ratio (HR) and 95% confidence interval were also calculated by GEPIA survival plot model. The results are displayed with HR and p values from a log-rank test.
Differential gene expression, GO and KEGG pathway analysis and Venn plots
The raw read counts data were downloaded from TCGA database and analysed by EdgeR package of R 3.6.0. False discovery rate (FDR)<0.05 and |log2 fold change (FC)| > 1 was considered to be significantly different in gene expression. Enrichment analysis of gene ontology (GO) function and Kyoto encyclopaedia of genes and genomes (KEGG) pathway for differential expression genes were performed by “org.Hs.eg.db,” “clusterProfiler,” “ggplot2” and “enrichplot” packages, and p value <.05 was regarded as statistically significant difference. For investigation of intersection among the tumours in differential expressed genes, GO and KEGG pathway, Venn diagrams were calculated and drawn by the online web server tools (http://bioinformatics.psb.ugent.be/webtools/Venn/).
Immune infiltration analysis and correlation analysis
We analysed the correlation of Sema4D expression with the abundance of immune infiltrates including CD8+ T cells, CD4+ T cells, B cells, neutrophils, macrophages, and dendritic cells using the TIMER database [Citation38]. The TIMER database includes 10,897 samples across diverse cancer types from TCGA to estimate the abundance of immune infiltrates from gene expression profiles by a deconvolution previously published statistical method [Citation41]. Gene expression levels against tumour purity is displayed on the left-most panel [Citation42]. In addition, correlations between Sema4D and markers of immune cells in normal tissue or tumour were explored via the correlation modules of GEPIA database by Spearman’s correlation analysis. The strength of the correlation was determined using the following guide: −0–0 “negative correlation,” 0–0.4 “weak correlation,” 0.4–0.7 “moderate correlation,” and 0.7–1 “strong correlation”. The gene markers are reported in previous studies [Citation43].
Results
Sema4D expression in human cancers
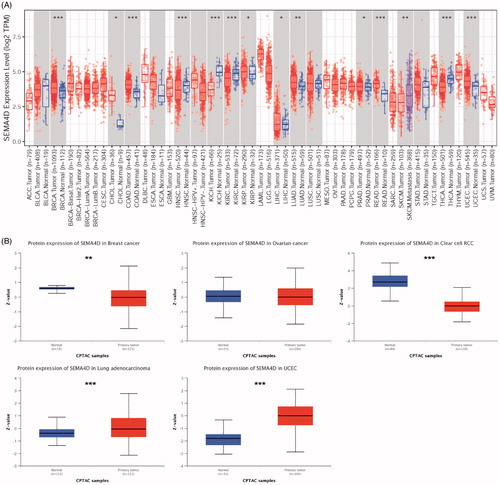
Sema4D mRNA expression is significantly altered in 13 types of tumours (13/33, 39.4%). Among them, Sema4D mRNA expression is significantly upregulated in 10 types of tumours, including breast invasive carcinoma (BRCA), cholangiocarcinoma (CHOL), colon adenocarcinoma (COAD), head and neck squamous cell carcinoma (HNSC), kidney renal papillary cell carcinoma (KIRP), liver hepatocellular carcinoma (LIHC), lung adenocarcinoma (LUAD), prostate adenocarcinoma (PRAD), rectum adenocarcinoma (READ) and uterine corpus endometrial carcinoma (UCEC). Conversely, Sema4D mRNA expression was downregulated in the rest 3 tumours, including kidney chromophobe (KICH), kidney renal clear cell carcinoma (KIRC) and thyroid carcinoma (THCA), compared to the adjacent normal tissues (). Acute myeloblastic leukaemia (LAML) harboured the highest Sema4D mRNA expression, and LIHC presented the lowest Sema4D mRNA expression among the 33 types of TCGA tumours. In addition, Sema4D mRNA expression in metastatic skin cutaneous melanoma (SKCM) was significantly higher than primary SKCM tumours. In order to analyse Sema4D protein level in human cancers, the Clinical Proteomic Tumour Analysis Consortium (CPTAC) database was used. Results showed that Sema4D protein levels were significantly downregulated in BRCA and KIRC, but upregulated in UCEC and LUAD compared to the corresponding normal tissues ( and Supplementary Table 1).
Figure 1. Sema4D expression levels in various human tumours. (A) Sema4D mRNA expression in human tumours and corresponding normal tissues based on TCGA database analysed by TIMER. (B) Sema4D protein expression levels in different types of human cancers compared with normal tissues based on the CPTAC database in UALCAN.
Sema4D is a potential prognostic marker in human cancers
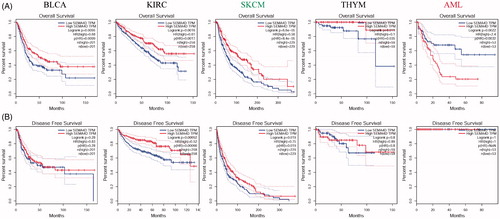
In order to investigate the correlation of Sema4D expression with prognosis of various cancers, the patients were divided into two groups according to median Sema4D expression levels. As shown in , Sema4D expression significantly affects the prognosis of five types of cancers, including BLCA, KIRC, SKCM, THYM and AML. A lower Sema4D expression indicated a poor overall survival in BLCA (HR = 0.68, p = .0095), KIRC (HR = 0.61, p = .0016), SKCM (HR = 0.58, p = 6.6e-05), THYM (HR = 0.1, p = .011), but a better overall survival in AML (HR = 2.4, p = .0022) (, upper panel). On the other hand, higher Sema4D expression was positively correlated to the diseases free survival (DFS) in KIRC (HR = 0.52, p = .00052), SKCM (HR = 0.75, p = .019) and Uveal Melanoma (UVM) (HR = 2.7, p = .034) (, low panel). The relationships between Sema4D expression and prognosis (OS and DFS) in 33 types of TCGA cancers were shown in Supplementary Figure 1(a,b).
Figure 2. Kaplan-Meier survival curves of patients with the high and low Sema4D expression analysed by GEPIA. Overall survival (A) and disease free survival (B) in bladder cancer (BLCA), kidney clear cell renal cancer (KIRC), melanoma (SKCM), thymoma (THYM), and acute myeloid leukaemia (AML). 95% confidence interval information was added as dotted line. The hazards ratio (HR) was calculated based on Cox PH Model. Log-rank test was used to significance analysis.
Sema4D expression is positively correlated with immune infiltration in human cancers
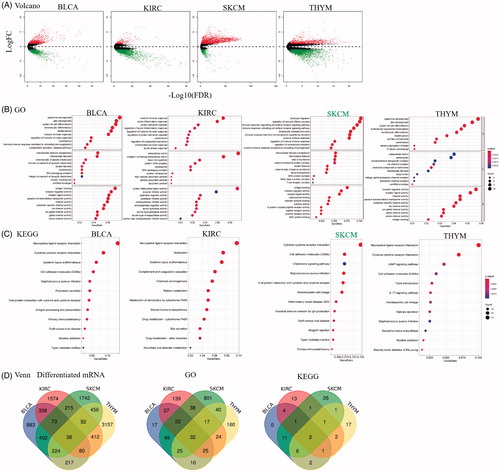
To gain insights into the biological function of Sema4D in cancers where it showed a prognostic potential, we downloaded the raw RNA-seq data of BLCA, KIRC, SKCM, and THYM from TCGA database. A total of 2255 DEGs in BLCA, 2822 DEGs in KIRC, 3242 DEGs in SKCM, and 4676 DEGs in THYM between higher Sema4D and lower Sema4D expression groups were found and shown in volcano plots (). GO and KEGG pathway functional analysis (TOP 10) was shown in . In addition, the Venn plots showed the intersections of DEGs, GO and KEGG. Total of 38 DEGs, 32 GO categories, and 2 KEGG pathways were enriched in these 4 cancers (, and Supplementary Table 1). Notably, GO categories related with immune response including humoral immune response and acute inflammatory response in the biological process (BP) ontology were shared in all 4 types of cancers (Supplementary Table 2).
Figure 3. The differential expressed genes between high and low Sema4D expression in BLCA, KIRC, SKCM and THYM. Enrichment analysis of Gene ontology (GO) function and Kyoto encyclopaedia of genes and genomes (KEGG) pathway for differential expression genes. (A) Volcano map showed the differential expressed genes. Green means decrease, and red means increase. (B) GO and (C) KEGG pathway analysis in BLCA, KIRC, SKCM, and THYM. (D) Venn plots showed the intersection in differential expressed genes, GO and pathway categories between high and low Sema4D expression in BLCA, KIRC, SKCM, and THYM.
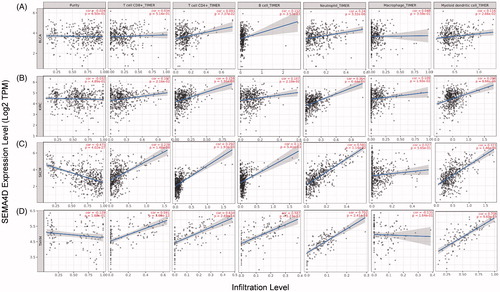
We next investigated the correlation of Sema4D expression with immune infiltration levels in different types of cancers by TIMER 2.0. Results showed that Sema4D expression was positively correlated with CD8+ T cells, CD4+ T cells, B cells, neutrophils and dendritic cells in most cancers including KIRC, SKCM and THYM ( and Supplementary Table 3).
Figure 4. Correlation of Sema4D with immune infiltration level in BLCA, KIRC, SKCM, and THYM in TIMER database. (A) Sema4D expression is significantly positive correlated with the infiltration of B cells, neutrophils, and dendritic cells in BLCA. (B) Sema4D expression is significantly positive related to the infiltration of CD8+ T cells, CD4+ T cells, B cells, neutrophils, macrophages, and dendritic cells in KIRC. (C) Sema4D expression is significantly negative correlated with tumour purity, but positive correlated with the infiltrating level of CD8+ T cells, CD4+ T cells, B cells, neutrophils, and dendritic cells in SKCM, other than macrophages. (D) Sema4D expression is significantly positive related to the infiltration of CD8+ T cells, CD4+ T cells, B cells, neutrophils, and dendritic cells in THYM.
Sema4D expression is correlated with markers of immune cell subsets
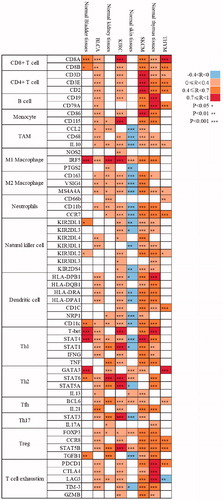
We further investigated the correlation between Sema4D expression and several characteristic molecular markers on immune cells, including CD8+ T cells, CD4+ T cells, B cells, monocytes, tumour-associated macrophages (TAM), M1/M2 macrophages, neutrophils, natural killer cells, dendritic cells, and subsets of functional T cells including T helper 1 (Th1), Th2, follicular helper T (Tfh), Th17, regulatory T (Treg) and exhausted T cells, in both tumour and normal tissues by GEPIA. Results showed that the correlation between Sema4D and most markers of immune cells significantly increased in BLCA, KIRC and SKCM, but decreased in THYM, compared to the corresponding normal tissues (). The most indicated markers of immune cells including CD4+ T cells, and B cells showed a positive link to Sema4D in BLCA and KIRC, but not in corresponding normal tissues. Interestingly, most immune cell markers including TAM markers (CCL2, CD68, IL10), M2 macrophage markers (CD163, VSIG4, MS4A4A), neutrophils markers (CD11b, CCR7), and dendritic cell markers (HLA-DPB1, HLA-DRA, HLA-DPA1, NRP1, CD11c) were negatively correlated with Sema4D in normal skin tissues, but switched to be positively correlated in SKCM. In contrast, most immune cell markers were positively correlated with Sema4D in normal thymus tissues, but the correlation was decreased or lost in THYM except for the markers of CD8+ T cell (CD8A, CD8B), Th2 (GATA3), and Tfh (BCL6). In addition, Sema4D had significant correlations with markers of exhausted T cells such as PD-1, CTLA4, LAG3 and TIM3 in BLCA, KIRC and SKCM, but not in THYM ( and Supplementary Table 4). These results suggested a correlation of Sema4D expression with infiltrating immune cells in various cancers, which could be used to explain the prognosis of tumour patients.
Figure 5. Correlation analysis between Sema4D and indicated genes or markers of immune cells in tumours and according normal tissues in GEPIA database. The strength of the correlation was determined using the following guide: −0–0 “negative correlation, blue,” 0–0.4 “weak correlation, orange,” 0.4–0.7 “moderate correlation, brown,” and 0.7–1 “strong correlation, red”. Pearson correlation coefficient was used. The non-log scale for calculation and use the log-scale axis for visualisation. Normal tissues contained TCGA normal tissues and GTEx data. *p < .05; **p < .01; ***p < .001.
Expression of Sema4D receptors and their prognostic significance in human cancers
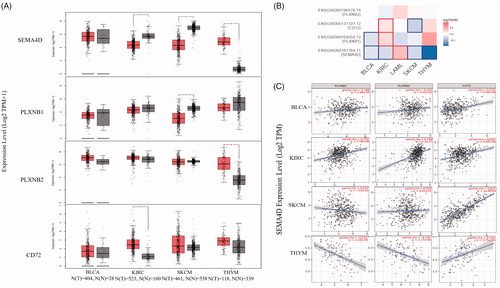
Since Sema4D showed potential prognosis values in cancers, we further explore the role of its receptors. We investigated the expression and prognostic significance of PlexinB1, PlexinB2 and CD72 via GEPIA. As shown in , PlexinB1 and CD72 had a higher expression in AML than normal tissues ()), a similar expression pattern to Sema4D. However, there was no significant difference in PlexinB1 and CD72 expression between SKCM and normal skin tissues. In addition, CD72 expression was higher in KIRC than normal kidney tissues. PlexinB2 seemed to have a lower expression in KIRC and SKCM, and a higher expression in THYM, compared to the corresponding normal tissues (). In addition, the protein levels of PlexinB1 and CD72 seemed to be downregulated in KIRC (Supplementary Table 1). In terms of prognosis, Sema4D and PlexinB1 had identical predictive values in BLCA, same as Sema4D and CD72 in SKCM. However, PlexinB1 and CD72 had a same prognostic significance in KIRC in the contrary to that of Sema4D ().
Figure 6. The expression, prognostic significance, and correlations of Sema4D and its receptors in diverse tumours. (A) the mRNA expression of Sema4D and its receptors PlexinB1, PlexinB2, and CD72 in BLCA (n = 404) comparing to the normal tissues (n = 28), in KIRC (n = 523) comparing to the normal tissues (n = 100), in SKCM (n = 461) comparing to the normal tissues (n = 558), and in THYM (n = 118) comparing to the normal tissues (n = 339) via GEPIA. *p < .01. (B) The overall survival significance map of Sema4D and its receptors in diverse tumours was analysed by GEPIA. The significant results were framed with blue line for negative correlation, and with red line for positive correlation. The filling colour from blue to red was used to show the hazards ratio (HR). (C) The correlation between the expression of Sema4D and its receptors in BLCA, KIRC, SKCM and THYM was calculated by TIMER.
The correlation between Sema4D expression and its receptors
We further investigated the correlation between Sema4D expression and its receptors in these tumours by TIMER. Results showed that PlexinB1(Plxnb1) was positively linked to Sema4D in BLCA (R = 0.188, p = 2.96E-04) and KIRC (R = 0.255, p = 2.19E-08), but negatively associated with Sema4D in THYM (R=-0.515, p = 3.94E-09). PlexinB2 was significantly correlated to Sema4D in BLCA (R = 0.152, p = 3.42E-03), KIRC (R = 0.358, p = 2.2E-15), and THYM (R=-0.435, p = 1.17E-06). CD72 was positively correlated to Sema4D in BLCA (R = 0.275, 8.56E-08), KIRC (R = 0.205, p = 9.06E-06), SKCM (R = 0.79, p = 1.14E-56), and THYM (R = 0.316, p = 5.75E-04) (). Among all the three Sema4D receptors, CD72 showed the strongest positive correlation with Sema4D in SKCM, BLCA and THYM, while PlexinB2 had the highest correlation in KIRC. In contrast, PlexinB1 had a negative correlation with Sema4D in THYM.
Discussion
In this study, we revealed the landscape of Sema4D expression that is upregulated in most tumours and positively correlated with tumour immune infiltration based on the TCGA RNA-Seq data. Sema4D seemed to be a significant prognosis marker in at least five types of tumours including BLCA, KIRC, SKCM, THYM and AML. Interestingly, higher Sema4D expression was significantly correlated with better prognosis of solid tumours among these 5 cancers, but with a poor prognosis of blood cancer AML. Importantly, Sema4D expression positively correlated to the immune infiltrating levels and diverse immune markers in various tumours, suggesting that Smea4D might participate in immune-regulation of cancers. Furthermore, the expression of Sema4D receptors and their correlations with prognosis are diverse in different types of cancers. Together, our study provided insights in understanding the potential role of Sema4D in tumour immunology and applicability as a tumour prognostic biomarker.
Our findings that higher Sema4D expression was linked to a favourable clinical outcome, seemed to be different from previous studies that Sema4D enhances tumour angiogenesis and progression [Citation17]. In fact, the outcome of patients is affected by many factors such as therapeutic efficiency and sensitivity, compliance of patients, and so on. For example, BCR-ABL fusion gene is a driver factor in pathogenesis and progression of chronic myeloid leukaemia (CML), but the CML patients with BCR-ABL have a favourable outcome because of the application of tyrosine kinase inhibitors [Citation44]. In addition, the different reference cohort could also partly account for this discrepancy. Nevertheless, most previous studies on the biological activity of Sema4D was commonly investigated by manipulation of Sema4D expression in cancer cell lines and mice, rather than in human patients [Citation18].
Another aspect of this study was the correlation of Sema4D expression with diverse immune infiltration in different tumours, especially in BLCA, KIRC and SKCM. The increasing immune infiltration might affect the immunogenicity of the tumours, promoting survival. Some biomarkers have been discovered to linked to the tumour immune cell infiltration such as ANXA1 and CMA1 [Citation45,Citation46]. It was well known that Sema4D was highly expressed in T cells, activated B cells and APCs [Citation1,Citation32,Citation33]. Sema4D expression is positive related to the infiltration of CD4+ T cell, B cell and DCs, suggesting that these immune cells possibly contributed to the high Sema4D expression. Consistently, TAM markers such as CCL2, CD86, and IL10 are significantly associated with high Sema4D expression. While TAM had been reported to secret Sema4D in diverse tumours () [Citation24]. In addition, Sema4D showed a strong correlation with T cell exhaustion markers including PD-1, CTLA-4 and TIM-3, which might affect the anti-tumour function of T cells [Citation47,Citation48]. It suggested that modulation of Sema4D expression might act in synergy with some immunomodulatory therapies, which needs to be further investigated.
Most studies suggest that Sema4D acts as an angiogenic and tumour aggressive factor mainly through PlexinB1 [Citation17]. Low PlexinB1 expression indicated a poor prognosis in BLCA, which is consistent with Sema4D. In contrast, low PlexinB1 expression showed a good prognosis in KIRC, and PlexinB1 has no prognostic significance in SKCM, THYM and AML, which were different from Sema4D. Similar results have been found in the prognostic significance of CD72 in KIRC and SKCM as well. These results suggested the complexity and importance of Sema4D- PlexinB1/CD72 signalling in tumour progression.
In summary, our findings suggested that Sema4D played an important role in recruitment and regulation of tumour immune infiltrating cells, and would be a potential prognostic biomarker for BLCA, KIRC and SKCM. Relatively lower levels of Sema4D in these tumours indicated a higher risk of relapse and close medical supervision might be needed for such patients.
Author contributions
QL and ZZ contribute to the conception and design of the study; QL, PC, YY, ZL, GC contribute to the acquisition of the data, analysis and interpretation of the data; ZZ and QL wrote and revise the manuscript.
supplementary_materials.rar
Download (4.1 MB)Disclosure statement
No potential conflict of interest was reported by the author(s).
Additional information
Funding
References
- Hall KT, Boumsell L, Schultze JL, et al. Human CD100, a novel leukocyte semaphorin that promotes B-cell aggregation and differentiation. Proc Natl Acad Sci U S A. 1996;93(21):11780–11785.
- Furuyama T, Inagaki S, Kosugi A, et al. Identification of a novel transmembrane semaphorin expressed on lymphocytes. J Biol Chem. 1996;271(52):33376–33381.
- Giraudon P, Vincent P, Vuaillat C. T-cells in neuronal injury and repair: semaphorins and related T-cell signals. Neuromolecular Med. 2005;7(3):207–216.
- Bougeret C, Mansur IG, Dastot H, et al. Increased surface expression of a newly identified 150-kDa dimer early after human T lymphocyte activation. J Immunol. 1992;148:318–323.
- Mizui M, Kumanogoh A, Kikutani H. Immune semaphorins: novel features of neural guidance molecules. J Clin Immunol. 2009;29(1):1–11.
- Zhu L, Stalker TJ, Fong KP, et al. Disruption of SEMA4D ameliorates platelet hypersensitivity in dyslipidemia and confers protection against the development of atherosclerosis. Arterioscler Thromb Vasc Biol. 2009;29(7):1039–1045.
- Mou P, Zeng Z, Li Q, et al. Identification of a calmodulin-binding domain in Sema4D that regulates its exodomain shedding in platelets. Blood. 2013;121(20):4221–4230.
- Lu Q, Dong N, Wang Q, et al. Increased levels of plasma soluble Sema4D in patients with heart failure. PLoS One. 2013;8(5):e64265.
- Ishida I, Kumanogoh A, Suzuki K, et al. Involvement of CD100, a lymphocyte semaphorin, in the activation of the human immune system via CD72: implications for the regulation of immune and inflammatory responses. Int Immunol. 2003;15(8):1027–1034.
- Kikutani H, Kumanogoh A. Semaphorins in interactions between T cells and antigen-presenting cells. Nat Rev Immunol. 2003;3(2):159–167.
- Li M, O’Sullivan KM, Jones LK, et al. Endogenous CD100 promotes glomerular injury and macrophage recruitment in experimental crescentic glomerulonephritis. Immunology. 2009;128(1):114–122.
- Conrotto P, Valdembri D, Corso S, et al. Sema4D induces angiogenesis through Met recruitment by Plexin B1. Blood. 2005;105(11):4321–4329.
- Basile JR, Castilho RM, Williams VP, et al. Semaphorin 4D provides a link between axon guidance processes and tumor-induced angiogenesis. Proc Natl Acad Sci U S A. 2006;103(24):9017–9022.
- Basile JR, Holmbeck K, Bugge TH, et al. MT1-MMP controls tumor-induced angiogenesis through the release of semaphorin 4D. J Biol Chem. 2007;282(9):6899–6905.
- Neufeld G, Kessler O. The semaphorins: versatile regulators of tumour progression and tumour angiogenesis. Nat Rev Cancer. 2008;8(8):632–645.
- Flannery E, Duman-Scheel M. Semaphorins at the interface of development and cancer. Curr Drug Targets. 2009;10(7):611–619.
- Ch’ng ES, Kumanogoh A. Roles of Sema4D and Plexin-B1 in tumor progression. Mol Cancer. 2010;9:251.
- Yang Y, Wang J, Li H, et al. Association between prognosis and SEMA4D/Plexin-B1 expression in various malignancies: a meta-analysis. Medicine (Baltimore). 2019;98(7):e13298.
- Kato S, Kubota K, Shimamura T, et al. Semaphorin 4D, a lymphocyte semaphorin, enhances tumor cell motility through binding its receptor, plexinB1, in pancreatic cancer. Cancer Sci. 2011;102(11):2029–2037.
- Jiang H, Chen C, Sun Q, et al. The role of semaphorin 4D in tumor development and angiogenesis in human breast cancer. Onco Targets Ther. 2016;9:5737–5750.
- Zhou H, Kann MG, Mallory EK, et al. Recruitment of Tiam1 to Semaphorin 4D activates rac and enhances proliferation, invasion, and metastasis in oral squamous cell carcinoma. Neoplasia. 2017;19(2):65–74.
- Zhang C, Qiao H, Guo W, et al. CD100-plexin-B1 induces epithelial-mesenchymal transition of head and neck squamous cell carcinoma and promotes metastasis. Cancer Lett. 2019;455:1–13.
- Yang YH, Buhamrah A, Schneider A, et al. Semaphorin 4D promotes skeletal metastasis in breast cancer. PLoS One. 2016;11(2):e0150151.
- Sierra JR, Corso S, Caione L, et al. Tumor angiogenesis and progression are enhanced by Sema4D produced by tumor-associated macrophages. J Exp Med. 2008;205(7):1673–1685.
- Ch’ng E, Tomita Y, Zhang B, et al. Prognostic significance of CD100 expression in soft tissue sarcoma. Cancer. 2007;110(1):164–172.
- Chen Y, Zhang L, Pan Y, et al. Over-expression of semaphorin4D, hypoxia-inducible factor-1alpha and vascular endothelial growth factor is related to poor prognosis in ovarian epithelial cancer. IJMS. 2012;13(12):13264–13274.
- Campos M, DE Campos SGP, Ribeiro GG, et al. Ki-67 and CD100 immunohistochemical expression is associated with local recurrence and poor prognosis in soft tissue sarcomas. Respectively. Oncol Lett. 2013;5(5):1527–1535.
- Chen Y, Zhang L, Lv R, et al. Overexpression of Semaphorin4D indicates poor prognosis and prompts monocyte differentiation toward M2 macrophages in epithelial ovarian cancer. Asian Pac J Cancer Prev. 2013;14(10):5883–5890.
- Liu H, Yang Y, Xiao J, et al. Semaphorin 4D expression is associated with a poor clinical outcome in cervical cancer patients. Microvasc Res. 2014;93:1–8.
- Zhang D, Li Z, Zhang R, et al. Identification of differentially expressed and methylated genes associated with rheumatoid arthritis based on network. Autoimmunity. 2020;53(6):303–313.
- Besliu A, Banica L, Predeteanu D, et al. Peripheral blood lymphocytes analysis detects CD100/SEMA4D alteration in systemic sclerosis patients. Autoimmunity. 2011;44(5):427–436.
- Kumanogoh A, Suzuki K, Ch’ng E, et al. Requirement for the lymphocyte semaphorin, CD100, in the induction of antigen-specific T cells and the maturation of dendritic cells. J Immunol. 2002;169(3):1175–1181.
- Kumanogoh A, Watanabe C, Lee I, et al. Identification of CD72 as a lymphocyte receptor for the class IV semaphorin CD100: a novel mechanism for regulating B cell signaling. Immunity. 2000;13(5):621–631.
- Herold C, Bismuth G, Bensussan A, et al. Activation signals are delivered through two distinct epitopes of CD100, a unique 150 kDa human lymphocyte surface structure previously defined by BB18 mAb. Int Immunol. 1995;7(1):1–8.
- Herold C, Elhabazi A, Bismuth G, et al. CD100 is associated with CD45 at the surface of human T lymphocytes. Role in T cell homotypic adhesion. J Immunol. 1996;157:5262–5268.
- Billard C, Delaire S, Raffoux E, et al. Switch in the protein tyrosine phosphatase associated with human CD100 semaphorin at terminal B-cell differentiation stage. Blood. 2000;95(3):965–972.
- Evans EE, Jonason AS, Jr.,Bussler H, et al. Antibody blockade of semaphorin 4D promotes immune infiltration into tumor and enhances response to other immunomodulatory therapies. Cancer Immunol Res. 2015;3(6):689–701.
- Li T, Fan J, Wang B, et al. TIMER: a web server for comprehensive analysis of tumor-infiltrating immune cells. Cancer Res. 2017;77(21):e108–e110.
- Chandrashekar DS, Bashel B, Balasubramanya SAH, et al. UALCAN: a portal for facilitating tumor subgroup gene expression and survival analyses. Neoplasia. 2017;19(8):649–658.
- Tang Z, Li C, Kang B, et al. GEPIA: a web server for cancer and normal gene expression profiling and interactive analyses. Nucleic Acids Res. 2017;45(W1):W98–W102.
- Li B, Severson E, Pignon JC, et al. Comprehensive analyses of tumor immunity: implications for cancer immunotherapy. Genome Biol. 2016;17(1):174.
- Aran D, Sirota M, Butte AJ. Systematic pan-cancer analysis of tumour purity. Nat Commun. 2015;6:8971.
- Danaher P, Warren S, Dennis L, et al. Gene expression markers of Tumor Infiltrating Leukocytes. J Immunother Cancer. 2017;5:18.
- Mahon FX. Treatment-free remission in CML: who, how, and why? Hematol Am Soc Hematol Educ Program. 2017;2017(1):102–109.
- Liang Z, Li X. Identification of ANXA1 as a potential prognostic biomarker and correlating with immune infiltrates in colorectal cancer. Autoimmunity. 2021;54(2):76–87.
- Shi S, Ye S, Mao J, et al. CMA1 is potent prognostic marker and associates with immune infiltration in gastric cancer. Autoimmunity. 2020;53(4):210–217.
- Duraiswamy J, Kaluza KM, Freeman GJ, et al. Dual blockade of PD-1 and CTLA-4 combined with tumor vaccine effectively restores T-cell rejection function in tumors. Cancer Res. 2013;73(12):3591–3603.
- Ngiow SF, von Scheidt B, Akiba H, et al. Anti-TIM3 antibody promotes T cell IFN-gamma-mediated antitumor immunity and suppresses established tumors. Cancer Res. 2011;71(10):3540–3551.