
Abstract
The spatial distribution of microorganisms represents a critical issue in understanding biofilm function. The aim of the current work was to develop a method for biofilm fractionation, facilitating the analysis of individual spatial biofilm layers using metagenomic approaches. Phosphorus accumulating biofilm applied in an enhanced biological phosphorus removal wastewater treatment plant, were fractionated, and analyzed. The fractionated biofilm revealed a surprising spatial distribution of bacteria and genes, where potential polyphosphate accumulating organisms account for ∼ 47% of the inner layer microbiome. A spatial distribution of genes involved in dissimilatory nitrogen reduction was observed, indicating that different layers of the biofilm were metabolically active during the anoxic and aerobic zones of the phosphorus removal process. The physical biofilm separation into individual fractions unveiled functional layers of the biofilm, which will be important for future understanding of the phosphorus removal wastewater process.
Introduction
Biofilms represent the first multicellular forms of life, being crucial for a range of essential processes on earth, such as the global biogeochemical cycles (Westall et al. Citation2001; Allwood et al. Citation2009; Flemming et al. Citation2016). Although biofilms have been extensively investigated for > 50 years (Lappin-Scott et al. Citation2014) knowledge of the population structure and function of complex biofilms, such as those operating in wastewater treatment plants (WWTPs) are still limited. In particular, understandings of the stratification of the microbial community and the associated biochemical functions are limited. To the authors’ knowledge no studies have yet investigated the microbial composition and functionality of individual spatial fractions of biofilms using metagenomic approaches. A method was developed for the physical separation of layers of phosphorus accumulating biofilms, followed by metagenomic analyses of each layer.
Due to the efficiency and low footprint, biofilms are widely used for wastewater treatment and have been applied for nitrogen removal for nearly 50 years. Recently, moving bed-based biofilms have also been applied for removal of phosphorus from wastewater through the Hias process (Saltnes et al. Citation2017). The Hias process is a multistage enhanced biological phosphorus removal (EBPR) moving bed biofilm reactor (MBBR) WWTP consisting of a single continuous reactor (). A challenge for EBPR is that the biofilms need to be transferred between oxic and anoxic zones for phosphorus accumulation and removal respectively, to occur (Comeau et al. Citation1986). In EPBR systems, phosphorus accumulating organisms (PAO) take up and store phosphorus as polyphosphate (polyP) under aerobic conditions. Under anaerobic conditions these organisms actively incorporate reduced compounds such as short chain fatty acids (SCFAs), amino acids or sugars, and covert them to polymers such as polyhydroxyalkanoate (PHA) at the expense of energy stored as polyP (Marques et al. 2017). These processes are energetically favorable in phosphate and SCFA rich environments, when the PAOs are cycled between oxic and anoxic conditions. In the Hias process the oxic/anoxic requirement is solved by active transport of biofilm carriers along with the wastewater through ten stages, the first three being anoxic and the following seven oxic. Wastewater enters the reactor in a mechanically agitated anoxic part where it is mixed with biofilm carriers. Then wastewater and biofilm carriers flow by gravity through three anoxic and seven oxic zones in a plug-flow pattern. In the tenth zone, treated wastewater and sloughed off biofilm leaves the reactor, while the biofilm carriers are conveyed dry back to the start of the reactor (). The resulting EBPR system is stable and highly efficient with > 95% phosphorus removal and PO4-P < 0.20 mg l−1 combined with a total soluble chemical oxygen demand (SCOD) removal of 80% (Saltnes et al. Citation2017). In addition to providing efficient phosphorus removal, the Hias process also shows significant potential for nitrogen removal, up to 40% when operating at the highest cost-effective phosphorus removal mode (Saltnes et al. Citation2017). Recently, the temporal stability of the Hias biofilm over one year was investigated (Rudi et al. Citation2019), identifying temperature as a single factor significantly affecting both the phosphorus removal efficiency and the microbiota composition. It is not known, however, how the microorganisms with different properties are spatially distributed within the biofilm. This knowledge is of fundamental importance for understanding biofilm function for the Hias process. The aim of the current work was therefore to develop a method for the physical separation of the Hias biofilm in order to investigate the functional stratification of biofilms using metagenomic approaches.
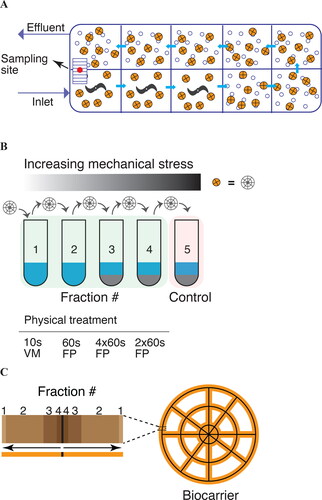
Figure 1. Schematics of the Hias enhanced biological phosphorus removal (EBPR) wastewater treatment process (A), biofilm fractionation strategy (B), and the estimated physical location of the individual biofilm fractions (C). (A) The Hias EBPR process is a moving bed biofilm reactor (MBBR) containing a single reactor divided into ten zones, where the first three zones following the influx are anoxic and the following seven aerobic, with aeration. The conveyor belt transports the carriers between the last (10th) and first (1st) zone. The orange and open circles represent the biofilm carrier and air, respectively. Biofilm carriers were sampled (red circle) from the conveyor belt. (B) The biofilm was fractionated into five fractions by applying increased mechanical stress using whirl mixer (WM) or FastPrep (FP) instrumentation. Sand as an abrasive (grey color) was used in the last three fractionation steps. Fractionation was performed using four biocarriers in parallel. (C) Schematics of the estimated locations of the different fractions based on quantitative PCR analysis.
Material and methods
Sample collection
Biofilm carriers were collected on 28 August 2018, from a fully operating WWTP located in Hamar, Norway. The plant runs the Hias process (Saltnes et al. Citation2017) to clean municipal wastewater (), performing ∼ 95% phosphorus removal efficiency. On the day of sampling for the current study, the following nutrient loads (mg l−1) were measured at the inlet and outlet, respectively: PO4-P 6.88 and 0.047, SCOD 422 and 132, and NH4-N 63 and 34. After collection, the carriers were immediately frozen at −20 °C prior to biofilm fractionation.
Optimization of the biofilm fractionation protocol
Fractionation of the biofilm was performed using mechanical stress in the form of shaking. To optimize a protocol for fractionation, the following parameters were varied the vigor of the shaking, the time of processing and the addition of sand as an abrasive. Shaking was conducted using a vortex mixer and Fast Prep 24 instrumentation (MP Biomedicals, Thermo Fisher Scientific, USA). The strategy was to extract the bacteria loosely associated with the biofilm in the first fraction, the majority of the biofilm in the second fraction, and bacteria tightly associated with the biofilm-carrier in a third fraction. To extract biofilm material in the third fraction, an abrasive (fine sand), was needed. A fourth fraction was included to extract biofilm material strongly associated to the biocarrier. A final fifth step with sand served as a control to ensure all detectable DNA was extracted. Extracted DNA from the biofilm fractions was quantified through 16S rRNA quantitative PCR (qPCR) analysis and if DNA was detected in the fifth fraction, either fractionation time and/or the vigor were increased. The optimized protocol was as follows first fraction vortexing at 3,000 rpm for 10 s, then fractionations for 60 s at 6.5 m s−1 using FastPrep 24 and program BG:2 × 50, once for the second fraction, four times for the third fraction, twice for the fourth fraction and once for the fifth fraction ().
Biofilm fractionation and DNA extraction
Four random biofilm carriers were selected and fractionated into five (1-5) samples as described. Fractionations were performed independently on each biofilm carrier in separate tubes containing TE buffer (10 mM Tris, 0.1 mM EDTA, pH8.0) completely covering the biocarriers, with ∼ 1.6 g of sand added to the last three fractionation steps (). After each fractionation step, the biocarrier was carefully moved to a new tube for the next step, while the biofilm suspension was used for DNA isolation. The samples for fraction 3 and 4 were incubated on ice for 5 min between each consecutive FastPrep 24 run.
Triplicates of all fractions where mechanically lysed by transferring 200 µl of the biofilm suspension to FastPrep tubes (MP Biomedicals, Thermo Fisher Scientific, USA) with acid-washed beads (0.2 g < 106 µm, 0.2 g 425–600 µm, 2pcs 2.5–3.5 mm, Sigma Aldrich) and processed using FastPrep 96 instrumentation (MP Biomedicals) at 1800 rpm for 40 s with 5 min incubation on ice between runs. The samples, a total of 60, were then centrifuged at 13,000 xg for 5 min, the supernatant collected, and DNA extracted immediately. DNA extraction was performed using a KingFisher flex robot (Thermo Scientific, USA) and the Mag Midi kit (LGC Genomics, UK) following the manufacturer’s instructions.
16s rRNA gene copy number quantification by quantitative PCR (qPCR)
The total 16S rRNA gene content in each fraction was quantified by qPCR targeting the V3-V4 hypervariable regions of the gene. 2 µl DNA samples (0.1-10 ng µl−1) were used as templates in reactions containing 1x HOT FIREPol® EvaGreen supermix (Solis BioDyne, Estonia) and 0.2 µM of each of the two primers, 341 F and 806 R (Yu et al. Citation2005). Amplification was performed on a LightCycler480 II (Roche, Germany) using the following cycling parameters: 95 °C for 15 min, followed by 40 cycles of 95 °C for 30 s, 55 °C for 30 s, 72 °C for 45 s. A standard curve was created from known quantities of DNA from a lab strain of E. coli, to correlate DNA concentration with 16S rRNA gene content.
16s rRNA gene sequencing
Two microliters of the extracted DNA (0.1-10 ng µl−1) from each of the fractions 1-4 were PCR amplified with a reaction mixture consisting of 1x HOT FIREPol® Blend Master Mix Ready to Load (Solis Biodyne, Estonia) and 0.2 µM of each of the primers 341 F and 806 R on a 2720 Thermal Cycler (Applied Biosystem, USA) using the following cycling parameters: 95 °C for 15 min, (95 °C for 30 s, 55 °C for 30 s, 72 °C for 45 s) for 25-30 cycles, 72 °C for 7 min. Index PCR was performed with combinatorial dual indexing to ensure all samples assigned a unique combination of index primers (InvitrogenTM, Thermal Fischer Scientific, USA). Except for the primers, the same reaction mixture as described for the initial amplification were utilized in the index PCR. The amplification was conducted using a 2720 Thermal Cycler with the following program parameters: 95 °C for 5 min, then 95 °C for 30 s, 55 °C for 1 min, 72 °C for 45 s, repeated ten times, followed by a final extension time at 72 °C for 7 min.
Quantification of the PCR products was performed by following the Qubit protocol (Thermo Fischer Scientific, USA) and the samples were subsequently normalized to equal concentrations and pooled into a library using a Biomek® 3000 Laboratory Automation Workstation (Beckman Coulter, USA). The resulting library was purified using the Ampure XP protocol according to the manufacturer’s instructions (Beckman Coulter, USA). Sequencing was performed on a MiSeq platform (Illumina, San Diego, CA, USA) with 300 base pairs paired-end reads. The resulting sequences were analyzed with a QIIME pipeline (Caporaso et al. Citation2010). Usearch v8.0 (Edgar Citation2010) was used to cluster the sequences into Operational Taxonomic Units (OTUs) with a 97% identity level. The OTUs were taxonomically assigned using the Silva database (Pruesse et al. Citation2007). Functional groups associated with WWTPs were identified using the MiDAS database (Dueholm et al. Citation2021).
Reduced metagenome sequencing (RMS)
The objective of reduced Metagenome Sequencing (RMS) was to obtain species resolution taxonomic assignments. DNA (0.1-10 ng µl−1) samples extracted from biofilm fraction 1-4 were digested for 1 h at 37 °C using a combination of 8 U EcoRI and 4 U MseI, followed by adapter ligation for 3 h at 37 °C using 400 U T4 DNA ligase (New England Biolabs, USA). Adapters were made of equal amounts of forward strands (EcoRI, 5′-CTCGTAGACTGCGTACC-3′; MseI, 59-GACGATGAGTCCTGAG-3′9) and reverse strands (EcoRI, 5′-AATTGGTACGCAGTCTAC-3′; MseI, 5′-TACTCAGGACTCAT-3′). The samples were PCR amplified by 25 cycles of denaturation at 95 °C for 30 s, hybridization at 55 °C for 1 min, and elongation at 72 °C for 1 min with primers complementary to the adapters. A detailed protocol is provided by Nilsen (Nilsen et al. Citation2021). Sequencing was performed using the HiSeq 3000 sequencer (Illumina) at the Norwegian Sequencing Center (University of Oslo, Oslo, Norway). Identification of the RMS fragments were performed using the UCLUST algorithm (Edgar Citation2010), with a > 90% identity threshold. Fragments detected only once were discharged.
Shotgun sequencing
Metagenome shotgun sequencing was performed to identify the presence of particular genes of interest and their abundance, in the individual biofilm fractions. DNA samples extracted from fraction 1-3 were processed using the Nextera XT DNA Library Preparation Kit (Illumina Inc, San Diego, CA, USA) following the manufacturer’s instructions. The sequencing was performed using the Illumina NovaSeq platform (150 bp paired-end sequencing). The shotgun sequencing data were assembled and binned using a combination of abundance and taxonomy with the Microbial Metagenomics pipeline in CLC Genomic Workbench (Qiagen, Hilden, Germany). Gene identification and taxonomic analyses were performed using the EggNOG database (Huerta-Cepas et al. Citation2019), with the potential metabolic processes being derived from known gene functions.
Statistical and ecological analyses
Data analyses were performed using Matlab with the Fanthom package for diversity analyses (https://se.mathworks.com/matlabcentral/fileexchange/68518-fathom-toolbox-for-matlab), and PLS toolbox (https://eigenvector.com/software/pls-toolbox/) for multivariate statistical analyses. Traditional statistical analyses were performed using Minitab (Minitab Inc.).
Results
Spatial structuring of the phosphate accumulating biofilm microbiome
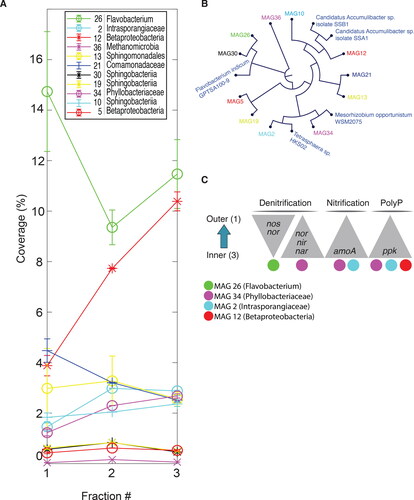
To investigate the functional stratification of phosphorus accumulation biofilms, a protocol was developed for the mechanical disruption and production of five biofilm sample fractions (). 16S rRNA qPCR analysis detected DNA in fractions 1 to 4 (Supplementary Fig. S1), the fifth fraction was qPCR-negative (data not shown), corroborating total biomass extraction in fractions 1 to 4, representing the outermost and innermost layers of the biofilm, respectively (). The number of bacterial OTUs observed, based on 16S rRNA sequencing, in fraction 1, ranged from 478 to 656 with an average of 553 and the corresponding numbers for fraction 2, 790 to 836, and 807, respectively. Fractions 3 and 4 displayed a similar OTU richness, ranging from 648 to 715, with an average of 679 (). Statistical testing using one-way analysis of variance (ANOVA), showed that fraction 2 harbored a significantly higher OTU richness compared with the other fractions, which showed similar OTU richness. Principle Coordinate Analysis (PCoA) and Bray-Curtis dissimilarity matrix was used to quantify compositional OTU dissimilarity between each of the fractions, revealing three compositional clusters, where fractions 1 and 2 clustering separately, and fractions 3 and 4 clustering together (). The samples from within each fraction clustered together, indicating their similarity and therefore the reproducibility of the fractionation method. Total genetic diversity and beta-diversity was also estimated using reduced metagenome sequencing data (Supplemental Fig. S2), supporting the major findings of the 16S rRNA gene sequence data. 16S rRNA gene analysis revealed the dominance, in the outermost fraction, of bacteria belonging to the order Burkholderiales, rapidly decreasing towards the deeper layers of the biofilm ( and Supplementary Fig. S3). The opposite trend was discovered for the order Rhodocyclales, showing a steady increase in relative abundance from the innermost (fraction 4) to the outermost (fraction 1) layers of the biofilm ( and Supplementary Fig. S3). These trends were correlated with the retrieved metagenome shotgun data, although the magnitudes were different (). In total, 11 metagenome-assembled genomes (MAGs) were recovered (Supplementary Table S1). Of these, MAG21, belonging to the family Comamonadaceae and the order Burkholderiales were found to decrease, while MAG12, phylogenetically clustering to Accumulibacter () within the order Rhodocylales, increased from the outermost to the deeper layers of the biofilm (). MAG26, related to Flavobacterium (), was identified as the most abundant genome overall and across all fractions, an observation that did not, however, correlate with 16S rRNA gene sequencing data. Taken together these results clearly show the spatial structuring of the phosphorus Hias biofilm microbiome, from the outer surface layer to the innermost deep layer.
Figure 2. Composition of the bacterial microbiota per biofilm fraction through 16S rRNA sequencing showing differences in the mean OTU richness (A), taxonomic distribution (B), and relative abundance of OTUs (C). (a) Overall, fraction 2 showed the highest OTU richness. Different letters indicate significant differences between fractions (ANOVA < 0.005). Error bars represent standard error of the mean (n = 4). (B).
Principal coordinate analysis (PCoA) score plots on the relative abundance of OTUs (97% similarity level) using Bray-Curtis dissimilarity matrix. The numbers in the colored boxes correspond to the fraction number and the different colored boxes represent the three compositional clusters identified. (C) Percentage OTU abundances indicate the mean average of each individual fraction. The percentage does not add up to a 100% as all fractions contained OTUs not identified at the order level by the Silva database.
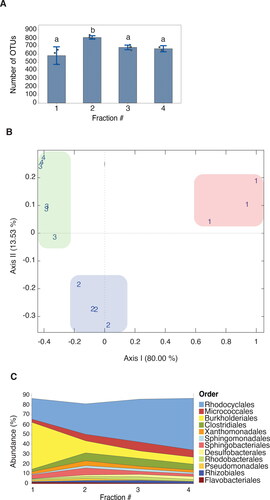
Figure 3. Metagenome shotgun analysis showing the distribution (A), phylogenetic relationship (B), and functional contribution of retrieved Metagenome Assembled Genomes (MAGs) (C) across biofilm fractions. (A) The distribution of the MAGs is presented as the mean coverage for each MAG by percentage of the sum of the mean coverage for all MAGs included. (B) Cladogram and genetic structure of recovered MAGs based on k-mer distribution of 20-mers. (C) The distribution of phosphorus and nitrogen metabolism genes of the recovered MAGs in relation to denitrification, nitrification and polyphosphate uptake and accumulation. Since the beta-diversity analyses indicated a high degree of similarity in microbial composition between fractions 3 and 4 ( and Supplementary Fig. S2B), fraction 4 was omitted from the shot gun sequencing project.
The Hias biofilm showed an unexpected stratified microbial structure
The MiDAS database was used to link the identity of abundant microorganisms in the individual Hias biofilm fractions to their functional importance (). Denitrifying bacteria were found to be most abundant in the outermost layer, rapidly decreasing towards the deeper layers of the biofilm. In contrast, the abundance of phosphorus accumulating organisms (PAOs) was highest in the innermost layer and steadily decreased towards the biofilm surface. In general, glycogen-accumulating organisms (GAOs) and fermenters were found to be less dominant, especially at the biofilm surface, their relative contribution to the microbiome increasing towards the deeper layers of the biofilm.
Figure 4. Spatial distribution of functional groups (A) and important genes (B) across biofilm fractions. (A) Functions derived from 16S rRNA gene sequence data based on the comparison with the MIDAS database. (B) The distribution of important genes in phosphorus and nitrogen metabolism derived from the shotgun sequencing data. Mean coverage represents mean coverage for each gene analyzed as a percentage of the sum of the mean coverage for all six genes. Since the beta-diversity analyses indicated a high degree of similarity in microbial composition between fraction 3 and 4 ( and Supplementary Fig. S2B), fraction 4 was omitted from the shot gun sequencing analysis presented in (B).
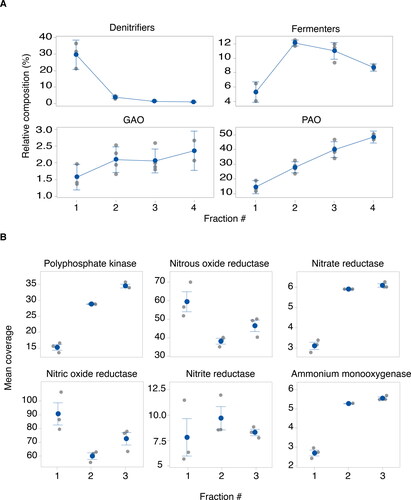
To further explore the functional stratification of the biofilm, shotgun sequencing data were analyzed for the presence of genes essential for both phosphorus and nitrogen metabolism, including the polyphosphate kinase (pkk) gene, involved in polyphosphate (polyP) metabolism, the denitrification genes nitrous oxide reductase (nos), nitrate reductase (nar), nitric oxide reductase (nor) and nitrite reductase (nir), and the ammonium monooxygenase (amoA) gene whose gene product catalyzes the first step of ammonium oxidation in the nitrification process (). A clear gradient of the pkk gene with an increase towards the innermost part of the biofilm was detected, consistent with the increase in PAOs towards the innermost layers as derived based on 16 s rRNA gene sequencing data (Supplementary Fig. S4a). Three MAGs were found to possess the ppk gene, MAGs 2,12 and 34, all showing higher abundance in fraction 3 compared with fraction 1. Importantly, MAGs 12 and 2, clustered phylogenetically to Accumulibacter and Tetrasphaera, respectively. Interestingly, the genes involved in the denitrification process were not found to be equally distributed in the similar fractions. The two nor and nos genes, encoding enzymes catalyzing the final steps of denitrification, the reduction of nitric (NO) oxide to nitrous oxide (N2O) and N2O to nitrogen gas (N2), respectively, were overrepresented in fraction 1. In contrasts the nar and nir genes, encoding proteins catalyzing nitrate and nitrite reduction, the first two steps in denitrification, were more abundant in fraction 3 compared with raction 1. Overall, the nar and nir genes were significantly less abundant compared with the nor and nos genes. Three MAGs were found to encode denitrification genes, namely MAG 2, 26 and 34 (). Of these, MAG 26 was capable of NO and N2O reduction, while MAG 34 possessed the genes for nitrate and nitrite reductions. The PAO-related MAG 34, also possessed the nar gene, suggesting that this organism utilizes nitrate as external electron acceptor for anoxic phosphorus removal. Finally, the amoA gene were found to be more abundant in the inner layer of the biofilm (fraction 3), consistent with the increase in MAG 34 and MAG2, both possessing the amoA gene, towards the deeper layers of the biofilm ().
Discussion
Knowledge of the spatial distribution of microorganisms is of critical importance for understanding biofilm function. In this study, a reproducible strategy for the physical separation of individual spatial fractions of phosphorus accumulating biofilm has been developed. Applying increased mechanical stress to biofilms attached to a biocarrier consistently isolated three distinct compositional microbial fractions ( and ), representing the entire biofilm, from the surface to the innermost layer. Both the shotgun sequencing approach and the 16 s rRNA gene analysis clearly suggest that PAOs was significantly more abundant towards the innermost part of the Hias biofilm. The current study identified three MAGs harboring ppk, the signature marker gene for PAOs, two of which, MAG12 and MAG2, were found to be phylogenetically related to Canditatus Accumulibacter and Tetrasphaera, respectively, both widespread and common PAOs in wastewater treatment systems (Peterson et al. Citation2008). The increase in PAOs towards the deeper layers of the Hias biofilm was a surprise, as previous models, based on phosphorus removal kinetics suggested PAOs to be located at the biofilm surface (Saltnes et al. Citation2017). Since oxygen is sparingly soluble and is rapidly respired by aerobic microorganisms, an oxygen concentration gradient with anoxic and/or microaerobic conditions within the deeper layer of the biofilm was expected. This raises the question regarding the terminal electron acceptor for phosphate accumulation and uptake in the Hias biofilm. Previous studies have shown the existence of several phylogenetically distinct clades within the Accumulibacter lineage that are capable of phosphate uptake and accumulation not only under aerobic conditions but also under anoxic conditions, i.e. with nitrate as the terminal electron acceptor (Flowers et al. Citation2009), and a recent study has shown efficient phosphate uptake using nitrate as terminal electron acceptor in wastewater (Mandel et al. Citation2019). However, no respiratory nitrate reductase (nar) homolog was detected, nor any other denitrification genes (e.g. nir, nor, and nos) in MAG12. Similarly, while some strains of Tetrasphaera have shown denitrifying properties (Marques et al. 2018), no denitrification genes were found in the Tetrasphaera-related MAG2. The lack of denitryfing genes in MAG2 and MAG12, suggests that sufficient oxygen penetrates to the deeper layer of the Hias biofilm during the oxic zones to allow aerobic phosphate uptake and accumulation by these organisms. In the current study, one MAG possessing both genes for phosphate accumulation and nitrate reduction was detected, namely MAG 34, related to the family Pyllobacteriaceae. This is a versatile family showing mutualistic associations with plants, such as nitrogen fixation and phosphate mobilization properties (Gopalakrishnan et al. Citation2015). The family Pyllobacteriaceae, however, has not yet been associated with PAOs (Nielsen et al. Citation2019), making it unlikely that MAG34 contributes substantially to phosphorus accumulation in the Hias biofilm.
Ammonium oxidation is considered the rate limiting step of nitrification and is catalyzed by ammonium oxidase, encoded by amoA. Interestingly, the amoA gene was found to be strongly associated with the deeper part of the biofilm, further suggesting that oxygen penetrates to the deeper layers of the biofilm in the oxic zones of the process. Ammonium can also be oxidized anaerobically by anaerobic ammonium oxidation (anammox), a process that has drawn considerable attention as a cost-effective method for nitrogen removal from wastewater (Kuenen Citation2008). However, no match was found between the 16S rRNA gene analysis and known anammox bacteria in the MiDAS database. It is therefore unlikely that nitrification is driven through anammox in the Hias process. In addition to amoA, the denitrifying gene nar was also strongly associated with the deeper part of the biofilm. This indicates that both nitrification and nitrate reduction occur in the deeper layers of the biofilm.
The 16S rRNA gene analysis identified denitrifiers to be more abundant towards the outer layers of the biofilm. This finding corresponds well with the distribution of the denitrifying genes nor and nos identified through shotgun sequencing. The potential denitrifying MAG26, related to Flavobacterium (Drake and Horn Citation2007), contained both nor and nos, and showed dominance in the outer part of the biofilm. A possible explanation for the spatial distribution of nitrogen metabolism could be that nitrification occurs in the inner layer of the biofilm once the biofilm reaches the oxic zones in the WWTP after the initial anoxic zones (), resulting in the accumulation of nitrate which is then carried over to the anoxic zones, supporting nitrate reduction in the inner layer. The reduced nitrogen compounds nitric and nitrous oxide could then diffuse from the inner layers, functioning as electron acceptors for Flavobacterium in denitrification at the outer layers of the biofilm. Alternatively, denitrification could also occur in the oxic zones of the WWTP through simultaneous nitrification and denitrification (SND). Contrary to the functional stratification identified in the current study, the established model for SND biofilms in MBBR WWTPs places nitrifiers in the outer layer, and denitrifers in the inner layer of the biofilm due to access to dissolved oxygen (Bhattacharya and Mazumder Citation2021). However, nitrifiers have previously been observed in the inner layers of the biofilm in an SND MBBR, though at the cost of nitrogen removal efficiency (Fu et al. Citation2010). Recent studies have identified species of Flavobacterium to preform aerobic denitrification (Pishgar et al. Citation2019; Deng et al. Citation2020), revealing a possible pathway for SND to occur in the presence of dissolved oxygen. For nitric and nitrous oxide to be available for aerobic denitrification, reduction of nitrate and nitrite could potentially occur in anoxic microenvironments (Yang et al. Citation2010) in the inner part of the biofilm while oxygen diffuses into the inner parts in sufficient amounts for nitrification to occur. More studies are needed to understand the nature of the nitrogen removal process observed in the Hias WWTP.
Conclusion
The spatial fractionation of phosphorus accumulating biofilm revealed an unexpected stratification of genes and bacteria involved in polyphosphate accumulation and dissimilatory nitrogen metabolism. Polyphosphate accumulation and nitrification was found to be associated with the inner biofilm layer, suggesting a colocalization of these processes in the deep layer of the biofilm. Genes for nitrate reduction were more abundantly associated with the inner biofilm layer, while genes for nitric- and nitrous oxide reductions were more abundant in the outer biofilm layer. The spatial distribution of these genes suggest that different electron acceptors were utilized in the different layers of the biofilm by the denitrification bacteria. The current study shows the importance and potential of biofilm fractionation in combination with metagenomic analyses for enhancing knowledge on biofilm structure and functionality.
Supplemental Material
Download PDF (573.4 KB)Acknowledgments
The authors thank the operators at the HIAS waste treatment plant for collecting the biofilm media.
Disclosure statement
No potential conflict of interest was reported by the authors.
Additional information
Funding
References
- Allwood AC, Grotzinger JP, Knoll AH, Burch IW, Anderson MS, Coleman ML, Kanik I. 2009. Controls on development and diversity of Early Archean stromatolites. Proc Natl Acad Sci U S A. 106:9548–9555. doi:https://doi.org/10.1073/pnas.0903323106
- Bhattacharya R, Mazumder D. 2021. Simultaneous nitrification and denitrification in moving bed bioreactor and other biological systems. Bioprocess Biosyst Eng. 44:635–652. doi:https://doi.org/10.1007/s00449-020-02475-6
- Caporaso JG, Kuczynski J, Stombaugh J, Bittinger K, Bushman FD, Costello EK, Fierer N, Peña AG, Goodrich JK, Gordon JI, et al. 2010. QIIME allows analysis of high-throughput community sequencing data. Nat Methods. 7:335–336. doi:https://doi.org/10.1038/nmeth.f.303
- Comeau Y, Hall K, Hancock R, Oldham W. 1986. Biochemical model for enhanced biological phosphorus removal. Water Res. 20:1511–1521. doi:https://doi.org/10.1016/0043-1354(86)90115-6
- Deng M, Li L, Dai Z, Senbati Y, Song K, He X. 2020. Aerobic denitrification affects gaseous nitrogen loss in biofloc-based recirculating aquaculture system. Aquaculture. 529:735686. doi:https://doi.org/10.1016/j.aquaculture.2020.735686
- Drake HL, Horn MA. 2007. As the worm turns: the earthworm gut as a transient habitat for soil microbial biomes. Annu Rev Microbiol. 61:169–189. doi:https://doi.org/10.1146/annurev.micro.61.080706.093139
- Dueholm MS, Nierychlo M, Andersen KS, Rudkjøbing V, Knutsson S, Albertsen M, Nielsen PH, Consortium MG. 2021. MiDAS 4: a global catalogue of full-length 16S rRNA gene sequences and taxonomy for studies of bacterial communities in wastewater treatment plants. bioRxiv. doi:https://doi.org/10.1101/2021.07.06.451231
- Edgar RC. 2010. Search and clustering orders of magnitude faster than BLAST. Bioinformatics. 26:2460–2461. doi:https://doi.org/10.1093/bioinformatics/btq461
- Flemming H-C, Wingender J, Szewzyk U, Steinberg P, Rice SA, Kjelleberg S. 2016. Biofilms: an emergent form of bacterial life. Nat Rev Microbiol. 14:563–575. [ doi:https://doi.org/10.1038/nrmicro.2016.94
- Flowers JJ, He S, Yilmaz S, Noguera DR, McMahon KD. 2009. Denitrification capabilities of two biological phosphorus removal sludges dominated by different "Candidatus Accumulibacter" clades. Environ Microbiol Rep. 1:583–588. doi:https://doi.org/10.1111/j.1758-2229.2009.00090.x
- Fu B, Liao X, Ding L, Ren H. 2010. Characterization of microbial community in an aerobic moving bed biofilm reactor applied for simultaneous nitrification and denitrification. World J Microbiol Biotechnol. 26:1981–1990. doi:https://doi.org/10.1007/s11274-010-0382-y
- Gopalakrishnan S, Sathya A, Vijayabharathi R, Varshney RK, Gowda CLL, Krishnamurthy L. 2015. Plant growth promoting rhizobia: challenges and opportunities. 3 Biotech. 5:355–377. doi:https://doi.org/10.1007/s13205-014-0241-x
- Huerta-Cepas J, Szklarczyk D, Heller D, Hernández-Plaza A, Forslund SK, Cook H, Mende DR, Letunic I, Rattei T, Jensen LJ, et al. 2019. eggNOG 5.0: a hierarchical, functionally and phylogenetically annotated orthology resource based on 5090 organisms and 2502 viruses. Nucleic Acids Res. 47:D309–D314. doi:https://doi.org/10.1093/nar/gky1085
- Kuenen JG. 2008. Anammox bacteria: from discovery to application. Nat Rev Microbiol. 6:320–326. doi:https://doi.org/10.1038/nrmicro1857
- Lappin-Scott H, Burton S, Stoodley P. 2014. Revealing a world of biofilms-the pioneering research of Bill Costerton. Nat Rev Microbiol. 12:781–787. ]. doi:https://doi.org/10.1038/nrmicro3343
- Mandel A, Zekker I, Jaagura M, Tenno T. 2019. Enhancement of anoxic phosphorus uptake of denitrifying phosphorus removal process by biomass adaption. Int J Environ Sci Technol. 16:5965–5978. doi:https://doi.org/10.1007/s13762-018-02194-2
- Marques R, Ribera-Guardia A, Santos J, Carvalho G, Reis MA, Pijuan M, Oehmen A. 2018. Denitrifying capabilities of Tetrasphaera and their contribution towards nitrous oxide production in enhanced biological phosphorus removal processes. Water Res. 137:262–272. doi:https://doi.org/10.1016/j.watres.2018.03.010
- Marques R, Santos J, Nguyen H, Carvalho G, Noronha JP, Nielsen PH, Reis MAM, Oehmen A. 2017. Metabolism and ecological niche of Tetrasphaera and Ca. Accumulibacter in enhanced biological phosphorus removal. Water Res. 122:159–171. doi:https://doi.org/10.1016/j.watres.2017.04.072
- Nielsen PH, McIlroy SJ, Albertsen M, Nierychlo M. 2019. Re-evaluating the microbiology of the enhanced biological phosphorus removal process. Curr Opin Biotechnol. 57:111–118. doi:https://doi.org/10.1016/j.copbio.2019.03.008
- Nilsen M, Lokmic A, Angell IL, Lodrup Carlsen KC, Carlsen KH, Haugen G, Hedlin G, Jonassen CM, Marsland BJ, Nordlund B, et al. 2021. Fecal microbiota nutrient utilization potential suggests mucins as drivers for initial gut colonization of mother-child-shared bacteria. Appl Environ Microbiol. 87(6):e02201–e022020. doi:https://doi.org/10.1128/AEM.02201-20
- Peterson SB, Warnecke F, Madejska J, McMahon KD, Hugenholtz P. 2008. Environmental distribution and population biology of Candidatus Accumulibacter, a primary agent of biological phosphorus removal. Environ Microbiol. 10:2692–2703. English. doi:https://doi.org/10.1111/j.1462-2920.2008.01690.x
- Pishgar R, Dominic JA, Sheng Z, Tay JH. 2019. Denitrification performance and microbial versatility in response to different selection pressures. Bioresour Technol. 281:72–83. doi:https://doi.org/10.1016/j.biortech.2019.02.061
- Pruesse E, Quast C, Knittel K, Fuchs BM, Ludwig W, Peplies J, Glöckner FO. 2007. SILVA: a comprehensive online resource for quality checked and aligned ribosomal RNA sequence data compatible with ARB. Nucleic Acids Res. 35:7188–7196. doi:https://doi.org/10.1093/nar/gkm864
- Rudi K, Goa IA, Saltnes T, Sorensen G, Angell IL, Eikas S. 2019. Microbial ecological processes in MBBR biofilms for biological phosphorus removal from wastewater. Water Sci Technol. 79:1467–1473. doi:https://doi.org/10.2166/wst.2019.149
- Saltnes T, Sorensen G, Eikas S. 2017. Biological nutrient removal in a continuous biofilm process. Water Pract Tech. 12:797–805. English. doi:https://doi.org/10.2166/wpt.2017.083
- Westall F, de Wit MJ, Dann J, van der Gaast S, de Ronde CEJ, Gerneke D. 2001. Early Archean fossil bacteria and biofilms in hydrothermally-influenced sediments from the Barberton greenstone belt, South Africa. Precambrian Res. 106:93–116. doi:https://doi.org/10.1016/S0301-9268(00)00127-3
- Yang S, Yang F, Fu Z, Wang T, Lei R. 2010. Simultaneous nitrogen and phosphorus removal by a novel sequencing batch moving bed membrane bioreactor for wastewater treatment. J Hazard Mater. 175:551–557. doi:https://doi.org/10.1016/j.jhazmat.2009.10.040
- Yu Y, Lee C, Kim J, Hwang S. 2005. Group-specific primer and probe sets to detect methanogenic communities using quantitative real-time polymerase chain reaction . Biotechnol Bioeng. 89:670–679. doi:https://doi.org/10.1002/bit.20347