
 ?Mathematical formulae have been encoded as MathML and are displayed in this HTML version using MathJax in order to improve their display. Uncheck the box to turn MathJax off. This feature requires Javascript. Click on a formula to zoom.
Abstract
In the maritime field where biofouling has both economic and environmental impacts, in situ quantification methods of biofilm development are of outstanding importance. Indeed, it is challenging to temporally monitor biofilm formation due to the complexity of the marine ecosystem, common inaccessibility of sampling location and lack of standardized techniques. Here, an artificial polymeric surface was tested in situ and in vitro against natural phototrophic biofilms and monoculture biofilms using plate reader fluorescence. The suitability of the developed method was verified using fluorescence microscopy coupled with image analysis - a common quantification technique - demonstrating a strong correlation between the tested methods. The results indicated the efficiency of inherent chlorophyll fluorescence in quantifying undisturbed phototrophic biofilms in field and laboratory conditions using microplate reader. This work demonstrated that the suggested approach is promising for biofilm high-throughput testing, and therefore has the potential to be used in several research and industrial sectors for monitoring phototrophic biofilm development.
Introduction
Aquatic phototrophic biofilms are mixed microbial conglomerations formed and attached to submerged solid surfaces, typically composed by light-driven autotrophs and heterotrophs that are surrounded and stabilized by self- producing extracellular polymeric substances (EPS) (Hoagland et al. Citation1993; Cooksey and Wigglesworth-Cooksey Citation1995; Landoulsi et al. Citation2011). In a nutshell, at the top biofilm phototrophic layer, oxygenic photoautotrophs are prevailing, whilst the internal part of the biofilms consists of heterotrophs (bacteria, protozoa, fungi) and anoxygenic phototrophs (Roeselers et al. Citation2007; Bharti et al. Citation2017). Oxygenic photoautotrophs (primary producers) primarily consist of diatoms, green algae, and cyanobacteria that possess photosynthesizing components enabling them to use light energy and reduce carbon dioxide, thus producing oxygen and organic substrates (Roeselers et al. Citation2007, Citation2008).
In industries where the investigation of biofilm development is of great interest, high-throughput quantification tools are fundamental for assessing the performance of novel fouling control material. Phototrophic biofilm quantification is important in a wide range of research and industrial applications, such as wastewater treatment (Schumacher et al. Citation2003), aquaculture (Bender and Phillips Citation2004), conservation of cultural heritage (Sasso et al. Citation2016), antifouling industry (Salta et al. Citation2013), etc. Marine phototrophs constitute the first surface colonisers along with bacteria, leading to the marine biofouling problem (Characklis Citation1981; Callow and Callow Citation2002; Anil et al. Citation2006). The uncontrolled biofilm growth on surfaces can interfere with their performance (Luo et al. Citation2018), for example biofouling greatly impacts the efficiency level of antifouling coatings (Molino and Wetherbee Citation2008; Papadatou et al. Citation2021). Moreover, phototrophic biofilms commonly possess specific features, such as active metabolites (Bhadury and Wright Citation2004) that could significantly affect marine biofouling, and consequently constitute attractive candidates for further exploration in many biotechnological applications. Hence, in order to assess the biofilm development on biofouling-impacted artificial surfaces, such as fouling control coatings, it is essential to monitor in situ biofilm formation over time.
Biofilm quantification can be employed with a variety of techniques depending on the research objectives, budget, and instrument availability. Among the biofilm monitoring techniques, the non-invasive approaches are of great importance for the reflection of the spatial and heterogenous undisturbed environmental biofilm structure consisting of phototrophic and heterotrophic microorganisms (Barranguet et al. Citation2004). Additionally, in situ methods are of principal importance as they generate real-time information and set the basis for effective control (Wolf et al. Citation2002), however, field studies are greatly lacking (Briand Citation2009). Phototrophic biofilms have the advantage of possessing chlorophyll α (chl-α), a green pigment essential for photosynthesis (Woodward et al. Citation1960; Jeffrey and Humphrey Citation1975) that has been widely used as a biomass biomarker (Cattò and Cappitelli 2019) for label-free and non-destructive detection (Serodio et al. 1997; Cerovic et al. Citation2002). The estimation of intrinsic chlorophyll fluorescence (ChlF) provides a direct implication of the photosynthetic activity in chlorophyll-containing cells and has been used as a proxy for cell number estimation (Best et al. Citation2016). Intrinsic natural auto-fluorescence could be examined by both spectrophotometric and microscopic measurements (Cattò and Cappitelli 2019).
The conventionally used fluorescence-based microscopy methods in biofilm studies including confocal laser scanning microscopy (CLSM) and epifluorescence, provide quantitative and qualitative information (Mosleh et al. Citation2012), while allowing the non-disruptive visualisation of young aquatic phototrophic biofilms (Lawrence et al. Citation1998; Eggert et al. Citation2006). CLSM is an optical high-resolution microscope coupled with a laser beam that provides time-resolved three-dimensional images of the biofilm structure (Lawrence and Neu Citation1999; Mueller et al. Citation2006) and the capacity to simultaneously explore different biofilms components, using fluorescent dyes to target bacterial DNA or EPS, and the intrinsic autofluorescent pigments for phototrophs (Barranguet et al. Citation2004). However, CLSM is specified but not commonly available equipment (Salta et al. Citation2018), that requires considerable sample preparation (Fabbri et al. Citation2018) and often expensive generation of results. Epifluorescence microscopy is a method for in situ microbial quantification with the application of fluorescent tags (Nadeau et al. Citation2008) or exploitation of autofluorescent pigments, that has been extensively used to study different biofilm structures (Amann et al. Citation1992; Surman et al. Citation1996; Clarke et al. Citation2010). Another traditional method to manually determine planktonic microalgal concentration is cell counting using light microscopy, although this technique could be laborious, susceptible to misuse of the counting chamber, dependent on the experience of the operator, and impractical for dense aggregates (Takahashi Citation2019). Plate readers constitute standard high-throughput infrastructure equipment in research laboratories, applied to facilitate spectrophotometric and fluorescence measurements inexpensive (Warren Citation2008; Salta et al. Citation2018), often with faster and more reliable results compared to direct microscopic counting (Camps et al. Citation2011).
A simple, nonintrusive, fast technique was developed by Carreira and colleagues (Carreira et al. Citation2015) to explore the distribution of several benthic phototrophic groups based on different autofluorescence excitation spectra. The designed custom-made method was successfully applied for laboratory cultures (diatom; Nitzschia capitellata, cyanobacterium; Geitlerinema sp.) and natural microbial mats using an imaging system (excitation for diatoms; blue 470 nm, cyanobacteria; amber 600 nm) that enabled discrimination between the two phototrophic groups. Best et al. (Citation2016) reported a novel ChlF-based method for screening microalgae and cyanobacteria using a fabricated microdroplet (microfluidic) platform. Two cyanobacteria (genus Synechocystis, Synechococcus) and a green alga (genus Chlamydomonas) were monitored through ChlF measurements encapsulated in droplets. The recommended label-free detection approach was directly associated to the physiological properties of each single-cell and displayed applicability of ChlF in picolitre microdroplets for different cyanobacteria and microalgae strains. Warren (Citation2008) established a robust, rapid approach to assess chlorophyll using microplate reader. Chlorophyll obtained from eight different plant families (Acacia, Allium, Araucaria, Avicennia, Eucalyptus, Gossypium, Marsilea, Schleffera) was extracted with methanol, following measurement of chlorophyll with microplate and spectrophotometer. The results indicated a strong linear relationship between the two methods for chlorophyll concentration estimation.
The utilisation of plate readers has been successfully adapted for laboratory assessment of bacterial (e.g. Stafslien et al. Citation2006, Citation2007) and microalgal (e.g. Cassé et al. Citation2007a, Citation2007b) biofilm attachment. Stafslien et al. (Citation2006) developed a fabricated temperature-controlled, circulated water bath incubator tank. The novel high-throughput method based on crystal violet staining and plate reader absorbance measurements, enabled the assessment of marine bacterial biofilm growth. Effectiveness and versatility of the bioassay was then tested for assessment of bacterial biofilm retention (Pseudoalteromonas atlantica, Cobetia marina, Halomonas pacifica, Cytophaga lytica) on antifouling surfaces, and demonstrated to be successful in the primary screening of antifouling coatings for identification of promising candidates (Stafslien et al. Citation2007). Cassé et al. (Citation2007a) constructed a water-controlled spinjet apparatus with variable pressure (application of hydrodynamic forces) to facilitate biomass quantification of Navicula perminuta diatom and Ulva linza macroalga sporelings using fluorescence plate reader, and cell adhesion strength using epifluorescence microscope. The laboratory bioassay facilitated the screening of the adhesion strength of algae that allowed evaluation of novel fouling-release coatings. Cassé et al. (Citation2007b) established an algorithm to quantify the algal (Ulva linza zoospores) biomass coverage from coatings using digital image analysis for visual assessment, which proved to be reproducible semi-high-throughput for characterising coatings performance.
Salta et al. (Citation2018) developed a combinative bioassay to assess in situ the performance of natural product- and biocide-containing coatings against bacterial biofilm formation (Cobetia marina) using microplate reader and CLSM with nucleic acid staining coupled with COMSTAT analysis. The developed method reported comparable and repeatable results between the two methods and demonstrated the natural product (NP)-based coatings to exhibit good antifouling efficacy and inhibition of initial biofilm attachment and growth. Fabbri et al. (Citation2018) designed a novel flow cell to assess marine biofilms on biocidal antifouling coatings under shear flow using optical coherence tomography (OCT). The combination of biofilm flow cell and OCT successfully allowed screening for coating-specific differences in the tested biofilms. Le Norcy et al. (Citation2019) developed a method to characterise microalgal biofilms using CLSM combined with flow cells, and multi-well plate assays by microplate reader. The results displayed the ability of model microalgae (Cylindrotheca closterium, Porphyridium purpureum) to form biofilms in the tested flow-cells and showed that the reference microplate reader method confirmed the flow-cell (CLSM) findings.
Taken together, a powerful biofilm quantification method should be reproducible, rapid, accurate, cost-effective, non-destructive, and simple (Donlan Citation2001; Olwal et al. Citation2017). However, there is a lack of consensus for a standard phototrophic biofilm quantification technique, which might impede the comparison and lead to discrepancies between different biofilm studies (Olwal et al. Citation2017; Corte et al. Citation2019). In light of these considerations, the principal aim of the present study is to deliver a rapid method for in situ quantification of non-destructive marine biofilm-forming phototrophs. Phototrophic biofilms were in vitro and in situ monitored through ChlF estimation using fluorescence microscopy and microplate reader. The purpose of the developed low-cost and high-throughput bioassay is to support applications with primary interest in the initial phototrophic biofilm colonization of artificial surfaces, ranging from laboratory assays using model diatom strains to field tests of mixed photosynthetic communities.
Materials and methods
In vitro laboratory assays
Phototrophic biofilm-forming microalgae strains
The marine microalgal strains Cylindrotheca closterium (AC-170) and Nitzschia thermaloides (AC-712) were obtained from Algobank Caen, Microalgal Culture Collection of Caen Normandie University. Cylindrotheca is a well-known microfouling candidate (Briand Citation2009; Briand et al. Citation2012; Le Norcy et al. Citation2017), regardless the hydrodynamic treatment, i.e. static/dynamic immersion (Zargiel and Swain Citation2014) with the capacity of strong adhesion and thick biofilm formation on artificial surfaces (Le Norcy et al. Citation2019). Nitzschia was identified as one of the major fouling diatoms during several studies (Beveridge et al. Citation1998; Briand Citation2009; Zargiel et al. Citation2011; Muthukrishnan et al. Citation2017), with some cases only being observed under static conditions (Zargiel and Swain Citation2014). Both diatom strains belong to the family Bacillariophyceae, commonly involved in colonisation of marine surfaces. The selected model strains constitute rapid-growing organisms that allow experimental design of replicated treatments within reasonable timescales.
Culturing conditions and planktonic growth rates
Microalgal strains were cultivated in sterile filtered artificial seawater (35 g/L Sea Salts, Instant Ocean, Aquarium Systems, St. Blacksburg, VA, USA), supplemented with 2% Guillard’s F/2 Marine Water Enrichment Solution (Sigma-Aldrich, UK) at 17 °C and 28 ppt salinity. Fresh culture medium was stored at 17 °C prior to subculturing. Cultures were maintained aerobically in 500 mL Erlenmeyer flasks (VWR) under illumination from white light-emitting diode (LED) lamps with an irradiance of 32.2 μmol photons m−2 s−1 (2300 LUX) on a 14:10 h light:dark cycle (photoperiod). Stock cultures were subcultured every 20-30 days. The subculture formula was 1:7 from previous culture in sterile filtered medium (e.g. 50 mL culture in 350 mL medium).
Microalgal cells were monitored every 2-3 days over a 32-day period, using three replicates of 1 mL sample in Eppendorf tubes for cell counting. Manual cell counting was performed using a Neubauer counting chamber (Fisher Scientific) to evaluate cell density of suspended cells. Concentration estimations were determined using the formula:
Flask cultures set-up for in vitro attachment assays
Thermanox coupons (VWR UK, diameter 15 mm), i.e. round plastic coverslips, were used as artificial surfaces to monitor in vivo the fluorescence of chlorophyll-containing C. closterium and N. thermaloides biofilms under static conditions in the laboratory. Thermanox polyester material was selected as it exhibits optimal cell attachment and growth. Each monoculture treatment was tested in 6 replicate flasks, where a total of 50 mL of the precultured strain at the early logarithmic phase was used as an inoculum (5 h after onset of the light cycle). Inoculum was added into a 500 mL Erlenmeyer flask enclosing 350 mL Guillard’s F/2 medium and a sterile fishing line with 8 Thermanox coupons attached (). Control flasks were prepared with the addition of 400 mL sterile filtered medium (subculture medium) and Thermanox coupons attached to a fishing line (16 control coupons in total).
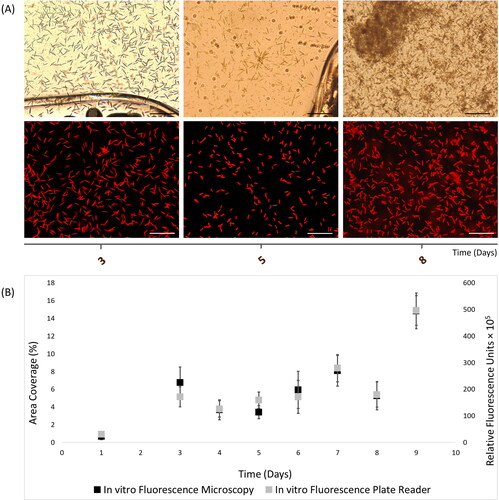
Figure 1. In vitro autofluorescence measurements of 9-day Cylindrotheca closterium biofilms, as recorded with (A) light (top) and fluorescence microscopy (bottom) images (scale bars = 20 μm), and (B) merged fluorescence microscopy and plate reader fluorescence records, where bars represent standard error.
Diatom sample collection
Monitoring of monoculture phototrophic biofilms was performed over a 9-day period under controlled laboratory conditions. Prior to sampling, flasks were shaken gently manually for 1 min. Under sterile conditions two coupons from different control flasks and six coupons from each culture flask were randomly collected using sterile forceps. Treatment coupons were rinsed with sterile filtered artificial seawater (35 g SS, 1 L dH2O). In total, 6 treatment coupons and 2 controls were collected at each sampling point (time = 1, 3, 4, 5, 6, 7, 8, 9 days) for downstream fluorescence measurements.
In situ field assays
Rosette preparation for in situ attachment assays
Thermanox coupons were used as artificial surfaces to monitor in situ the fluorescence of marine chlorophyll-containing biofilms. Coupons were attached to an experimental rig termed rosette, designed with 8 round holes at the top and bottom part supported by a metallic material in the middle (). A sterile fishing line with two Thermanox coupons attached and supported by swivel, was tied on two parallel holes. The maximum number of coupons on a single rosette was limited to 16 to avoid entanglement and overlapping. Rope was passed through two diametrically opposed holes at the top side of the rosette to be fasten for deployment. The rosette was externally covered with plastic net of 1.5 × 2.2 cm2 aperture (hole) size, to hold in place the samples and eliminate access to marine organisms, such as fish, that often tend to feed/graze on biofilms.
Natural biofilm sample collection
Rosettes were immersed vertically to the seawater surface at 0.5-1 m depth. Phototrophic biofilms were monitored in the marine environment at Southsea Marina UK (50°47'27.5"N 1°02'04.7"W) during three sampling campaigns in 2017. The first field experiment was conducted for 19 days in Spring (May 5-24), the second experiment for 28 days in Summer (June 15-July 13) and the third for 30 days in Autumn (September 12-October 12). The experiments were designed for the collection of samples with 2-3 days frequency, which was the case for Spring (8 sampling points) and Autumn (11 sampling points) experiments. For the purpose of other experiments, access to the sampling location at preselected dates was feasible during Summer, therefore additional samples were deployed and collected in Summer (3 sampling points) with 7 days frequency (1 point missing due to technical issues). Every coupon was collected using sterile forceps and scissors and placed into a sterile glass tube containing 5 mL of artificial seawater. Six coupons were collected at each sampling point for downstream fluorescence measurements.
Fluorescence measurements
Following collection of monoculture or mixed biofilms, coupons were placed into a sterile 24-well plate that contained 1 mL sterile artificial seawater and a black cover internally walled around each well to avoid light scattering during measurements. Phototrophic biofilm quantification was based on the intrinsic autofluorescent capacity of the chlorophyll-containing cells, with no staining. Chlorophyll fluorescence (ChlF) was recorded with two different methods including microplate reader fluorescence and epifluorescence microscopy coupled with image analysis.
Microplate reader fluorescence
Fluorescence excitation spectra was measured on a Hidex Sense microplate reader (425-301, Tukru, Finland) using the following assay settings: Fluorescence (Assays by technology), Well scan 7 × 7 mode, λexcitation = 436 nm, λemission = 680 nm. At the end of each measurement, a Microsoft Excel file with fluorescence estimates in Relative Fluorescence Unit (RFU) value was exported from the reader.
Epifluorescence microscopy and image processing
In order to maintain the samples hydrated during measurements, sterile artificial sea water was placed between slide and the coverslip if deemed necessary. In vitro laboratory assays of monoculture biofilms were examined using a fluorescence microscope (Carl Zeiss Axio Scope.A1, Jena, Germany) with equipped filters for λexcitation = 469 nm and λemission = 592. In situ field assays of mixed biofilms were investigated using a fluorescence microscope (Leica DFC310FX, Wetzlar, Germany) with equipped filters for λexcitation = 515 nm and λemission = 590 nm.
At least five randomly selected biofilm areas were captured from each coupon. Fluorescence images were collected and then processed using the image analysis software ImageJ V. 1.51j8 (MacBiophotonics, ImageJ, Canada) for percentage area coverage estimation. Surface area was estimated by converting a sample image (all replicates of the same sample) to stack, manual adjustment of thresholds for biofilms cells against the background (contrast compared with the light microscopy image), transform to binary, and measurement of area fraction (%). The results were exported and analysed in Microsoft Excel, where ChlF was presented in percentage surface area (% Area).
Statistical analysis
Measurements of ChlF from the in vitro and in situ experiments were processed in Microsoft Excel and scatter plots were generated merging fluorescence microscopy and plate reader fluorescence results. For each experiment, a Pearson correlation t-test (Paired Two Sample for Means) was conducted in Excel, where α = 0.05 and two-tail P value, to determine significant differences between the two tested ChlF methods.
To test the correlation coefficient for the relationship between ChlF recorded with plate reader and microscopy, Pearson’s product-moment correlation method was applied for all experiments using R (version 4.0.2) (R Core Team Citation2020). Regression analysis was performed to determine significant differences among the different treatments and scatterplot was generated using ggplot2 R library (Wickham Citation2016). Confidence interval was set at 95% on the fitted values (around the regression line).
Results
Five experiments for phototrophic biofilm quantification were implemented using two fluorescence techniques: microscopy and plate reader. The developed approach was designed to test the outcomes and evaluate the performance between the two tested techniques under various conditions and did not focus on biofilm kinetics.
Monitoring phototrophic growth in the laboratory
Growth rate of model microalgal planktonic strain
Growth rate of the pennate diatom C. closterium was estimated with manual cell counting over a 32-day period. The planktonic strain exhibited a decrease in cell concentration during the initial lag phase (0-5 days) (Figure S2). Following the logarithmic phase where cells increased exponentially, concentration of C. closterium cells exhibited a decline after 32 days of incubation (Figure S2). This indicated a potential nutrient depletion or increase of metabolic by-products. Therefore, the subculturing strategy was determined to take place every 20 days up to maximum 30 days.
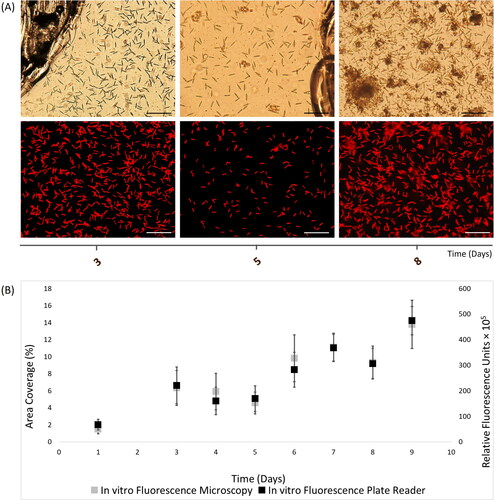
Figure 2. In vitro autofluorescence measurements of 9-day Nitzschia thermaloides biofilms, as recorded with (A) light (top) and fluorescence (bottom) microscopy images (scale bars = 20 μm), and (B) merged fluorescence microscopy and plate reader fluorescence records, where error bars represent standard error.
Testing monoculture Cylindrotheca closterium biofilms
In vitro quantification of the chlorophyll-containing C. closterium biofilms was implemented using fluorescence microscopy () and plate reader fluorescence ( and 1B). Fluorescence measurements were performed during the initial lag until the start of the log phase, where growth fluctuations have been previously confirmed for planktonic cells of C. closterium (Figure S2). Here, it was observed biofilm cell increase until day-3 of incubation, which was then stationary until day-5, followed by cell growth until day-7, decrease in day-8 and then exponential increase at day-9.
The two-tail p-value (p-value = 0.004) was smaller than the significance level (α = 0.05), therefore there is statistical proof of close relationship for the ChlF values obtained with microscopy and plate reader (Pearson coefficient (r) = 0.99, t Stat = −4.16, t Critical = 2.37, df = 7). As illustrated in , C. closterium biofilms exhibited comparable ChlF measurements between the two fluorescence methods during the 9-days monitoring.
Testing monoculture Nitzschia thermaloides biofilms
In vitro autofluorescence assessment of the biofilm-forming pennate diatom N. thermaloides, exhibited cell growth up to day-3, with subsequent decrease until day-5, followed by cell increase up to day-7, then slight decrease at day-8 and again cell increase at day-9.
The two-tail p-value (p-value = 0.0008) was significantly less than alpha value, and t statistic (t Stat = −5.60) did fall in the left rejection area (t Critical two tail= [-2.36, +2.36]), hence there was strong correlation between microscopy and plate reader measurements (r = 0.98, df = 7). As shown in the two fluorescence techniques indicated similar records for all data points. Overall, the ChlF results displayed the utility of microplate reader for in vivo quantification of monoculture phototrophic biofilms.
Monitoring phototrophic growth in the marine environment
Testing marine phototrophic biofilms in spring
In situ assessment of chlorophyll-containing natural biofilms was performed for 19 days in Spring 2017. The recorded natural biofilms exhibited a gradual increase until day-12, followed by stationary phase until day-14 and then exponential increase until day-19. Both techniques showed similar ChlF measurements for almost all time points (), except at day-17 where values varied slightly ().
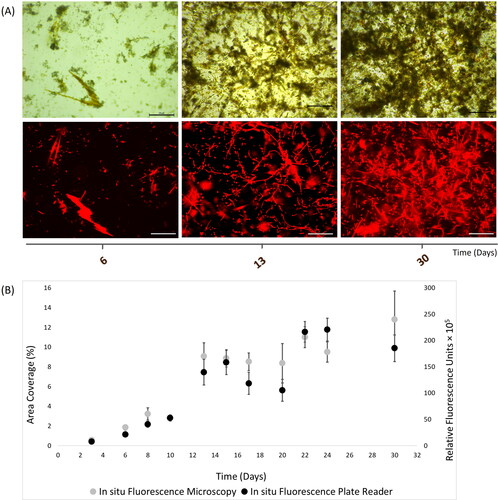
Figure 3. In situ autofluorescence measurements of 19-day natural phototrophic biofilms in Southsea Marina UK during Spring 2017, as recorded with (A) light (top) and fluorescence microscopy (bottom) images (scale bars = 20 μm), and (B) merged fluorescence microscopy and plate reader fluorescence records, where error bars represent standard error.
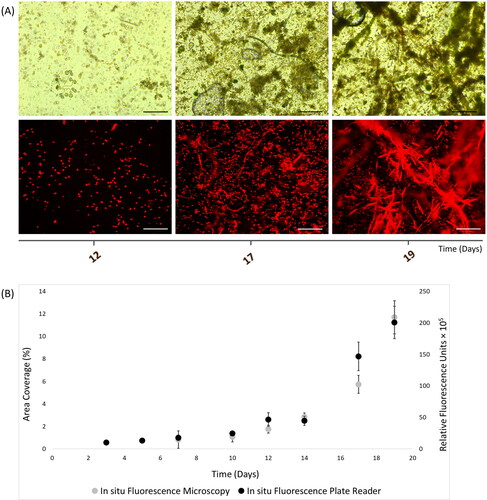
A strong correlation (r = 0.97) was evident for ChlF measurements between microscopy and plate reader methods during the Spring field experiment (p-value = 0.047, t Stat = −2.61, t Critical = 2.57, df = 5). Overall, it was shown that both fluorescence microscopy and plate reader provided similar ChlF values for in situ monitoring of marine phototrophic biofilms.
Testing marine phototrophic biofilms in summer
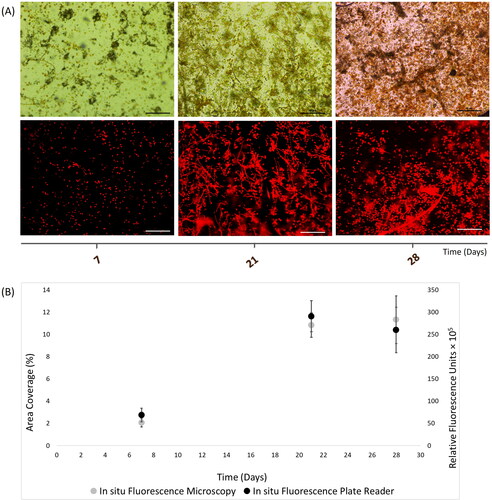
In situ intrinsic autofluorescence of marine biofilms was recorded for 28 days in Summer 2017. Biofilm cells were increased from day-7 to day-21, and then potentially displayed stationary phase until day-28.
Statistical test revealed close correlation (r = 0.98) but not significant (p-value = 0.09) between the ChlF values obtained with microscopy and plate reader during the Summer field experiment (t Stat = −2.98, t Critical = 4.30, df = 2). As shown below (), measurements of ChlF with microscopy ( and 4B) and plate reader presented comparable results for the in situ assessment of phototrophic biofilms.
Figure 4. In situ autofluorescence measurements of 28-day natural phototrophic biofilms in Southsea Marina UK during Summer 2017, as recorded with (A) light (top) and fluorescence microscopy (bottom) images (scale bars = 20 μm), and (B) merged fluorescence microscopy and plate reader fluorescence records, where error bars represent standard error.
Testing marine phototrophic biofilms in autumn
In situ quantification of chlorophyll-containing marine biofilms was performed for 30 days in Autumn 2017. Here, biofilms were recorded with increasing cells until day-14, followed by cell decrease until day-20, then cell growth at day-22 and stationary phase up to day-30.
Quantification of in situ ChlF exhibited comparable estimates between fluorescence microscopy () and plate reader () for about 2-week biofilms. Nevertheless, small deviations between microscopy and plate reader measurements were shown at day-20 and day-30 (). Any potential discrepancy was statistically examined. A good correlation (r = 0.93) was shown for ChlF measurement between microscopy and plate reader during the Autumn field experiment (p-value = 0.00059, t Stat = −4.93, t Critical = 2.23, df = 10).
Figure 5. In situ autofluorescence measurements of 30-day natural phototrophic biofilms in Southsea Marina UK during Autumn 2017, as recorded with (A) light (top) and fluorescence microscopy (bottom) images (scale bars = 20 μm), and (B) merged fluorescence microscopy and plate reader fluorescence records, where error bars represent standard error.
Correlation of fluorescence techniques
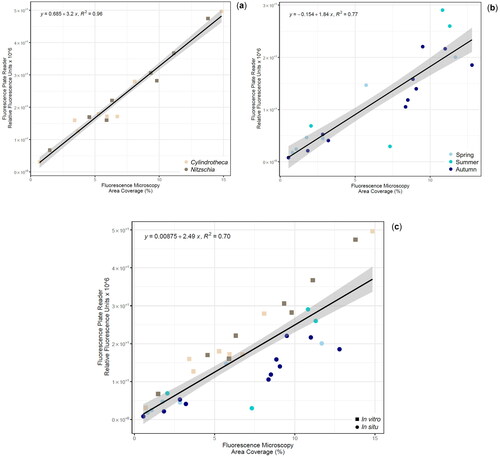
The developed method was examined using a general linear model to test the correlation of ChlF values between the plate reader (Relative Fluorescence Units) and fluorescence microscopy (% Area Coverage) techniques considering all experiments. A strong correlation coefficient ρ = 0.84 (p-value = 1.081e-10, t = 9.05, df = 35, conf.int = [0.7, 0.9]) indicated positive association between the two fluorescence techniques considering all data points.
Scatterplot of ChlF measurements for the in vitro assay illustrated a very strong linear relationship as indicated by the coefficient of determination (R2 = 0.96) () and the established close clustering of all data points to the regression line. The scatterplot for the in situ assay also exhibited an evident strong linear relationship (R2 = 0.77) (). The linear regression model (R2 = 0.70, df = 37, p-value = 1.081e-10, F-statistic = 81.9) used to define the relationship between all variables, demonstrated that fluorescence microscopy (Area Coverage %) explains 70% of the variance in plate reader measurements (Relative Fluorescence Units) (). Estimates of fluorescence microscopy (x axis) could be predicted almost perfect (ρ = 0.84) from plate reader fluorescence (y axis). The result of correlation coefficient close to 1, confirms that these techniques could generate comparable ChlF results.
Figure 6. Scatterplot of general linear model for fluorescence measurements between plate reader and microscopy, testing (a) in vitro monoculture biofilms (R2 = 0.96), (b) in situ marine phototrophic biofilms (R2 = 0.77), and (c) both in vitro and in situ biofilms (R2 = 0.70).
Discussion
Until recent years, the phototrophic biofilm activity has been underestimated since the main research focus of biofilm studies was centred around bacterial biofilms (Hall-Stoodley et al. Citation2004; Flemming et al. Citation2016; de Carvalho Citation2018), whilst phycological studies were focused mainly on the planktonic mode of life (Roeselers et al. Citation2008). It is accepted that due to the complexity of characterising biofilm systems, there are no standardized methods for their enumeration (Pantanella et al. Citation2013), which probably explains the scanty information yet generated for characterising phototrophic biofilms (Bharti et al. Citation2017). The development of simple, reliable, and straightforward methods will eliminate the labour-intensive sample preparation, collection and examination of phototrophic biofilms, and next to this, enhance the consistency between different biofilm studies.
The current paper reports a non-invasive method for rapid in situ phototrophic biofilm quantification based on the use of plate reader fluorescence. Epifluorescence microscopy is used as a reference technique for biofilm quantification. The high-throughput assay assessed two sets of experimental conditions: (1) in vitro monoculture biofilms in a controlled medium, and (2) in situ mixed biofilms in natural seawater. Ultimately, this work demonstrated the utility of chlorophyll fluorescence measurements under varying natural and laboratory conditions.
Bioassay for in vitro assessment of monoculture biofilms
Our results showed that in vitro monoculture biofilms in artificial seawater could be efficiently monitored using plate reader. An earlier study by Warren (Citation2008) has established accuracy and precision in chlorophyll measurements using microplate reader combined with chemical chlorophyll extraction. This paper tested plant species from eight different families in freeze dried form, whilst our proposed approach presented both laboratory and field experiments of model and mixed biofilm samples. Even though chlorophyll extraction with an organic solvent is a widely applied method for measuring chlorophyll, Prieto et al. (Citation2004) have reported inefficient total extraction of chlorophyll from mixed culture of cyanobacteria biofilms (Nostoc, Oscillatoria, Scytonema), and suggested further experiments for robust biofilm quantification. Taking this outcome into account and aiming at designing a method for avoiding cell disruption, the present study selected to compare outcomes of microplate reader with a method of minimum biofilm disruption (i.e. epifluorescence microscopy) compared to chlorophyll extraction. A non-destructive method based on the organism’s colour was suggested by Prieto and colleagues (Prieto et al. Citation2002) where they demonstrated phototrophic quantification of mixed model cyanobacteria; Nostoc and Scytonema, under laboratory conditions using chroma meter to monitor colour shifts. This cost-effective approach did not compare outcomes with a reference method, and it is limited to laboratory set up since further in situ experiments were required for method validation of environmental monitoring. Another investigation applied CLSM, digital image analysis and in vitro chlorophyll extraction to test natural biocides efficiency against multi-species phototrophic biofilms (Chlorophyta; Chlorella, Stichococcus, Cyanobacteria; Leptolyngbya, Pleurocapsa) (Sasso et al. Citation2016). The laboratory-based enrichment experiment indicated good direct correlation of the results obtained, however monitoring phototrophic colonization under environmental conditions was not shown. Our study introduces the in situ experiment of natural biofilms, in addition to a rapid method, i.e. plate reader - contrary to the time consuming digital image analysis and CLSM, or destructive chlorophyl extraction that were applied by Sasso et al. Citation2016. A recent in vitro bioassay explored microalgal growth of the model microalgal biofilm-forming Cylindrotheca closterium and Porphyridium purpureum using microplate reader and CLSM- microfluidic flow-cell (Le Norcy et al. Citation2019). This work established the tested methods to be complementary for biofilm characterisation, although it is limited to laboratory monitoring of monoculture phototrophic biofilms. Moreover, CLSM constitutes a very delicate, expensive to use and time consuming (depending on the parameters tested) method compared to our suggested reference method of epifluorescence microscopy.
Overall, the proposed high-throughput bioassay was shown to adequately facilitate in vitro assessment of phototrophic biofilm growth through the use of plate reader alongside fluorescence microscopy. Plate reader scan results exhibited a similar performance to the fluorescence microscopy data as illustrated from the initial growth of the model fouling diatoms; Cylindrotheca () and Nitzschia () biofilms, and the linear regression model (R2 = 0.96) (). During growth rate estimation of Cylindrotheca closterium diatoms, a decrease in cell concentration was evident during the first five days (Figure S2), which could be a result of slow acclimation (adaptation) (Takahashi Citation2019) and/or stress after inoculation (subculturing). The in vitro bioassay confirmed that the developed non-destructive and rapid quantification method could be successfully applied for laboratory studies of monoculture phototrophic biofilms, as previously suggested (Le Norcy et al. Citation2019), taking advantage of the intrinsic properties from chlorophyll-containing cells, with no need for destructive chemical extraction. Considering that mono-species systems are less reflective of the real environment (Cattò and Cappitelli 2019), while in vitro assays can partially predict the in situ conditions, it was essential to further validate our designed bioassay in the marine environment.
Bioassay for in situ assessment of natural mixed-species biofilms
Our study demonstrated that in situ mixed biofilms (up to 1-month old) in natural seawater could be effectively examined using plate reader. An in situ study implemented by Carreira et al. (Citation2015) quantified and discriminated benthic photosynthetic microbial mats (i.e. cyanobacteria and diatoms), in addition to mixed planktonic diatom Nitzschia capitellata and cyanobacterium Geitlerinema sp. cultures, in the laboratory using autofluorescence imaging (charge coupled device with filters) that was compared to cell counts of the laboratory culture samples. The results of this nonintrusive and simple technique reported close correlation of the two tested methods for the first 8-days, although measurements were not consistent until day-15. Carreira et al. (Citation2015) compared imaging with cell counting only for the in vitro experiment of planktonic cells, whilst our approach applied two techniques feasible to be tested for both natural and culture biofilm samples, therefore comparisons were performed between the methods for the in vitro and in situ experiments (). Another study for in situ assessment of marine biofilm growth introduced a method applied a novel designed flow cell coupled with optical coherence tomography (Fabbri et al. Citation2018). They successfully confirmed biofilm assessment (in terms of thickness, roughness, area coverage) in a dynamic biofilm culturing facility of filtered natural seawater with access to natural sunlight. Advantage of this method is the biofilm testing under controlled flow, yet the development of the specific flow cell does not encourage the wider application of the method, compared to the use of plate reader.
The suggested high-throughput method for in situ phototrophic biofilm quantification was successfully confirmed based on plate reader and fluorescence microscopy measurements. Chlorophyll fluorescence measurements were performed during three field experiments that demonstrated successful quantification of mixed marine biofilms. More specifically, plate reader measurements were shown to be complementary to fluorescence microscopy during the 19-day old Spring biofilms (), the 28-day old Summer biofilms (), and the 30-day old Autumn biofilms (). Some inconsistencies were observed between the two methods - after 17-days in Spring and 20-days in Autumn – which could potentially be attributed to the complex and uneven structure of environmental biofilms, especially with time as aggregates mature. Another reason that could explain this variation is the fact that the plate reader measured the entire surface area (surface scan mode) of the coupon samples, whilst only five fields of view from the coupon samples were randomly selected for epifluorescence microscopy measurements (selective number of optical areas). During the spring sampling campaign, diatoms belonging to the Cocconeis, Navicula and Amphora genera were identified, with Amphora sp. prevailing with time (data not shown).
The intrinsic biological variation in our data was to be expected, however the results statistically showed that intrinsic fluorescence from phototrophic biofilms could be predicted in situ with great confidence with both fluorescence techniques (). Overall, these findings confirmed the efficiency of the plate reader bioassay for in situ quantification of 30-day biofilms in the marine environment. Even though there is an existing methodological gap concerning phototrophic biofilms due to the inherent complexity of natural biofilm assemblages, the current work illustrates a promising method that can be applied with confidence on these natural systems.
Conclusion
In this proof-of-concept study, chlorophyll fluorescence measurements of phototrophic biofilms were successfully conducted under different conditions i) in vitro monocultures, ii) in situ mixed natural biofilms, and iii) during three different seasons. To the best of our knowledge, this is the first in situ bioassay for high-throughput rapid, and non-destructive quantification of up to 1-month natural phototrophic marine biofilms utilizing plate reader - a universally available equipment - complemented by epifluorescence microscopy. The presented biofilm method aimed to set a comprehensive baseline for natural phototrophic biofilm assessment without the need for chlorophyll extraction from the microalgal biofilms, but rather by measuring the intact cells directly from the artificial surface while still being immersed in water. The developed microplate reader-based method is anticipated to serve as a reliable tool for in situ monitoring of phototrophic biofilm formation on several artificial surfaces with commercial interest and contribute towards further development of phototrophic biofilm applications and antibiofilm testing.
Supplemental Material
Download Zip (2.3 MB)Acknowledgements
The authors kindly thank Mr. Marc Martin and Dr. Graham Malyon (University of Portsmouth) for assisting with access the Southsea Marina where field experiments took place. Dr. Beatrice Landoni is acknowledged for statistical advice. The Institute of Marine Science and Prof. Alex Ford (University of Portsmouth) are recognized for providing access to the Epifluorescence Microscope.
Disclosure statement
No potential conflict of interest was reported by the authors.
Additional information
Funding
References
- Amann RI, Stromley J, Devereux R, Key R, Stahl DA. 1992. Molecular and microscopic identification of sulfate-reducing bacteria in multispecies biofilms. Appl Environ Microbiol. 58:614–623. doi:https://doi.org/10.1128/aem.58.2.614-623.1992
- Anil AC, Patil JS, Mitbavkar S, Silva SD, Hegde S, Naik R. 2006. Role of diatoms in marine biofouling. In: Tewari A, editor. Recent advances on applied aspects of Indian marine algae with reference to global scenario, vol. 1. India: CSMCRI; p. 351–365.
- Barranguet C, van Beusekom SAM, Veuger B, Neu TR, Manders EMM, Sinke JJ, Admiraal W. 2004. Studying undisturbed autotrophic biofilms: Still a technical challenge. Aquat Microb Ecol. 34:1–9. doi:https://doi.org/10.3354/ame034001
- Bender J, Phillips P. 2004. Microbial mats for multiple applications in aquaculture and bioremediation. Bioresour Technol. 94:229–238. doi:https://doi.org/10.1016/j.biortech.2003.12.016
- Best RJ, Lyczakowski JJ, Abalde-Cela S, Yu Z, Abell C, Smith AG. 2016. Label-free analysis and sorting of microalgae and cyanobacteria in microdroplets by intrinsic chlorophyll fluorescence for the identification of fast growing strains. Anal Chem. 88:10445–10451. doi:https://doi.org/10.1021/acs.analchem.6b02364
- Beveridge CM, Parr ACS, Smith MJ, Kerr A, Cowling MJ, Hodgkiess T. 1998. The effect of benzalkonium chloride concentration on nine species of marine diatom. Environ Pollut. 103:31–36. doi:https://doi.org/10.1016/S0269-7491(98)00134-1
- Bhadury P, Wright PC. 2004. Exploitation of marine algae: Biogenic compounds for potential antifouling applications. Planta. 219:561–578. doi:https://doi.org/10.1007/s00425-004-1307-5
- Bharti A, Velmourougane K, Prasanna R. 2017. Phototrophic biofilms: diversity, ecology and applications. J Appl Phycol. 29:2729–2744. 1172-9 doi:https://doi.org/10.1007/s10811-017-
- Briand JF. 2009. Marine antifouling laboratory bioassays: an overview of their diversity. Biofouling. 25:297–311. doi:https://doi.org/10.1080/08927010902745316
- Briand J-F, Djeridi I, Jamet D, Coupé S, Bressy C, Molmeret M, Le Berre B, Rimet F, Bouchez A, Blache Y. 2012. Pioneer marine biofilms on artificial surfaces including antifouling coatings immersed in two contrasting French Mediterranean coast sites. Biofouling. 28:453–463. doi:https://doi.org/10.1080/08927014.2012.688957
- Callow ME, Callow JA. 2002. Marine biofouling: a sticky problem. Biologist (London). 49:10–14.
- Camps M, Briand JF, Guentas-Dombrowsky L, Culioli G, Bazire A, Blache Y. 2011. Antifouling activity of commercial biocides vs. natural and natural-derived products assessed by marine bacteria adhesion bioassay. Mar Pollut Bull. 62:1032–1040. doi:https://doi.org/10.1016/j.marpolbul.2011.02.031
- Carreira C, Staal M, Middelboe M, Brussaard CPD. 2015. Autofluorescence imaging system to discriminate and quantify the distribution of benthic cyanobacteria and diatoms. Limnol Oceanogr Methods. 13:e10016–177. doi:https://doi.org/10.1002/lom3.10016
- Cassé F, Ribeiro E, Ekin A, Webster DC, Callow JA, Callow ME. 2007b. Laboratory screening of coating libraries for algal adhesion. Biofouling. 23:267–276. doi:https://doi.org/10.1080/08927010701288336
- Cassé F, Stafslien SJ, Bahr JA, Daniels J, Finlay JA, Callow JA, Callow ME. 2007a. Combinatorial materials research applied to the development of new surface coatings V. Application of a spinning water-jet for the semi-high throughput assessment of the attachment strength of marine fouling algae. Biofouling. 23:121–113. doi:https://doi.org/10.1080/08927010701189583
- Cattò C, Cappitelli F. 2019. Testing anti-biofilm polymeric surfaces: where to start? Int J Mol Sci. 20:3794. doi:https://doi.org/10.3390/ijms20153794
- Cerovic ZG, Ounis A, Cartelat A, Latouche G, Goulas Y, Meyer S, Moya I. 2002. The use of chlorophyll fluorescence excitation spectra for the non-destructive in situ assessment of UV-absorbing compounds in leaves. Plant Cell Environ. 25:1663–1676. doi:https://doi.org/10.1046/j.1365-3040.2002.00942.x
- Characklis WG. 1981. Bioengineering report: fouling biofilm development: a process analysis. Biotechnol Bioeng. 23:1923–1960. doi:https://doi.org/10.1002/bit.260230902
- Clarke S, Mielke RE, Neal A, Holden P, Nadeau JL. 2010. Bacterial and mineral elements in an arctic biofilm: A correlative study using fluorescence and electron microscopy. Microsc Microanal. 16:153–165. doi:https://doi.org/10.1017/S1431927609991334
- Cooksey KE, Wigglesworth-Cooksey B. 1995. Adhesion of bacteria and diatoms to surfaces in the sea: a review. Aquat Microb Ecol. 9:87–96. doi:https://doi.org/10.3354/ame009087
- Corte L, Pierantoni DC, Tascini C, Roscini L, Cardinali G. 2019. Biofilm specific activity: A measure to quantify microbial biofilm. Microorganisms. 7:73–14. doi:https://doi.org/10.3390/microorganisms7030073
- de Carvalho CCCR. 2018. Marine biofilms: a successful microbial strategy with economic implications. Front Mar Sci. 5:126. doi:https://doi.org/10.3389/fmars.2018.00126
- Donlan RM. 2001. Biofilm formation: a clinically relevant microbiological process. Clin Infect Dis. 33:1387–1392. doi:https://doi.org/10.1086/322972
- Eggert A, Häubner N, Klausch S, Karsten U, Schumann R. 2006. Quantification of algal biofilms colonising building materials: Chlorophyll α measured by PAM-fluorometry as a biomass parameter. Biofouling. 22:79–90. doi:https://doi.org/10.1080/08927010600579090
- Fabbri S, Dennington SP, Price C, Stoodley P, Longyear J. 2018. A marine biofilm flow cell for in situ screening marine fouling control coatings using optical coherence tomography. Ocean Eng. 170:321–328. doi:https://doi.org/10.1016/j.oceaneng.2018.10.030
- Flemming HC, Wingender J, Szewzyk U, Steinberg P, Rice SA, Kjelleberg S. 2016. Biofilms: an emergent form of bacterial life. Nat Rev Microbiol. 14:563–575. doi:https://doi.org/10.1038/nrmicro.2016.94
- Hall-Stoodley L, Costerton J, Stoodley P. 2004. Bacterial biofilms: from the natural environment to infectious diseases. Nat Rev Microbiol. 2:95–108. doi:https://doi.org/10.1038/nrmicro821
- Hoagland KD, Rosowski JR, Gretz MR, Roemer SC. 1993. Diatom extracellular polymeric substances: function, fine structure, chemistry, and physiology. J Phycol. 29:537–566. doi:https://doi.org/10.1111/j.0022-3646.1993.00537.x
- Jeffrey SW, Humphrey GF. 1975. New spectrophotometric equations for determining chlorophylls a, b, c1 and c2 in higher plants, algae and natural phytoplankton. Biochem Physiol Pflanz. 167:191–194. doi:https://doi.org/10.1016/S0015-3796(17)30778-3
- Landoulsi J, Cooksey KE, Dupres V. 2011. Review - Interactions between diatoms and stainless steel: focus on biofouling and biocorrosion. Biofouling. 27:1109–1124. doi:https://doi.org/10.1080/08927014.2011.629043
- Lawrence JR, Neu TR. 1999. Confocal laser scanning microscopy for analysis of microbial biofilms. Methods Enzymol. 310:131–142. doi:https://doi.org/10.1016/S0076-6879(99)10011-9
- Lawrence JR, Neu TR, Swerhone GDW. 1998. Application of multiple parameter imaging for the quantification of algal, bacterial and exopolymer components of microbial biofilms. J Microbiol Methods. 32:253–261. doi:https://doi.org/10.1016/S0167-7012(98)00027-X
- Le Norcy T, Faÿ F, Zea Obando C, Hellio C, Réhel K, Linossier I. 2019. A new method for evaluation of antifouling activity of molecules against microalgal biofilms using confocal laser scanning microscopy-microfluidic flow-cells. Int Biodeterior Biodegrad. 139:54–61. doi:https://doi.org/10.1016/j.ibiod.2019.03.001
- Le Norcy T, Niemann H, Proksch P, Linossier I, Vallée-Réhel K, Hellio C, Faÿ F. 2017. Anti-biofilm effect of biodegradable coatings based on hemibastadin derivative in marine environment. Int J Mol Sci. 18:1520. doi:https://doi.org/10.3390/ijms18071520
- Luo TL, Eisenberg MC, Hayashi MAL, Gonzalez-Cabezas C, Foxman B, Marrs CF, Rickard AH. 2018. A sensitive thresholding method for confocal laser scanning microscope image stacks of microbial biofilms. Sci Rep. 8:13013. doi:https://doi.org/10.1038/s41598-018-31012-5
- Molino PJ, Wetherbee R. 2008. The biology of biofouling diatoms and their role in the development of microbial slimes. Biofouling. 24:365–379. doi:https://doi.org/10.1080/08927010802254583
- Mosleh MAA, Manssor H, Malek S, Milow P, Salleh A. 2012. A preliminary study on automated freshwater algae recognition and classification system. BMC Bioinf. 13:S25. doi:https://doi.org/10.1186/1471-2105-13-S17-S25
- Mueller LN, de Brouwer JF, Almeida JS, Stal LJ, Xavier JB. 2006. Analysis of a marine phototrophic biofilm by confocal laser scanning microscopy using the new image quantification software PHLIP. BMC Ecol. 6:1. doi:https://doi.org/10.1186/1472-6785-6-1
- Muthukrishnan T, Dobretsov S, De Stefano M, Abed RMM, Kidd B, Finnie AA. 2017. Diatom communities on commercial biocidal fouling control coatings after one year of immersion in the marine environment. Mar Environ Res. 129:102–112. doi:https://doi.org/10.1016/j.marenvres.2017.05.001
- Nadeau JL, Perreault NN, Niederberger TD, Whyte LG, Sun HJ, Leon R. 2008. Fluorescence microscopy as a tool for in situ life detection. Astrobiology. 8:859–874. doi:https://doi.org/10.1089/ast.2007.0043
- Olwal CO, Ochiel DO, Onyango DM, Oyieng P, Ochieng C. 2017. Bacterial biofilm cells quantification techniques: Where is consensus in over two decades? J Microbiol Biotechnol Food Sci. 7:168–173. doi:https://doi.org/10.15414/jmbfs.2017.7.2.168-173
- Pantanella F, Valenti P, Natalizi T, Passeri D, Berlutti F. 2013. Analytical techniques to study microbial biofilm on abiotic surfaces: pros and cons of the main techniques currently in use. Ann Ig. 25:31–42. doi:https://doi.org/10.7416/ai.2013.1904
- Papadatou M, Robson SC, Dobretsov S, Watts JEM, Longyear J, Salta M. 2021. Marine biofilms on different fouling control coating types reveal differences in microbial community composition and abundance. Microbiologyopen. 10:e1231. doi:https://doi.org/10.1002/mbo3.1231
- Prieto B, Rivas T, Silva B. 2002. Rapid quantification of phototrophic microorganisms and their physiological state through their colour. Biofouling. 18:237–245. doi:https://doi.org/10.1080/08927010290014917
- Prieto B, Silva B, Lantes O. 2004. Biofilm quantification on stone surfaces: Comparison of various methods. Sci Total Environ. 333:1–7. doi:https://doi.org/10.1016/j.scitotenv.2004.05.003
- R Core Team. 2020. R: a language and environment for statistical computing. Vienna, Austria: R Foundation for Statistical Computing. https://www.R-project.org/.
- Roeselers G, Loosdrecht MCMV, Muyzer G. 2008. Phototrophic biofilms and their potential applications. J Appl Phycol. 20:227–235. doi:https://doi.org/10.1007/s10811-007-9223-2
- Roeselers G, van Loosdrecht MC, Muyzer G. 2007. Heterotrophic pioneers facilitate phototrophic biofilm development. Microb Ecol. 54:578–585. doi:https://doi.org/10.1007/s00248-007-9238-x
- Salta M, Dennington SP, Wharton JA. 2018. Biofilm inhibition by novel natural product-and biocide-containing coatings using high-throughput screening. Int J Mol Sci. 19:1434–1416. doi:https://doi.org/10.3390/ijms19051434
- Salta M, Wharton JA, Blache Y, Stokes KR, Briand JF. 2013. Marine biofilms on artificial surfaces: Structure and dynamics. Environ Microbiol. 15:2879–2893. doi:https://doi.org/10.1111/1462-2920.12186
- Sasso S, Miller AZ, Rogerio-Candelera MA, Cubero B, Coutinho ML, Scrano L, Bufo SA. 2016. Potential of natural biocides for biocontrolling phototrophic colonization on limestone. Int Biodeterior Biodegrad. 107:102–110. doi:https://doi.org/10.1016/j.ibiod.2015.11.017
- Schumacher G, Blume T, Sekoulov I. 2003. Bacteria reduction and nutrient removal in small wastewater treatment plants by an algal biofilm. Water Sci Technol. 47:195–202.
- Serodio J, Silva JM, Catarino F. 1997. Nondestructive tracing of migratory rhythms of intertidal benthic microalgae using in vivo chlorophyll a fluorescence. J Phycol. 33:542–553. doi:https://doi.org/10.1111/j.0022-3646.1997.00542.x
- Stafslien SJ, Bahr JA, Feser JM, Weisz JC, Chisholm BJ, Ready TE, Boudjouk P. 2006. Combinatorial materials research applied to the development of new surface coatings I: a multiwell plate screening method for the high-throughput assessment of bacterial biofilm retention on surfaces. J Comb Chem. 8:156–162. doi:https://doi.org/10.1021/cc050047m
- Stafslien S, Daniels J, Chisholm B, Christianson D. 2007. Combinatorial materials research applied to the development of new surface coatings III. Utilisation of a high-throughput multiwell plate screening method to rapidly assess bacterial biofilm retention on antifouling surfaces. Biofouling. 23:37–44. doi:https://doi.org/10.1080/08927010601127311
- Surman SB, Walker JT, Goddard DT, Morton LHG, Keevil CW, Weaver W, Skinner A, Hanson K, Caldwell D, Kurtz J. 1996. Comparison of microscope techniques for the examination of biofilms. J Microbiol Methods. 25:57–70. doi:https://doi.org/10.1016/0167-7012(95)00085-2
- Takahashi T. 2019. Routine management of microalgae using autofluorescence from chlorophyll. Molecules. 24:4441. doi:https://doi.org/10.3390/molecules24244441
- Warren CR. 2008. Rapid measurement of chlorophylls with a microplate reader. J Plant Nutr. 31:1321–1332. doi:https://doi.org/10.1080/01904160802135092
- Wickham H. 2016. ggplot2: elegant graphics for data analysis. New York (NY): Springer-Verlag. https://ggplot2.tidyverse.org.
- Wolf G, Crespo JG, Reis MA. 2002. Optical and spectroscopic methods for biofilm examination and monitoring. Rev Environ Sci Biotechnol. 1:227–251. doi:https://doi.org/10.1023/A:1021238630092
- Woodward RB, Ayer WA, Beaton JM, Bickelhaupt F, Bonnett R, Buchschacher P, Closs GL, Dutler H, Hannah J, Hauck FP, et al. 1960. The total synthesis of chlorophyll. J Am Chem Soc. 82:3800–3802. doi:https://doi.org/10.1021/ja01499a093
- Zargiel KA, Coogan JS, Swain GW. 2011. Diatom community structure on commercially available ship hull coatings. Biofouling. 27:955–965. doi:https://doi.org/10.1080/08927014.2011.618268
- Zargiel KA, Swain GW. 2014. Static vs dynamic settlement and adhesion of diatoms to ship hull coatings. Biofouling. 30:115–129. doi:https://doi.org/10.1080/08927014.2013.847927