Abstract
A methodology for discovering the mechanisms and dynamics of protein clustering on solid surfaces is reviewed and complemented by atomistic molecular dynamics (MD) simulations. In situ atomic force microscopy images of the early stages of protein film formation are quantitatively compared with Monte Carlo simulations, using cluster statistics to differentiate various growth models. We have studied lysozyme adsorption on mica as a model system, finding that all surface-supported clusters are mobile with diffusion constant inversely related to cluster size. Furthermore, our results suggest that protein monomers diffusing to the surface from solution only adhere to the bare surface with a finite probability. Fully atomistic MD simulations reveal that the lysozyme does indeed have a preferred orientation for binding to the surface, so that proteins with incorrect orientations move away from the surface rather than towards it. Agreement with experimental studies in the literature for the residues involved in the surface adsorption is found.
1. Introduction
Protein interaction with solid surfaces is a topic of growing scientific and technological importance. Protein immobilisation at surfaces is desirable for detailed experimental characterisation [Citation1], and necessary for a range of applications such as functionalisation of surfaces and bio-compatible material design [Citation2,Citation3]. Current materials science interest centres on bio-mineralisation [Citation4] and other material surface-specific molecular biomimetics [Citation5]. The understanding of these processes requires first a sound understanding of how a protein film evolves through the earliest stages of adsorption.
Surprisingly, the mechanisms and dynamics of protein aggregation on solid substrates have, in the past, not been studied in much detail. Random sequential adsorption (RSA) models are widely assumed to be adequate, whereby surface diffusion is at best limited to cluster rearrangements with no long-range centre-of-mass diffusion [Citation6]. However, atomic force microscopy (AFM) images repeatedly show clustering of proteins, which indicate that such models are inadequate Citation7-9. Detailed comparisons between experiment and modelling are rarely found. Furthermore, a methodology to enable a quantitative understanding of both the mechanisms and rates of diffusion and clustering on a solid substrate has, until our recent work, been lacking.
To address this topic, we believe a range of approaches is needed, including multi-scale modelling. In this paper, we review a recently introduced methodology, and supplement this with new, fully atomistic molecular dynamics (MD) simulations. Our work shows that progress towards understanding the highly complex adsorption processes and dynamics can be made, although many challenges lie ahead.
2. Lysozyme adsorption on a mica surface: AFM and Monte Carlo simulations
A methodology to reveal the mechanisms and dynamics of protein clustering on solid surfaces has recently been presented [Citation10]. The idea is to monitor the evolution of the earliest stages of the protein layer formation using in situ AFM, comparing the images with suitable Monte Carlo simulations. The simulations are versatile enough to allow several possible growth processes to be explored. The statistical properties of the simulations are then characterised in terms of the cluster average size and the evolution of the cluster size distribution. Comparison of this statistical data with that taken from the AFM then permits the selection of the most successful model, whose dynamics can be quantified from the observed coverage evolution of the surface.
A model system of lysozyme (L6876, Sigma–Aldrich, Brøndby, Denmark) adsorption onto mica has been used to demonstrate this methodology [Citation10,Citation11]. Lysozyme is globular and fairly robust so that reliable observation using in-liquid AFM is viable, and mica provides a flat surface for microscopy while presenting a charged surface to attract the protein. Furthermore, lysozyme is small enough to allow atomistic MD simulations as described below.
The experiments are performed under stagnant conditions using a very dilute (1 μg/ml) protein solution, so the deposition process lasts many hours allowing adequate time for AFM imaging. A low ionic strength 0.02 M solution (with pH 4 at 22°C) is used to allow electrostatic interactions between the protein and the surface, which carry opposite charge at low pH. The experiments show that protein clusters are formed on the surface, and that they are monolayer in height, in agreement with other experimental work [Citation7].
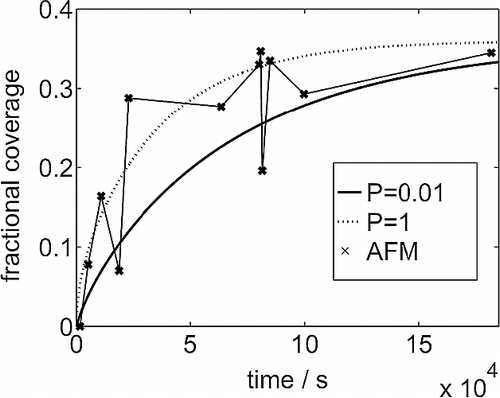
In Figure , we present data for the evolution of the fractional surface coverage observed in our experiments. The depth of solution used was 3 mm, allowing us to estimate the final substrate coverage to be 0.36 when the solution is entirely depleted of protein. As can be seen, this final coverage is approached after about 50 h. The dynamics of the coverage evolution can be modelled by assuming that the protein diffuses through the bulk solution and adheres to bare substrate only. With a bulk diffusivity of D b = 1 × 10− 6 cm2 s− 1 [Citation12], the coverage is predicted to evolve as the broken line in Figure , providing a reasonably good match with the available data. We also investigate the possibility that the protein only sticks to the bare substrate with finite probability P; as we shall see below this can be related to the orientation requirements for protein adsorption. The solid curve in Figure is obtained with P = 0.01, which represents the lower bound for P while still providing a satisfactory explanation of the AFM data. Note that the effect of this lower value of P is to slow down the evolution of the substrate coverage, thereby providing a higher flux of protein to the surface at later times.
Figure 1 Coverage of the substrate observed in AFM experiments against exposure time. The smooth curves come from a solution of the diffusion equation, assuming translational symmetry across the system, starting with a uniform distribution of the lysozyme in solution and a bare adsorbing substrate. The sticking coefficient onto bare substrate is P = 1.0 and 0.01.
Let us turn now to the statistics of the clusters that self-organise on the surface. In [Citation10], we showed that the distributions cannot be explained using any of the most popular nucleation and growth models. These include RSA where long-range surface diffusion is omitted, and critical island size models where stationary islands nucleate whenever the critical island size i is exceeded on the surface. Instead, a model with mobile clusters is required. We developed a Monte Carlo simulation, where monomers (individual proteins) are deposited into a lattice representing the surface at the rate determined from the curves in Figure . The monomers diffuse by hopping to nearest-neighbour sites; simulations performed with different surface diffusion rates yield different total cluster densities over time. Clusters form when two or more monomers ‘collide’ by becoming the nearest neighbours in the lattice. The clusters themselves can move by rigid translation of their centre-of-mass, maintaining their footprints on the lattice. A collision between one cluster and another cluster or monomer results in the formation of a larger cluster. In this way, ramified clusters, similar to those observed experimentally [Citation7,Citation10,Citation11], are formed in the simulation.
The cluster mobility D s varies as a power of cluster size (mass) in our simulations (D s = D 1 s − μ). Different values of μ capture a range of growth mechanisms; μ = 0 means all clusters are equally mobile regardless of size, while large values of μ essentially freeze out the movement of all except monomers yielding a critical island size i = 1 simulation. Furthermore, intermediate values of μ are expected to reflect the dominant mechanism that causes the cluster mobility: μ = 0.5 is expected when monomer evaporation and condensation within a reservoir of surface monomers dominates the cluster mobility; μ = 1 when monomer diffusion over/through the cluster dominates; and μ = 1.5 when edge diffusion of monomers around clusters dominates. By using the statistics of the simulations to find the best model to describe the experimental data, we identify the dominant growth mechanism.
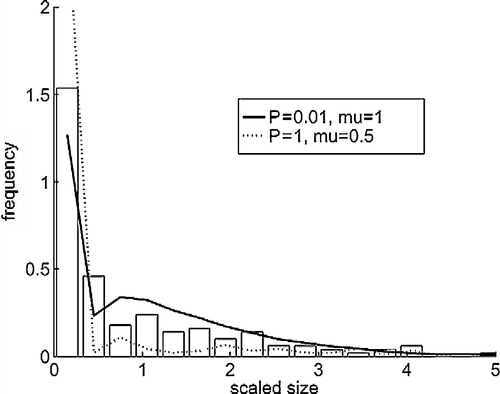
In Figure , we show the cluster size distribution observed in our AFM experiments at the final stages of the protein adsorption from solution [Citation11]. This is compared with the results from the simulations that have been found to provide comparable distributions at this and earlier times. With the adsorption probability P = 1, we find that a low value of μ = 0.5 provides a reasonable distribution of cluster sizes, while with P = 0.01, μ = 1 works best. To explain this, we note that at P = 1 the protein deposition is initially more rapid, so that larger values of μ>0.5 cause the clusters to be effectively immobilised early on, yielding a peaked size distribution reminiscent of a critical island size i>0 model. However, with P = 0.01, the slower deposition means that clusters have more time to explore their neighbourhood before new material arrives, so that μ = 0.5 yields a distribution that is overly skewed towards small clusters.
Figure 2 Cluster size distributions at time 180,000 s. The abscissa is scaled to the mean size. The bars are from the AFM experiments and the lines from the simulations with mobile clusters.
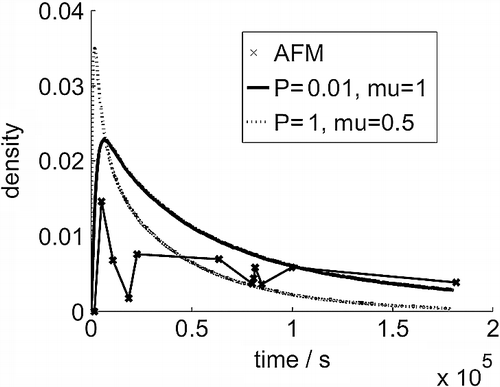
To distinguish the two possible parameter sets, we turn to the evolution of the density of the clusters as shown in Figure . As can be seen, the (P = 1, μ = 0.5) simulations produce a high early peak in cluster density that falls to very low values towards the end of the simulation, a shape that does not compare well with experiment. By contrast, the (P = 0.01, μ = 1) simulations produce a more realistic density evolution. The final stage of parameterisation is now achieved by adjusting the monomer diffusion rate across the surface, and we find D 1∼4.5 to 9 × 10− 16 cm2 s− 1 [Citation11].
Figure 3 Cluster density (number per 3 × 3 nm area) evolution over time from AFM images and the simulation models.
To summarise our findings, our simulations indicate two key mechanisms: firstly, not only are the lysozyme monomers mobile on the surface, the clusters they form also appear to diffuse with rates that fall inversely with mass (size); and secondly, the protein only appears to adhere to the bare mica surface with finite probability. In the next section, we show how complementary atomistic simulations can help understand in more detail the second of these conclusions.
3. Molecular dynamics simulations
The crystal structure of Hen Egg-White Lysozyme (HEWL; 1iee.pdb) is the starting structure of all our simulations, with all four disulphide bridges kept. The calculations were performed with the CHARMM force field using the NAMD package [Citation13], while neutralisation, solvation and trajectory visualisation were performed using the VMD programme [Citation14]. Here, we present three different systems. The first comprises the HEWL molecule placed in a rectangular box of water molecules (TIP3) that extends 8 Å from any protein atom, giving a total of over 15,000 atoms. Since the net protein charge was +4e (at pH 7), the system was neutralised by adding NaCl salt with ionic strength 0.02 M. A 20 ns trajectory of this system provided a reference for trajectories of the protein–surface systems.
Two systems containing the protein molecule and a model mica surface located in different positions with respect to the protein (orientations 1 and 2) have also been simulated. The surface was created from charged silicon (+1.11e) and oxygen ( − 0.66e) atoms, located 1.6 Å away from each other and held rigidly in a square array. The resulting surface charge density σ = − 0.0217e/Å2 is almost equal to that of mica at pH 7 [Citation15]. The neutralised protein was placed close to the surface and then the whole HEWL–surface system was solvated in a water box that extends at least 20 Å from any protein atom and 1 Å from any surface atom. These systems contain ∼50,000 atoms, including 1960 protein and 2450 surface atoms.
After initial preparation, all three systems were treated in the same way. First, they were subject to 100 ps water equilibration, 10,000 steps of whole system minimisation, 30 ps heating to 300 K and 270 ps equilibration at this temperature. The production MD simulations were pursued for 20 ns at 300 K in the NVT ensemble. The integration step was 2 fs, and the SHAKE algorithm and periodic boundary conditions were used. The cut-off distance for the Coulomb and van der Waals interactions was 12 Å. Due to their high computational cost, we have performed short test simulations using much larger cut-offs for the Coulomb interactions. The overall trends are similar for the two approaches, and we only present results for systems with the shorter Coulomb cut-off distance. For ionisable residues, the most probable charge states at pH 7 were chosen.
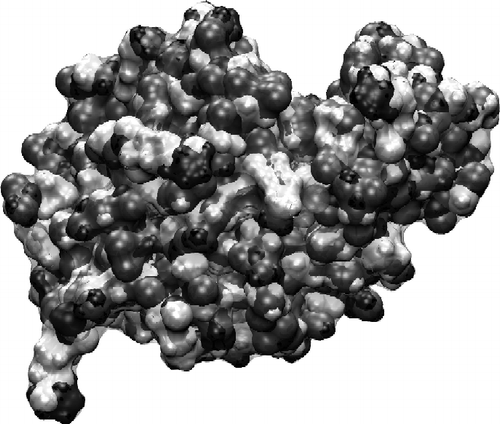
Before discussing the surface–protein results, we first consider the isolated protein. In Figure , we show the charge distribution across the equilibrated protein surface. It is known that electrostatics play an important role in the adsorption process, since solutions with ionic strength above 0.5 M prevent the adsorption taking place [Citation16]. However, there is no obvious positively charge patch on the protein surface that might be expected to interact with the negatively charged mica surface. This highlights the importance of performing molecular modelling, which allows structural relaxation in the molecule to occur; models built on the concept of rigid proteins are likely to fail to capture the essence of the process [Citation15,Citation17].
Figure 4 Surface charge plot of the isolated lysozyme in solution. Dark indicates positive charge, and grey negative. The protein has a net positive charge of +4e at pH 7.
In Figure , we show what happens to the protein over the 20 ns trajectory, starting from orientation 1. In this orientation, the C and N termini of the molecule initially lie close to the surface, with the closest side chain (Arg128) about 8 Å and its backbone about 12 Å away from the surface. At the end of the trajectory, we see that the protein has moved closer to the surface and rotated to allow interaction of Lys1 and Arg128 with the water layers above the surface. The Lys1 and Arg128 side chains have penetrated a water layer and locally disturbed the highly organised hydrogen bond network within the layers. Since the smallest distance between protein side chains and the surface was about 3 Å, new chemical bonds have not created. The protein–surface interactions also require some flexing of loop regions, but the helical content of the protein is unaffected. The changes in the distance of key residues from the surface are shown in Table for clarity. The RMS data (not shown) show that the initial stages of the adsorption process are complete by the end of the 20 ns trajectory.
Figure 5 MD simulation of lysozyme in orientation 1 above the surface. The left image is the initial configuration after thermalisation, and the right is after 20 ns at 300 K.
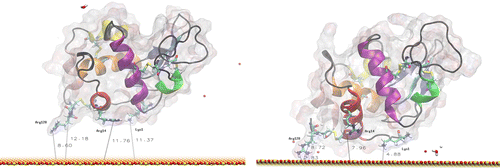
Table 1. Initial and final distances between the plane of the surface and the key residues involved in the early stages of lysozyme adsorption in orientation 1 (see Figure ).
The simulation results for the second orientation are shown in Figure . In this case, the C and N termini of the molecule are oriented away from the surface. The surface is initially located about 6 Å away from the closest HEWL side chain (Arg112) and about 10 Å away from the backbone (Asp48). Over the 20 ns trajectory, the protein this time moves away from the surface; see Table for the change in the surface separation for reference residues.
Figure 6 MD simulation of lysozyme in orientation 2 above the surface. The left image is the initial configuration after thermalisation, and the right is after 20 ns at 300 K.
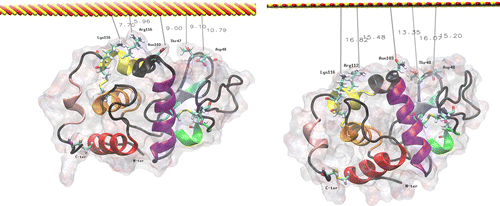
Table 2. Initial and final distances between ‘uppermost’ residues in orientation 2 (Figure ) and the plane of the surface.
These two results indicate that the lysozyme does indeed have a preferred orientation for adsorption on the surface, and helps to justify the inclusion of the finite adsorption probability in the Monte Carlo simulations discussed above. Furthermore, there is experimental evidence to support our findings that the most important residues for the interactions between lysozyme and the surface are Arg14, Arg128 and Lys1, all located on the N,C-terminal part of the protein surface. This set is consistent with results obtained by Aizawa et al. who propose that the potential adsorption site is composed from Lys1, Lys13 and Arg14 [Citation18]. The composition of the main adsorption site found by Dismer et al. [Citation19] also agrees with our selection of residues. Therefore, while the 20 ns MD trajectories are too short to test for protein unfolding at the surface, it seems that we have correctly identified the early stages of the protein adsorption. This lends support to our modelling of adsorption with a finite probability.
4. Summary and conclusions
A new methodology to reveal the mechanisms and dynamics of protein adsorption on solid surfaces has been developed. A combination of AFM imaging and Monte Carlo simulation, characterised by appropriate statistics, allows the discovery of the dominant growth mechanisms in the earliest stages of protein layer formation. Applying the methodology to a model system of lysozyme-on-mica, we are led to a (perhaps unexpected) conclusion that protein clusters as well as monomers are mobile on the surface. Furthermore, the simulations indicate how the mobility varies with cluster mass, and allows the quantification of the rates of diffusion. The simulations also require that the protein adheres to the surface with finite probability.
A detailed atomistic understanding of these results is a major challenge. We have made the first steps towards this goal, by studying the initial stages of lysozyme interaction with a model surface using standard MD simulations. These simulations already support the notion of a finite adsorption probability, since the protein requires a specific orientation to the surface for the adsorption to occur.
A fuller exploration of the interactions with the surface requires much longer timescale simulations. Confrontation with the results for surface diffusion of the protein monomer and clusters remains a daunting task. Nevertheless, the clues provided by the Monte Carlo simulations, namely that the cluster mobility varies inversely with mass, and the diffusion mechanism this implies, provide a focus for our future work.
Acknowledgements
This research is supported by the UK Engineering and Physical Sciences Research Council through grant No. EP/E012284.
References
- Palmer , R.E. and Leung , C. 2007 . Immobilisation of proteins by atomic clusters on surfaces . Trends Biotechnol. , 25 : 48 – 55 .
- Gray , J.J. 2004 . The interaction of proteins with solid surfaces . Curr. Opin. Struct. Biol. , 14 : 110 – 115 .
- Kasemo , B. 2002 . Biological surface science . Surf. Sci. , 500 : 656 – 677 .
- Harding , J.H. and Duffy , D.M. 2006 . The challenge of biominerals to simulations . J. Mater. Chem. , 16 : 1105 – 1112 .
- Sarikaya , M. , Tamerler , C. , Jen , A.K.Y. , Schulten , K. and Baneyx , F. 2003 . Molecular biomimetics: nanotechnology through biology . Nat. Mater. , 2 : 577 – 585 .
- Talbot , J. , Tarjus , G. , Van Tassel , P.R. and Viot , P. 2000 . From car parking to protein adsorption: an overview of sequential adsorption processes . Colloids Surf. A , 165 : 287 – 324 .
- Kim , D.T. , Blanch , H.W. and Radke , C.J. 2002 . Direct imaging of lysozyme adsorption onto mica surface by atomic force microscopy . Langmuir , 18 : 5841 – 5850 .
- McMaster , T.J. , Miles , M.J. , Shewry , P.R. and Tatham , A.S. 2000 . In situ surface adsorption of the protein C hordein using atomic force microscopy . Langmuir , 16 : 1463 – 1468 .
- Cullen , D.C. and Lowe , C.R. 1994 . AFM studies of protein adsorption 1: time-resolved protein adsorption to highly oriented pyrolytic-graphite . J. Colloid Interface Sci. , 166 : 102 – 108 .
- Mulheran , P.A. , Pellenc , D. , Bennett , R.A. , Green , R.J. and Sperrin , M. 2008 . Mechanisms and dynamics of protein clustering on a solid surface . Phys. Rev. Lett. , 100 068102
- Pellenc , D. , Bennett , R.A. , Green , R.J. , Sperrin , M. and Mulheran , P.A. 2008 . New insights on growth mechanisms of protein clusters at surfaces: an AFM and simulation study . Langmuir , 24 : 9648 – 9655 .
- Dubin , S.B. , Noel , A.C. and Benedek , G.B. 1971 . Measurement of rotational diffusion coefficient of lysozyme by depolarized light scattering – configuration of lysozyme in solution . J. Chem. Phys. , 54 : 5158 – 5164 .
- Phillips , J.C. , Braun , R. , Wang , W. , Gumbart , J. , Tajkhorshid , E. , Villa , E. , Chipot , Ch. , Skeel , R.D. , Kale , L. and Schulten , K. 2005 . Scalable molecular dynamics with NAMD . J. Comput. Chem. , 26 : 1781 – 1802 .
- Humphrey , W. , Dalke , A. and Schulten , K. 1996 . VMD – visual molecular dynamics . J. Mol. Graphics , 14 : 33 – 38 .
- Carlsson , F. , Hyltner , E. , Arnebrant , T. , Malmsten , M. and Linse , P. 2004 . Lysozyme adsorption to charged surfaces. A Monte Carlo study . J. Phys. Chem. B , 108 : 9871 – 9881 .
- Su , T.J. , Lu , J.R. , Thomas , R.K. , Cui , Z.F. and Penfold , J. 1998 . The adsorption of lysozyme at the silica—water interface: a neutron reflection study . J. Colloid Interface Sci. , 203 : 419 – 429 .
- Ravichandran , S. , Madura , J.D. and Talbot , J. 2001 . A Brownian dynamics study of the initial stages of hen egg-white lysozyme adsorption at a solid interface . J. Phys. Chem. B , 105 : 3610 – 3613 .
- Aizawa , T. , Koganesawa , N. , Kamakura , A. , Masaki , K. , Matsuura , A. , Nagadome , H. , Terada , Y. , Kawano , K. and Nitta , K. 1998 . Adsorption of human lysozyme onto hydroxyapatite . FEBS Lett. , 422 : 175 – 178 .
- Dismer , F. , Petzhold , M. and Hubbuch , J. 2008 . Effects of ionic strength and mobile phase pH on the binding orientation of lysozyme on different ion-exchange adsorbents . J. Chromat. A , 1194 : 11 – 21 .