
 ?Mathematical formulae have been encoded as MathML and are displayed in this HTML version using MathJax in order to improve their display. Uncheck the box to turn MathJax off. This feature requires Javascript. Click on a formula to zoom.
ABSTRACT
We describe a new approach which predicts the level of internalisation or complete wrapping of nanoparticles by liposomes in solution. It is based on a generalisation of elastic thin film theory to the wrapping of bilayers around nanoscale particles using physical property data, primarily the strength of adhesion between the bilayer and particle surface, obtained from atomistic and coarse-grained simulations. We apply this approach to predict the maximum number of nanoparticles of a given type that can be internalised by a given liposome: new data that could be correlated with nanoparticle toxicity experiments. Examples are provided of how our approach might be used to identify and/or design nanoparticles with different uptakes. We briefly discuss the possibility of designing nanoscale separations process.
1. Introduction
The interaction of inorganic surfaces with cells is of interest in medicine and in toxicology. In particular, the effects of exposure to finely divided inorganic materials in the form of nanoparticles are of great concern [Citation1–5] as their toxicological properties are uncertain, even for naturally occurring minerals such as silica and titania. At the same time, there has been a rapid increase in the number and variety of engineered nanoparticles in the environment [Citation6], including those arising from the use of batteries, catalysts, chemical coatings and paints, packaging, electronic devices, implants, biomedicines, food additives and cosmetics [Citation7]. Nanoparticles may enter the human body through inhalation, digestion, injection or through direct contact with the skin. Our research [Citation8] and that of others [Citation9,Citation10] is focused on the interaction of nanoparticles with cytoplasmic and vesicular membranes, as a first step in assessing the likely impact of nanoparticles at the cellular level [Citation11]. To help identify the essential features of such interactions we first study a much simpler ‘model’ membrane; the liposome [Citation12,Citation13], with the long-term goal of being able to predict the likely effect of nanoparticles on cells. For example, an adverse outcome [Citation14] may arise due to damage caused by nanoparticles to lysosomal membranes within the cellular endocytic (autophagy) pathway. Whilst the role of functioning lysosomes in autophagy is an essential part of cell maintenance, cell death can be triggered by lysosomal membrane permeabilisation (LMP) or rupture and subsequent release of lysosomal hydrolases from the lumen into the cytosol. There is strong evidence [Citation15,Citation16] that some nanomaterials can interfere with the functioning of lysosomes, through, for example macrophage overload, LMP and depletion (selective adsorption) causing lysosome-dependent cell death, initiating adverse outcome pathways in the body.
A key measure of the degree of interaction between nanoparticles and membranes is the extent to which the nanoparticle adheres to or, is wrapped by, the membrane. According to the Helfrich membrane model [Citation17] applied by Deserno et al. [Citation18] to the wrapping of spherical particles by membranes, this is determined by whether the adhesion strength is sufficient to overcome the bending energy associated with membrane deformation during particle wrapping. Particles smaller than a critical size will not adhere to the membrane. Larger particles will adhere and undergo wrapping, the extent to which wrapping occurs determined by the membrane tension. With low tension and/or strong adhesion, particles will be completely engulfed. However, the assumptions inherent in the Deserno model means that it is strictly only valid when the particle is small compared to the liposome diameter (small local membrane curvature) and when the particle is large compared to the membrane thickness (which is about 4 nm). More recently the case where the curvature of the membrane approaches that of the particle has been considered, along with the role of local membrane curvatures [Citation19–22]. Simulations of models of single particle and multiparticle assembles on membranes have also been reported [Citation23], in particular tube phases which we have seen in an experiment [Citation24].
The relevance to nanoparticle toxicity arises from three considerations (a) nanoparticles which are predicted to be fully or partially wrapped may scavenge lipids from the cell plasma membrane destroying or disrupting it [Citation24], (b) nanoparticles can be taken up by the cell by endocytosis and subsequently exposed in the autolysosome where they will interact with the lysosomal membranes possibly leading to the lysosomal membrane permeabilisation or rupture and subsequent release of lysosomal hydrolases and (c) fully wrapped nanoparticles, taken up by the cell by passive adsorption, could detach from the membrane inside the cell and become available to be taken up by the endocytic pathway(see b). Note that gold nanoparticles inside vesicles are observed experimentally [Citation25] to cross the plasma membrane of HeLa cells into the cytosol where a fraction are subsequently taken up by endosomes.
The adhesion strength drives the particle wrapping process and therefore any assessment of the potential nanotoxicity of a material must include an estimate of its adhesion strength for a given membrane which we approximate in what follows by the adhesion strength with respect to a model membrane featuring only lipids (ignoring, for now, the role of membrane proteins). A major obstacle to progress is the almost complete lack of quantitative experimental data for nanoparticle/lipid bilayer adsorption enthalpies and free energies (adhesion strength) [Citation26]. One solution is to calculate such data using molecular simulation and indeed in previous work we have calculated adhesion strengths for 1,2-dimyristoyl-glycero-3-phosphatidylcholine (DMPC) bilayers on various planar surfaces. A key feature is the use of pull groups acting on one dimension of the membrane which can maintain tension while still allowing lipids to quickly migrate between bilayer leaflets, something that can only occur by the relatively slow flip-flop mechanism in fully periodic bilayer simulations.
This feature is particularly advantageous in simulations of particle wrapping when applied in both dimensions of the membrane to form a bilayer disk. Traditional wrapping simulations [Citation27] employing periodic boundaries resulted in particles only partially wrapped by tensionless membranes, contrary to the theoretical prediction [Citation18] and experimental observation [Citation28] that wrapping should always proceed to completion. The likely reason for the discrepancy is the compression of lipids in the leaflet in contact with the particle relative to the outer leaflet which limits further membrane deformation. By allowing lipids to readily migrate between leaflets the tension in each leaflet can remain in equilibrium even as the area of each leaflet changes during wrapping, whereas the tension in each leaflet of a periodic membrane differs even though the effective membrane tension (i.e. the average leaflet tension) is maintained at zero.
In what follows, we describe a mechanistic model of particle uptake by model membranes which, given several assumptions, can be used to rank particles with respect to their ability to disrupt and/or penetrate lipid membranes. We use molecular simulation and elastic theory to treat the problem of nanoparticle wrapping by liposomes which, in principle, enables a wide range of materials to be screened with the minimum of time-consuming simulations. This has enabled us to form a ranking of nanomaterial surfaces based on lipid membrane adhesion strength () from simulation for a subset of materials used in the SmartNanoTox [Citation9] project. Adhesion strength data could be used to develop models/rankings of potential cell damage due to a given type of nanoparticle and/or pulmonary surfactant disruption due to the presence of nanoparticles in the alveolar spaces of lungs. An important finding is that there are no shortcuts to the prediction of adhesion strength. For example, estimating the adhesion strength based on single-molecule adsorption data does not give the right answer because the physics of the two processes are different. Membrane lipids orient perpendicular (or at an acute angle with respect to the surface normal) to the surface while single or low density lipids tend to adsorb flat on the surface.
Table 1. Results from atomistic adhesion simulations using the ribbon geometry.
Our work can be divided into two broad sections. In the first, we estimate the strength of adhesion by conducting atomistic scale classical molecular dynamics (MD) of lipids on gold, silica and titania surfaces. In the second section, details of coarse-grained (CG) simulations of cylinders, spheres and cubes with sizes comparable to the bilayer thickness are discussed and used to determine appropriate modifications to the thin film model so that it may be applied to membranes of finite thickness wrapping spherical and cylindrical particles.
2. Methods
The simulations described here were performed using GROMACS software version 5.1.2 and later. Atomistic simulations utilised the leap-frog integrator with a 2 fs time step, Nose–Hoover thermostat with 5 ps time constant and anisotropic Parrinello-Rahman barostat with 10 ps time constant. CG simulations were conducted with the stochastic dynamics integrator with a 5 fs time step, and 1 fs inverse friction constant. Electrostatics were calculated with a Particle Mesh Ewald (PME) summation. Error estimates were obtained by block averaging unless stated otherwise.
2.1 Adhesion strength
The change in free energy per unit area upon the adhesion of a bilayer from solution onto a surface is here referred to as the adhesion strength. It may also be considered as the force per unit length required to prevent a semi-adsorbed bilayer ribbon (as depicted in ) from further adhesion. The constraint force, F, required to keep the end of the ribbon at a distance h above the surface is monitored during the simulation. The constraint force is related to the adhesion strength by [Citation32]
(1)
(1) where dA is the increase in the area of the adsorbed bilayer resulting from a reduction in the restraint height by
. The adhesion strength, as a change in free energy, is negative when adhesion is spontaneous. The ratio
is the product of twice the inverse of the area per lipid in the supported lipid bilayer, and the inverse of
, where n is the number of lipids in the free section of the bilayer. The ratio
is estimated from the one-dimensional lipid number density profile perpendicular to the surface at the point where the magnitude of the gradient is at the minimum. Note that the adhesion strength can be expected to be independent of the restraint height as long as the length of the ribbon is sufficient to ensure that at least some portion of the adhering ribbon is representative of the ‘bulk’ adhesion density i.e. is not affected by proximity to the edges. Equation (1) relates macroscale quantities to the adhesion strength, which is determined by interactions at the molecular level.
Figure 1. (colour online) Top and side views of a lipid ribbon adsorbed on the rutile 100 surface. Water is omitted for clarity.
The DMPC lipids comprising the bilayer ribbons were modelled using the fully atomistic 118 site Slipids forcefield which was developed [Citation29–31] for use in conjunction with TIP3P water. This system was shown to reproduce many experimentally observed properties of bilayers such as the lipid specific area and volume, bilayer thickness, isothermal area compressibility and NMR order parameters and scattering form factors. We have previously demonstrated that the use of this lipid force field in conjunction with substrate surface force fields that were also optimised using TIP3P water produces a reasonably accurate estimate of the adhesion strength [Citation32].
Surface slabs were constructed with surface dimensions of approximately 30 by 4 nm. Equilibrated bilayer ribbons were then brought into contact with the slab surface. The edges of the ribbon were maintained at a distance of 8 nm from the surface using the GROMACS pull code with a harmonic constraint with a force constant of 10 kJ.mol−1.nm−2. A total of 18 lipids comprised the pull group at each edge of the ribbon. The distribution of lipids in the ribbon was maintained at equilibrium by periodically updating the lipids in the pull group at 0.5 ns intervals. The simulation was halted, and lipids were reassigned to the pull groups based on the position of the head groups. Those lipids with phosphorous sites furthest from the solid were assigned to the pull groups, allowing individual lipids to migrate around the ribbon edge and maintain equal tension in both leaflets. More details on this procedure can be found in our previous paper [Citation32].
We have used this method to calculate adhesion strengths for DMPC bilayers on planar surfaces of gold [Citation32], silica [Citation33] and titania [Citation34] (see ) as well as mixed lipid membranes with and without cholesterol for gold.
2.2 Coarse grain model
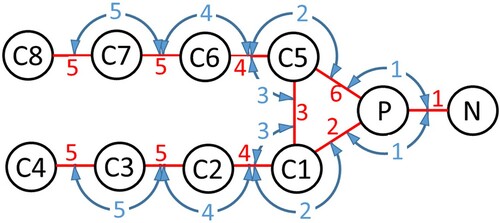
DMPC lipids were modelled using a 10-bead implicit solvent model optimised using MAGIC software [Citation35] to reproduce radial distribution functions generated from atomistic classical MD bilayer simulations. A schematic diagram of the model is shown in . Note that there are 4 different types of bead, C1 and C5 being of the same type.
Figure 2. (colour online) Schematic of the CG DMPC lipid. Beads are shown as black circles, harmonic bonds are shown as red lines and blue arrows indicate harmonic angles.
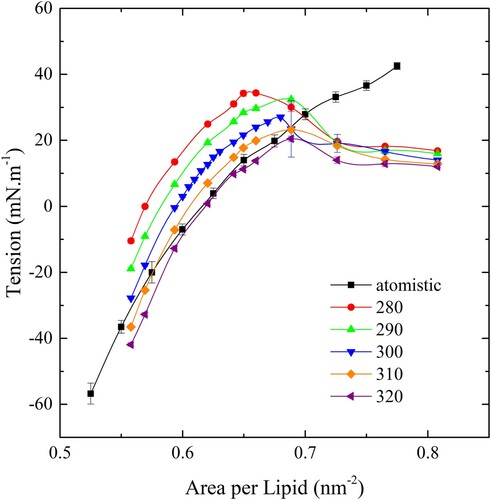
The CG bilayer elastic modulus was determined from a series of fully periodic simulations where the number of lipids was fixed and the area per lipid (ApL) was varied by scaling the lateral dimensions of the simulation cell. The tension in the bilayer was measured in each simulation and plotted against ApL for a range of different temperatures.
In the elastic behaviour of the atomistic model is shown in black. The elastic modulus is determined by the slope of the curve at zero tension and the rupture tension is determined from the maximum tension. For the atomistic module, the rupture tension is approximately 45 mN.m−1, but rupture tensions for the CG model are lower – especially for higher temperatures. However, at lower temperatures, the ApL at zero tension is significantly less than that of the atomistic model. Therefore, we chose to simulate the CG bilayer at 300 K where the rupture tension is approximately 25 mN.m−1. This value for the rupture tension is at the upper end of the range of reported empirical values for model membranes [Citation36].
Figure 3. (colour online) Membrane tension as a function of ApL for the CG bilayer over a range of temperatures. The black line indicates the behaviour of the atomistic bilayer.
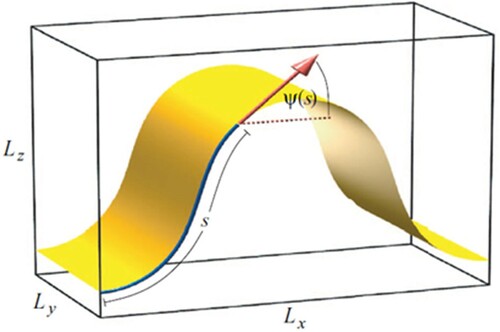
The CG bilayer bending modulus was estimated by actively deforming the lipid bilayer and measuring the curvature and restorative forces [Citation37]. A schematic of the simulation cell is shown in .
Figure 4. (colour online) An illustration of the buckled membrane, where and
are the dimensions of the simulation cell,
is the coordinate measured along the membrane, and
is the angle between the tangent to the membrane and the x-axis.
The equation connecting the restorative force in the -direction,
, the bending strain,
and the bending modulus,
, is given by:
(2)
(2) where
is the length of the simulation cell in the
-direction,
is the length of the membrane and
are the series coefficients given in Ref [Citation37]. The bending strain,
, is defined as the proportion by which the projected length of the membrane is reduced by the buckling:
(3)
(3)
Plots of against
are shown in for a range of temperatures along with fits to Equation (2). The general trend of
is to slightly increase with greater strain with only a weak dependence, which follows from the definition of
in Equation (2). While the slope of the fit does not significantly change with
, the y-intercept does. It can be explained by expanding Equation (2) when
,
vanishes and leaves a constant term containing
. A change in
can proportionally affect the constant term, which equals the
-intercept, but the terms with higher power of
are insignificant as
, so the slope does not change significantly. Consequently, we can directly estimate the bending modulus by inspecting the y-intercept.
Figure 5. (colour online) Plots of restorative bending forces in the x-direction against bending strain with fits to Equation (2) shown by the dashed line.
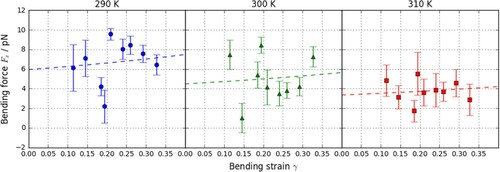
As might be expected intuitively, the bending modulus decreases with temperature. At 300 K the CG bending modulus is 3.6 ± 0.6 × 10⁻²⁰ J. Although significantly less than the published value [Citation38] of 11 × 10−20 J for the bending modulus determined from atomistic simulations, it is of the same order of magnitude and therefore suitable for our purposes.
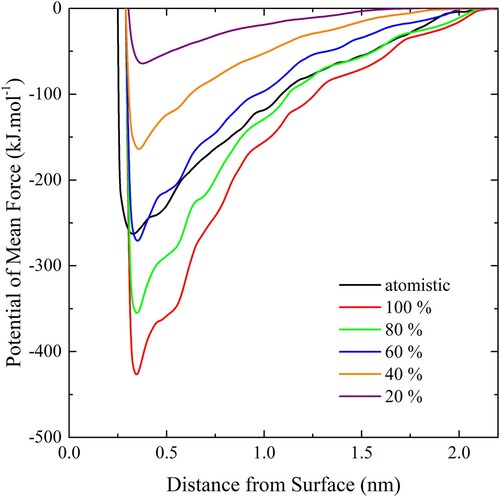
Next, potential of mean force (PMF) simulations were conducted for atomistic models of each of the four types of CG bead interacting with a gold slab in a vacuum. The PMF curves were fitted with the 10-4-3 Steele potential to obtain the effective value of the LJ potential for each bead when interacting with the substrate atoms. These values were then used in conjunction with the LJ well depth,
, generated from Lorenz-Bertholet mixing rules using the gold–gold and bead-bead well depth values to generate a PMF curve for a CG lipid interacting with the substrate. This was repeated; each time scaling the
values by a different factor. The results, shown in , indicate that when the
values are scaled by 60% the implicit solvent CG model approximates well the explicit solvent atomistic PMF for a DMPC lipid on gold.
Figure 6. (colour online) PMF curves for a CG lipid interacting with an atomistic slab. The black line denoted the PMF for an atomistic lipid and a gold slab in water.
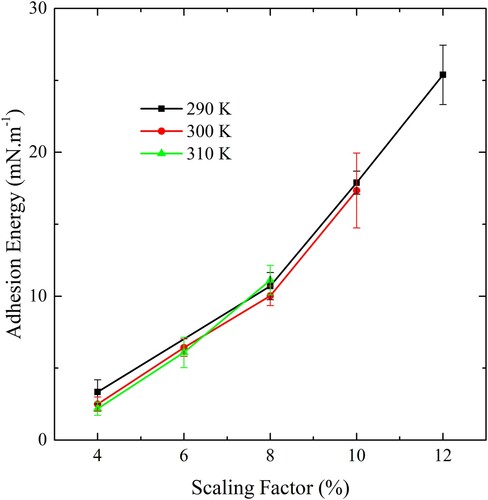
Next, adhesion strength measurements were performed against the slab with a CG bilayer using the ribbon geometry, varying both the scaling factor and the temperature. The results are shown in . The upper limit on the adhesion strength measurable for a given temperature is set by the rupture tension identified in . Within these limits, any desired adhesion strength can be selected by choosing the appropriate scaling factor. The gold lattice forming the substrate can be used to model particles of any shape and size.
Figure 7. (colour online) The adhesion strength of CG bilayers on the slab using a range of scaling factors and temperatures.
2.3 Wrapping of a sphere
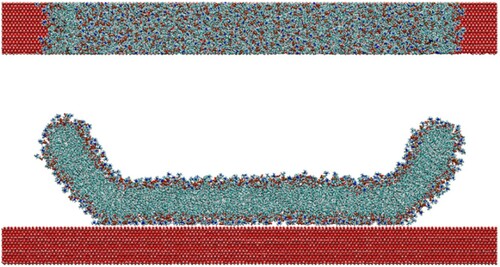
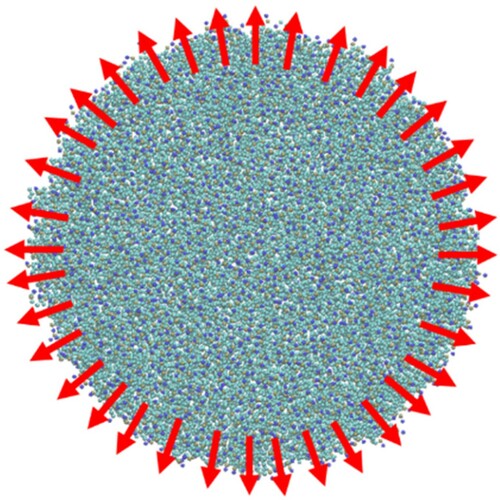
Simulations of spherical particle wrapping were conducted using CG lipid bilayers in a disk configuration. In a 2-dimensional analogue of the 1-dimensional ribbon, tension is maintained in the disk by identifying a series of pull groups around the disk perimeter, each consisting of approximately 18 lipids. Unidirectional restraining potentials are applied to maintain a minimum distance between the pull groups and the centre of the disk. The simulation geometry is illustrated in .
Figure 8. (colour online) Snapshot of a CG bilayer in the disk configuration. Red arrows show the force acting on the pull groups. The disk contains 2400 CG lipids and the disk is 30 nm in diameter.
The instantaneous tension in the disk can be easily determined by the sum of the restraining forces acting on each peripheral pull group divided by the perimeter of the disk. The dependence of the disk tension on the ApL was determined by varying the restraint distance between the centre and the pull groups. shows this dependence, depicted by red points, along with the dependence measured in a fully periodic simulation cell. At greater tensions the agreement is close, however, there is a divergence as the tension vanishes. The reason for the difference is that when the ApL gets close to zero the infinite plane system experiences negative tension or compression as the ApL fluctuates which serves to give a lower tension at a given ApL, whereas the disk does not go into compression. Since the disk is the geometry in the wrapping simulations this is the appropriate dependence to use for our analysis. In the case of a liposome, it will presumably not go into compression either, as it can rather deform to a non spherical shape. In principle, if the planar simulation cell was large enough it could deform as well, so compression can be viewed as an artefact of the cell size ().
Figure 9. (colour online) The dependence of the membrane tension on ApL. The tension measured in the disk geometry is shown in red and the fit illustrated by the green line. The black symbols show the dependence generated using a fully periodic bilayer.
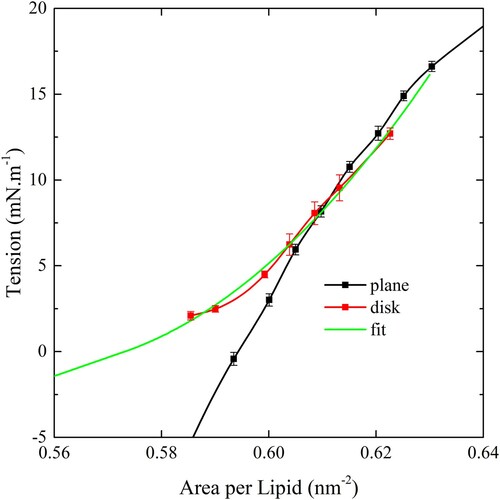
Figure 10. (colour online) Top and side views of a 10 nm particle undergoing wrapping by a CG bilayer in the disk geometry. Red arrows show the direction of restraining potentials. Note that not all the peripheral position restraints are shown in the side view.
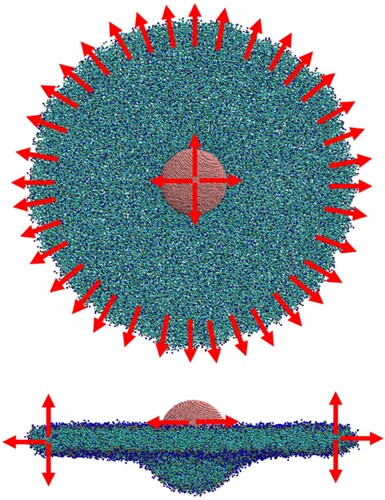
Spheres were cut from a gold lattice and placed at the centre of the disk. Harmonic constraints maintained the particle on the central axis running perpendicular to the disk during the wrapping process. In addition to the restraints on the peripheral pull groups maintaining the lateral distance from the central axis, additional constraints acting along the direction of the central axis maintained the pull groups at a fixed reference position to ensure the edge of the disk remained flat.
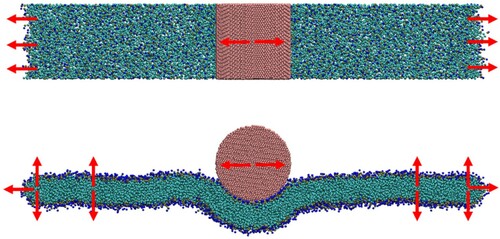
2.4. Wrapping of a cylinder
Simulations of cylindrical particle wrapping were conducted using the ribbon configuration, so that in effect, the cylinders were infinite in length. Snapshots of the configuration are shown in including the direction of action of the position restraints. The width of the simulation cell in the direction of the cylinder axis was 10 nm, and three restraints were used to maintain tension at each end of the ribbon, maintaining a minimum distance between the edge and the cylinder axis. In addition, the edges were restrained to maintain a constant vertical position and a further two restraints were added 5 nm from the edge to ensure the edges remained flat. Finally, a restraint maintained the cylinder in the centre of the ribbon.
Figure 11. (colour online) Top and side views of a 10 nm cylinder undergoing wrapping by a CG bilayer in the ribbon geometry. Red arrows show the direction of restraining potentials.
2.5. Thin film theory
A theoretical description of a spherical particle adhering to a flat, infinitesimally thin elastic membrane was provided by Deserno [Citation18]. taken from his paper, depicts the situation. The degree of wrapping of the particle is defined by the value of , which is equal to
, where
is the angle, measured around the particle centre, between the point where the free membrane meets the particle surface and the point on the particle surface of maximum penetration. The profile of the free membrane is captured by the angle,
, formed between the tangent to the membrane and the limiting flat membrane surface, defined as a function of distance along the membrane profile.
Figure 12. (colour online) Illustration of the wrapping geometry and membrane parametrization. An asymptotically flat membrane adheres partially to a spherical colloid of radius a with a degree of wrapping given by . Cylindrical symmetry around the
axis is assumed. Figure reproduced from Ref [Citation19].
![Figure 12. (colour online) Illustration of the wrapping geometry and membrane parametrization. An asymptotically flat membrane adheres partially to a spherical colloid of radius a with a degree of wrapping given by z=1−cosα. Cylindrical symmetry around the eh axis is assumed. Figure reproduced from Ref [Citation19].](/cms/asset/06a5dd53-dc1b-4c8a-9f43-961cac274459/gmos_a_1996574_f0012_ob.jpg)
Deserno considers wrapping under constant membrane tension. In our simulation geometry, the distance is fixed. It follows that the total area of the membrane,
, is given by:
(4)
(4) where
is the particle radius,
is the radial distance and
is the arc length. The first term in Equation (4) represents the area in contact with the particle and the second term represents the area of the free membrane.
The tension and bending modulus
can be used to define a characteristic membrane length
(5)
(5)
When the length scale is smaller than the bending energy dominates the energy balance while at larger length scales tension dominates. A particle will only adhere to a membrane when the contact energy
is sufficient to meet the energy cost of bending the membrane around the surface of the particle. This suggests we define a new shape-dependent term that combines the contact energy and bending cost, that for a sphere is written as
(6)
(6)
Since a particle will adhere to a membrane when , we can define a critical radius,
which denotes the minimum particle size for which adhesion will occur.
For a given value of , the total energy of the system,
, is given by:
(7)
(7)
Here, the first term represents the adhesion energy less the bending energy associated with the adhering portion of the membrane, the second term the tension energy associated with the increase in area due to membrane deformation and the third the bending energy in the free part of the membrane. Note that here the tension, , is a function of the penetration depth,
, since we have a fixed number of lipid molecules in our system that are spread over an increasing area as the membrane is deformed by the particle.
For a given value of , the equilibrium degree of wrapping occurs when:
(8)
(8)
For each value of , the tension and profile shape can be determined by minimising
(9)
(9)
subject to the requirement that:
(10)
(10) where the dependence of the membrane tension on the ApL has been determined from simulation. The data used to determine this dependence are displayed in . The profile shape and tension determined by minimisation of Equation (9) can be compared to our simulation results to gauge the predictive capacity of the theory.
In the case of an infinitesimally thin membrane wrapping a cylinder we can write the following equation for which combines the contact energy and bending energy for the part of the membrane adhering to a cylinder:
(11)
(11) where
is now the radius of the cylinder.
The energy equation for cylinder wrapping by an asymptotically flat membrane [Citation39,Citation40] is
(12)
(12) where
is the length of the cylinder. Similar to Equation (7), the first term represents the adhesion less bending energy of the adhering part of the membrane, the second term the tension energy due to membrane expansion and the third term the bending energy of the free membrane.
The profile can be calculated for a given value of from
(13)
(13)
With the curvature given by
(14)
(14)
2.6. Extension of thin film theory to bilayers
Thin film theory is extended to bilayer wrapping by assuming that the bilayer behaves the same as a thin film acting through the bilayer midplane. Since the thickness of a free bilayer is approximately 4 nm, this means that the wrapping radius, , is equal to the nominal radius plus 2 nm. In addition, it is necessary to adjust the contact energy, w, since it is now dependent on the particle curvature. So we apply the following definitions:
(15)
(15) and
(16)
(16) where the subscript SLB denotes a supported lipid bilayer and its application recognises that the bending constant may differ from that of a free bilayer. The contact energy w given in Equations (6) and (11) has been replaced by a pair of second-order polynomial functions of the effective wrapping radius, a, where the intercept at vanishing curvature is the flat surface adhesion strength measured in simulation,
. A series of coarse-grained simulations of both cylindrical and spherical particle wrapping in geometries, where
and a are known, were conducted to determine the relevant effective adhesion strengths. Then Equations (15) and (16) were applied simultaneously to determine values for the fitting parameters
and
. In the case of an infinitesimally thin membrane we would expect the former to be zero and the latter to be equal to the bending modulus.
In the cylindrical geometry can be measured directly by applying restraints to maintain the ends of the ribbon a minimum distance from the centre of the cylinder. In this case, there is no bending energy in the free part of the bilayer and so the tension in the membrane is equal to the effective adhesion strength. Therefore, simply dividing the restraining force by the width of the ribbon yields
. The simulation geometry is illustrated in .
Figure 13. (colour online) Snapshot showing the simulation geometry for determination of in the case of cylinder wrapping. The harmonic potentials are applied between the central axis of the cylinder and each end of the ribbon.
In the spherical geometry, cannot be determined directly in any analogous manner, so must be estimated by fitting the thin film model to the wrapping data. This involves simultaneously minimising Equation (9) over a series of penetration depths (generated by varying the disk radius, R, a simulation parameter). We have chosen to fit the dependence of the membrane tension on the disk radius, R, both readily determined from the simulations, but could have also used the penetration depth or the membrane profile in place of the latter.
3. Results
3.1 Adhesion strength
The results of the adhesion simulations are recorded in , data taken from previously published work for DMPC on gold [Citation32], silica [Citation33] and titania [Citation34]. By far the greatest adhesion strength was recorded on the gold surface. For this material, a reliable experimental value has been determined from chronocoulometry measurements with a gold electrode [Citation41]. Integration of the difference between charge density curves in the presence and the absence of an adhering bilayer, respectively, yields a value of −40 mN.m−1 for . The value reported in the table was achieved by calibrating the gold-lipid interaction; scaling by a factor of 0.95 the LJ well depth of each individual pair potential. The adhesion enthalpy per unit area,
, here was estimated from the system enthalpy measured with one of the ribbon edges restrained at a range of distances from the surface, effectively a direct measurement of the enthalpy change with respect to adhesion area. The entropic contribution to adhesion per unit area,
, can be inferred from
and
via the Gibbs free energy equation. In the case of gold adhesion, the entropic contribution opposes adhesion, which may be intuitively expected on the basis of the reduction of freedom of movement of the adhering bilayer. The adhesion enthalpy, in principle, provides a route to calibration of the interaction potentials against empirical data through calorimetry measurements of adhesion processes (see Ref [Citation49]).
The ApL of the adhering bilayer, in general, reflects the adhesion energy, and the greatest ApL is indeed observed on the gold surface. In fact, the ApL closely matches that of a free bilayer under a tension equal to the measured value of , which can be understood to mean that the gold surface is smooth at the molecular level. The separation is measured along the surface normal between the mean position of superficial atoms and the mean position of the head group atoms in the adhering leaflet. In a similar fashion, the bilayer thickness is measured along the surface normal between the mean position of the head group atoms in each leaflet. It should be noted that this definition does not allow direct comparison [Citation33] with empirical values such as those obtained from small-angle neutron scattering, but has a straightforward application here in that it allows a comparison to be made between the different surfaces in this study.
Silica surfaces subjected to adhesion simulations were modelled with silanols with the exception of the Q4 surface which had only siloxane bridges. Varying fractions (0%, 9% and 18%) of these silanol groups were ionised. In practice this means that the hydrogen site is removed from silanol group and replaced by a solvated Na counterion. The point of zero charge for silica (pzc) is roughly pH 2, and the fraction of ionised silanols increases as the pH increases, generally to about 12% at pH 7 [Citation42].
The greatest adhesion strength, −7.5 mN.m−1 was registered on the amorphous surface at 0% ionisation, where the entropic contribution appeared to oppose adhesion. The effect of ionisation was to reduce the adhesion strength to −5.3 mN.m−1 at 9% ionisation and further to −4.3 mN.m−1 at 18% ionisation where the entropic contribution now drove adhesion. The quartz surface had a relatively low adhesion strength of −2.1 mN.m−1 at 0% ionisation which did not change significantly at 9% ionisation, both cases entropically driven. However, at 18% ionisation no adhesion occurred at all. In contrast, the adhesion on the cristobalite surface increased from −3.2 to −4.4 mN.m−1 upon 9% ionisation, then decreased at 18% ionisation to −2.4. Each degree of ionisation on this surface appeared entropically driven, especially at 9% ionisation. With silanols replaced by siloxane bridges the same surface, now hydrophilic, registered an entropically opposed adhesion strength of only −4 mN.m−1. It appears that the only direct measurement of the adhesion strength of DMPC lipid bilayers on silica surfaces reported in the literature was performed by Anderson et al [Citation43] using a surface force apparatus. The adhesion strength was −0.5 mN.m−1 with vesicle fusion bilayers and −1 mN.m−1 with bilayers formed by Langmuir–Blodgett deposition.
Although bilayers spontaneously adhered to all the titania surfaces there was a marked amount of variation in the magnitude of the adhesion strength. The adhesion was particularly strong on the rutile 101 and anatase 110 surfaces at -4.0 mN.m-1 with rutile 100 registering −3.6 mN.m-1. The rutile 001 and anatase 001 surfaces, on the other hand, exhibited relatively weak adhesion with values of only -0.3 and -0.6 mN.m-1, respectively. Curiously, the entropic contribution appeared to oppose adhesion on the anatase surfaces but to drive adhesion on the rutile surfaces.
In general, the ApL of the adhering bilayer was a reasonably accurate predictor of the adhesion strength, and estimation of this property could feasibly be employed to offer a less computationally expensive method of gauging the adhesion strength, although the manual labour required to set up the simulation is the much the same as that for the adhesion measurement used here. The thickness is a less accurate predictor and the separation even worse.
These data are for pure membranes of DMPC. However we have also simulated [Citation44] a mixed membrane containing 50% 1-palmitoyl-2-oleoyl-glycero-3-phosphocholine (POPC), 25% 1,2-Dioleoyl-glycero-3-phosphoethanolamine (DOPE), 15% Bis(monoacylglycero)phosphate (BMP) [Citation45], and 10% sphingomyelin (n=18) with and without cholesterol (in equal molar quantities to POPC when present) in contact with a gold surface. As can be seen from , the adhesion strength on gold is the same as for DMPC within the error, indicating that the choice of lipid in a liposome may not be a determining factor in particle wrapping and the results in may be applicable more generally. Note however that the adhesion behaviours changes radically on the addition of cholesterol. The adhesion strength halving, so that liposomes with cholesterol will be much more difficult to penetrate, however at ∼20 adhesion strength is sufficient to ensure that no particle is too small to adhere (section 3.2); gold particles will always attach to the liposome even with cholesterol present.
3.2 Extension of thin film theory to bilayers
The process by which a CG bilayer disk wraps spherical particles is captured in . Particles of diameter 6, 10 and 15 nm were used, with a scaling factor of 8% for the particle-lipid interaction corresponding to a value of −10 mN.m−1 for . The pull groups at the periphery of the disk were restrained at a fixed distance,
, from the centre while the particle was introduced. The distance along the disk normal between the peripheral pull groups and the particle centre, the penetration depth, d, was monitored, as was the membrane tension determined by the restraint force on the peripheral pull groups. Once the system has equilibrated and these properties have been established,
is decreased and the and the system once again allowed to equilibrate. Note that as the particle is increasingly wrapped the penetration depth becomes more negative.
Figure 14. (colour online) Membrane tension as a function of penetration depth for wrapping of spherical particles by a CG bilayer in the disk geometry. Dashed lines show the relation between tension and penetration depth with ws given by Equation (6) and solid lines are fits with ws allowed to vary according to Equation (15). Red lines correspond to a spherical particle 15 nm in diameter, blue 10 nm and green 6 nm.
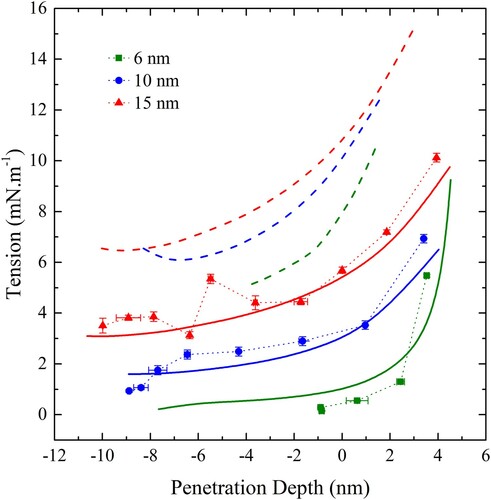
The dashed lines in show the application of the modified thin film theory outlined in the methodology using the measured membrane elasticity and bending moduli and using the form of Equation (6) for with the measured value of
i.e. 10 mN.m−1. The radius was taken to be the nominal particle radius plus half the bilayer width (2 nm). In other words, the bilayer was modelled as a thin elastic sheet acting through the centre of the bilayer. Clearly, the theory predicts much higher tensions than were observed in simulation. Intuitively, two reasons for this discrepancy arising from the assumption of the infinitesimally thin film assumption suggest themselves. The first is that
is not necessarily equal to –
when the membrane thickness is finite and secondly the bending modulus of the adhering portion of the bilayer is not necessarily the same as that of a free bilayer.
Next, the theory was applied with allowed to vary as a fitting parameter. The resulting fits are shown as solid lines in . Note that the optimisation was performed on the dependence of membrane tension on disk radius, and the penetration depth was only calculated once the full profile had been determined.
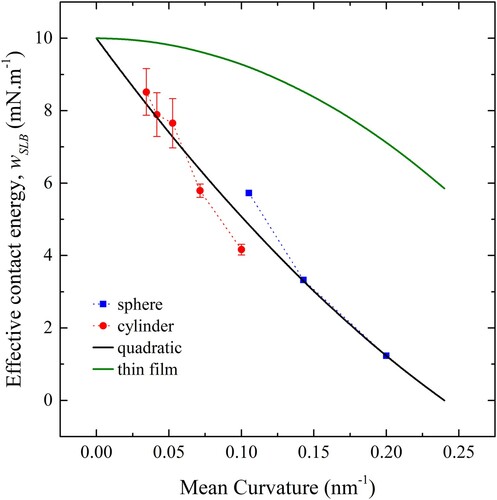
The parameter was also determined for cylinders of 6, 10, 15, 20 and 25 nm diameter using the simulation geometry depicted in .
In , the values of (for both cylinders and spheres) are plotted against mean curvature in orange for cylinders and for spheres in blue. A quadratic fit is also shown in black. The intercept is fixed at 10 mN.m−1, the measured value of
ensuring that in the limit of vanishing curvature the flat surface adhesion strength is recovered. The value for
is −5.46 × 10⁻¹¹ N and
is equal to −2.71 × 10⁻²⁰ J. Also shown in green is the effective adhesion strength of an ideal membrane of vanishing thickness where
is equal to zero and
equal to the negative of the measured free membrane bending modulus.
Figure 15. (colour online) The effective contact energy, , as a function of curvature. Blue points denote spheres and orange points denote cylinders. The black line is a quadratic fit to both sets of data and the green line is the prediction for an infinitesimally thin film with bending modulus equal to that of a free membrane.
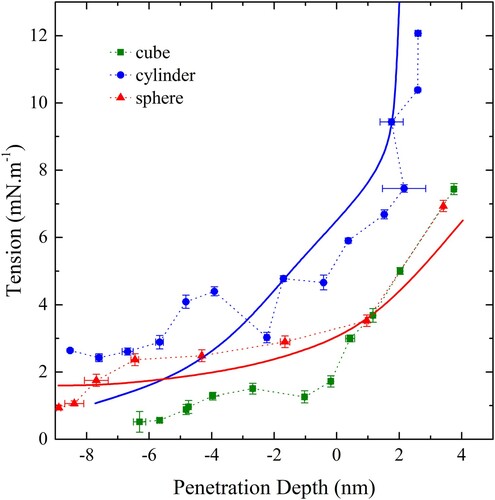
In the wrapping behaviour of a sphere, cylinder and cube are shown. The sphere is 10 nm in diameter while the cylinder has a cross-sectional diameter of 10 nm and is effectively infinite in length. The cube is a Hauser cube with a side length of 10 nm, similar to that used by Dasgupta et al [Citation46]. The behaviour predicted by thin film theory is also shown for the sphere and cylinder. Cube wrapping was performed with the same simulation geometry as the sphere.
Figure 16. (colour online) Tension vs penetration depth for a sphere (red), cylinder (blue) and cube (green) 10 nm in diameter. Solid lines show predictions from theory, using modified values of .
3.3 Prediction of wrapping behaviour
A particle of a given material will adhere to a membrane as long as is positive. Equivalently, a particle will adhere if the particle size is greater than a critical diameter. For an ideal membrane of vanishing thickness, the ratio between the critical diameter for a cylinder and a sphere of the same material is 4. However, using the modified expressions for the effective adhesion strength is no longer necessarily the case (see Equations (15) and (16)). In we list estimates, made using the modified form of the effective adhesion strength, of the critical diameter for materials in this study. In the case of titania, values are listed for the spherical and cylindrical case for each polymorph which combine the adhesion strengths measured on the different cleavage planes listed in . The adhesion strength for spherical particles was calculated by taking the weighted average of adhesion strength across all four cleavage planes, where the weighting was according to the inverse of the surface energy for the plane, as calculated from DFT simulations [Citation47]. A similar procedure was followed for the cylindrical case, except that the 110 plane was excluded. Note that all the other planes are perpendicular to the b2 lattice vector and can thus in combination can form a low surface energy cylinder.
Table 2. Predicted critical diameters for a range of materials for both cylindrical and spherical particles using the modified formulae for finite thickness membranes.
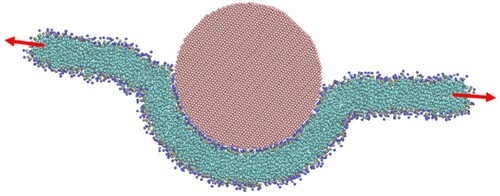
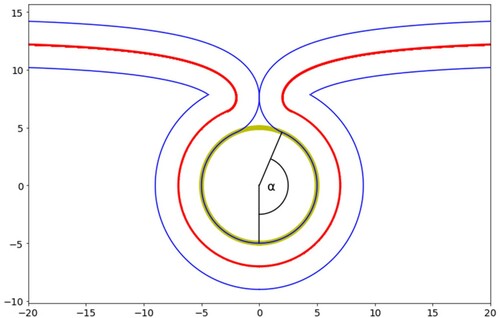
According to thin film theory, if the membrane remains tensionless a particle will be completely wrapped if it exceeds the critical diameter. The outer membranes of many cells have lipid reservoirs that serve to regulate the tension, in contrast, when a particle interacts with a liposome or a simple cell, such as a red blood cell, there are no such cellular mechanisms and the tension may rise as the membrane is deformed, particularly when the particle is large compared to the liposome or when many particles interact simultaneously [Citation48]. If the tension rises significantly it may halt the wrapping process before completion. Note that wrapping is defined to be complete when the free part of the membrane makes contact with itself and that this typically occurs when the angle is less than 180°, since the contact occurs at the inflection point on the membrane rather than the surface. With membranes of finite thickness, the angle at complete wrapping is less than the thin film model, as illustrated in . Note that that the outer edges of the bilayer, shown in blue, are in contact while the midplane, in red, equivalent to the thin film model, is not.
Figure 17. (colour online) Illustration of the finite membrane model showing a cross section schematic of a complete wrapped spherical particle. The particle, 20 nm in diameter, is shown in yellow, the midplane of the bilayer is red and the hydrophilic surfaces of the bilayer are blue.
Applying this criterion, the maximum tension at which complete wrapping can occur can be calculated. For a given tension, the total energy of the system was calculated as a function of the wrapping angle, α. The energy comprises the contact energy which drives the wrapping process and the bending and tension energy components of the free membrane which opposes it. In the case of spherical particles, the free membrane profile was solved numerically following the procedure detailed in Ref [Citation18]. For a given tension, if there exists a local minimum in the energy profile at a value of the wrapping angle that is less than that required to complete wrapping, as illustrated by , then the tension is deemed too great to allow complete wrapping. The maximum tension for complete wrapping is the greatest tension at which the local minimum in the total energy as a function of wrapping angle is equal to or greater than the angle for complete wrapping. The membrane profile around cylindrical particles can be determined analytically [Citation39] and the resulting energy dependence on the wrapping angle is monotonic, therefore the maximum tension increases monotonically with cylinder diameter.
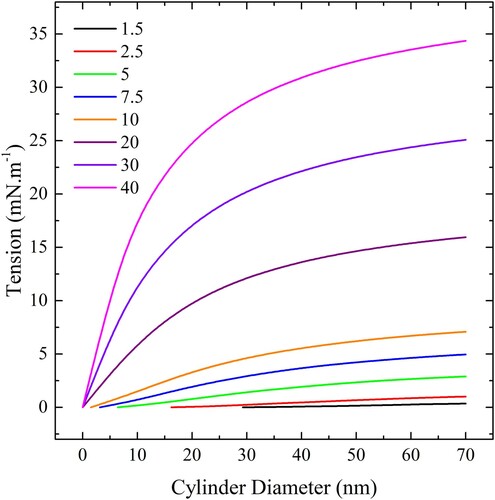
This is displayed in as a function of cylinder diameter for a range of adhesion strengths spanning those of the materials in this study. For a cylinder of given diameter, complete wrapping will occur if the tension is below the curve for the corresponding adhesion strength. If the tension is above the curve partial wrapping will occur. If the particle diameter is less than the diameter corresponding to the left most part of the curve (the critical diameter, ) the cylinder will not adhere. The maximum tension increases monotonically with cylinder radius and with adhesion strength. Even at the adhesion strength of gold (40 mN.m−1) and large cylindrical radius, the maximum tension remains below the rupture tension (∼45 mN.m−1). At the critical diameter for a particular adhesion strength, any tension in the membrane will halt the wrapping process.
Figure 18. (colour online) The maximum tension for complete wrapping of cylindrical particles as a function of diameter for a range of adhesion strengths.
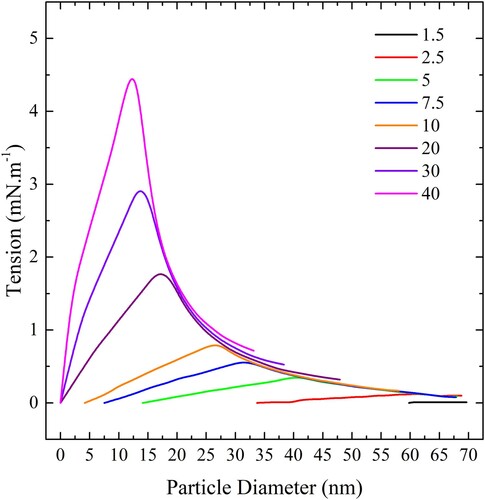
The situation for spherical particles is shown in . The maximum tensions for spheres are much lower than for cylinders of the same radius due to the greater particle curvature and consequently induced membrane curvature. There is also a local minimum in the free membrane energy dependence on wrapping angle that prevents complete wrapping from occurring when the tension is too large. The energy barrier is largely due to tension, rather than bending energy, and the maximum tension is determined by the tension at which this energy barrier disappears. As the tension is lowered past the maximum tension, it results in a discontinuous transition from partially wrapped to completely wrapped states. For example, If the tension is say 0.5 mN.m−1 and the diameter is 30 nm, then the sphere will completely wrap if the adhesion strength is 7.5 mN.m−1 or greater. If the adhesion strength is 5 mN.m−1 it will partially wrap and 2.5 or 1.5 mN.m−1 it will not adhere. Note that the maximum tension for a given will always be greater than that for a smaller
at the same diameter.
Figure 19. (colour online) The maximum tension for complete wrapping of spherical particles as a function of diameter for a range of adhesion strengths.
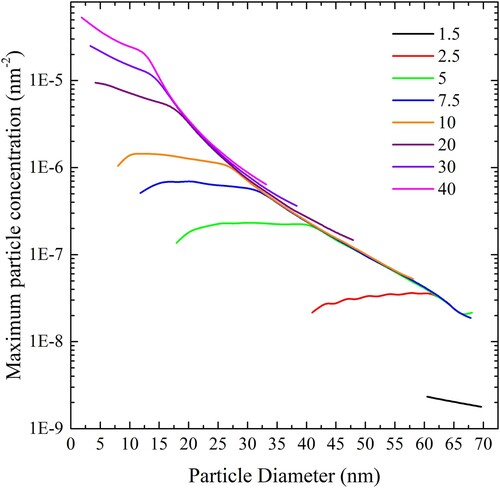
If we consider a system of liposomes in a solution of particles it is possible to use these data to determine a maximum particle surface concentration on the liposome for complete wrapping to occur. At greater particle concentrations only partial wrapping will occur as the membrane deformation induced by the particles will increase the tension beyond the maximum before complete wrapping can occur. Assume that initially, the liposomes are tensionless with an area per lipid which can be read from the atomistic simulation data shown in and that each particle consumes an area of bilayer equal to
at a tension equal to the maximum tension indicated in The ApL at the maximum tension
can also be estimated from the atomistic data and we can write the following equation for the maximum particle concentration
expressed in particles per square nm of the liposome surface:
(17)
(17)
The maximum particle concentration for complete wrapping of all nanoparticles at the liposome surface is plotted on a log scale in .
Figure 20. (colour online) Maximum spherical particle concentration, expressed in particles per square nm of bilayer, for complete wrapping over a range of values of adhesion strengths.
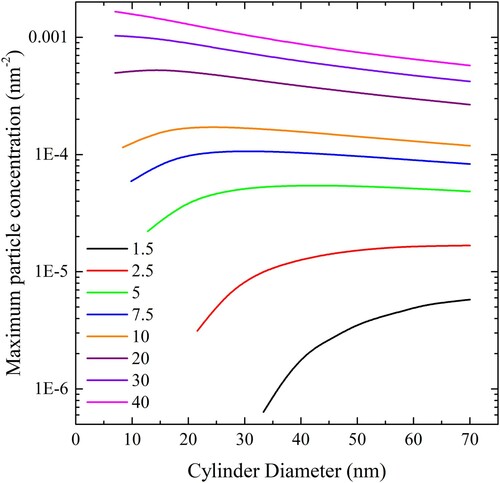
In the cylindrical case we can write a similar equation expressing the maximum particle concentration in terms of the length of cylinder per unit area of liposome surface:
(18)
(18)
Application of this equation results in . In this case, the length of cylinder per unit area that can be completely wrapped by a liposome increases with cylinder diameter at low adhesion strength and decreases at high adhesion strength.
Figure 21. (colour online) Maximum cylindrical particle concentration, expressed in length of cylinder per square nm of bilayer, for complete wrapping over a range of values of adhesion strengths.
4. Discussion
4.1 Adhesion strength
Adhesion strength is difficult to measure experimentally, which is why the ribbon geometry simulation, discussed above, is valuable. However, the estimate of adhesion strength is only as accurate as the classical force fields used. The Slipids forcefield for DMPC has been tested extensively and is shown to be a reliable predictor of many properties of free bilayers. That is, the lipid-lipid and lipid–water interactions have been finely tuned based on empirical data and DFT simulations. Likewise, the substrate models have been calibrated using empirical data for their interaction with water, such as adsorption enthalpy and water surface density profiles. However, the substrate-lipid interaction potentials are generated using mixing rules as few empirical data exist with which to calibrate the potentials.
In the case of gold, a reliable experimental measurement of adhesion strength does exist [Citation41]. The mixing rule generated interaction potential overestimated the adhesion strength by 25%. Calibration of the interaction potential against the empirical adhesion strength required scaling of the well-depth by 0.925. So, the data for the other surfaces which have been not been calibrated should probably be viewed as being accurate to within 25%. In theory, calibration data could be generated by DFT simulations, but there are severe limitations on the size and timescale accessible to such simulations. A single lipid interacting with the surface could be simulated using DFT although our simulations show that the single lipid adsorption strength is not a reliable predictor of adhesion strength. On the other hand, it may help to calibrate the individual atomic interactions. Attempts to generate calibration data with calorimetry measurements of particles interacting with vesicles have so far been beset with difficulties, and it is apparent that the adsorption enthalpies of the metal oxides in this study are too small to be measured reliably with current instruments [Citation49]. However, microscopy of gold nanoparticles in contact with liposomes display behaviours consistent with the analysis presented here [Citation49].
Simulations using the technique illustrated by show that there is considerable variation in adhesion strength for different cleavage planes of the materials considered in this study. In order to accurately model nanoparticles, it would be best if accurate experimental evidence of the structure of the particle surface were known. In the absence of such evidence it was assumed, in the case of titania, the adhesion energy of cylindrical and spherical particles was simply achieved by weighting according to the inverse of the surface energy of each respective cleavage plane. This approach is reminiscent of the Wolff construction approach, which generates a minimum surface energy crystal which is not necessarily circular in cross section. In such cases, the approach may be improved by using a modified form of the Wolff construction weighted to provide the desired particle morphology at a minimum surface energy. Intuitively, such an approach appears justified when the particle is formed in conditions close to the physiological environment in a process near to chemical equilibrium, say by crystallisation from solution. On the other hand, where the particle is formed in conditions far from equilibrium it may be that surfaces with altogether different structures may be favoured. Indeed, other groups [Citation24] have produced convincing evidence that anatase titania cylinders with diameters far below the critical diameter calculated here adhere to liposomes and even become fully wrapped.
4.2 Finite-thickness membranes
We have extended thin film theory, where the contact energy is curvature independent, to finite-thickness membranes simply by replacing the contact energy with an effective contact energy which is curvature dependent. The effective contact energy operates on the surface representing the bilayer midplane and is related to the weighted average adhesion strength described above by an empirically derived second-order polynomial function of curvature. There is no real theoretical basis for the modification, but one could possibly be developed based on microscopic considerations of the particle-bilayer interface. It should be noted that only one value of the adhesion strength has been utilised in simulations so far and it may well be that the parameters vary significantly with the adhesion strength.
In effect, the modification of thin film theory described here accounts for the difference in bending behaviour between infinitesimally thin films and films of finite thickness, but is only applied to the part of the bilayer adhering to the particle surface. The free bilayer is still treated like a thin film, acting through the midplane of the bilayer, in that the bending energy is curvature independent. For the larger particles at moderate degrees of wrapping this assumption appears reasonable, as the free bilayer curvature is modest. However, the free bilayer curvature around the 6 nm particle is rather high. Intuitively we might expect this assumption to break down here and indeed of all three particles sizes modelled the theoretical prediction of tension as a function of penetration is least accurate for the 6 nm particle. Even for larger particles, high degrees of curvature are expected near complete wrapping, as shown in , although complete wrapping is yet to be achieved in our simulations. Logically, the next step would be to incorporate a curvature-dependent bending energy penalty to the free part of the bilayer. This would serve to further limit the predicted uptake of smaller particles, which generate large degrees of curvature in the free bilayer near complete wrapping. Also implicit in our approach is the assumption that the free membrane is flat at large distances from the particle, an assumption that breaks down when the particle size is large in relation to the size of the liposome.
Nevertheless, having inferred the effective contact energy of curved surfaces from the tension of the free part of the bilayer during the initial stages of wrapping when the free bilayer is not highly curved, the modified adhesion strengths were used with thin film theory to predict a maximum tension which will halt the wrapping process before complete wrapping can occur. A simple particle-vesicle model, as described by Dietrich et al. [Citation50], was used to estimate how many particles can be engulfed before reaching this tension. This stage of the treatment could be made more rigorous by employing the approach of Deserno and Gelbert [Citation48] or many later continuum studies [Citation19–22] which incorporate a more accurate model of the nanoparticle-vesicle complex. The effectiveness of the overall approach can be tested against the predictions of maximum particle concentration in and by exposing particles of known adhesion strength at a varying concentration to liposomes and observing the extent of wrapping using an appropriate form of microscopy.
We now consider two applications of our model; predicting critical diameters, maximum membrane tension and nanoparticle concentrations at the maximum membrane tension.
4.3 Toxicology
As discussed in the introduction most toxicity pathways involve an uptake of nanoparticles by the cell, either via active endocytosis or by a passive process. The probability of uptake is determined by the nanoparticle physicochemical properties and by the interaction between the nanoparticle and the cell membrane. In the preceding sections, we described a mechanistic model of nanoparticle uptake by model cell membranes, the liposomes, and used simulations to predict the appropriate physical property data for a range of materials. Based on these calculations we can calculate critical sizes and concentrations for nanoparticle uptake allowing nanoparticles to be classified as either those that (a) penetrate the cell, (b) adhere to the cell or (c) do not adhere to the cell, if the nanoparticle exists in its native state at the point of contact (for the moment we do not have adhesion strength estimates for lipid membrane/protein corona interactions, while for citrate stabilised gold nanoparticles we assume the citrate is displaced by the membrane upon adhesion). Unlike liposomes, many cells maintain a plasma membrane reservoir [Citation51,Citation52] to buffer against changes in membrane tension so that changes in the membrane tension will not increase as particle wrapping proceeds. In this case, only the critical diameter can be used to predict nanoparticle uptake, as penetration of the cell membrane will not lead to tension-mediated inhibition of wrapping. The fact that cells have diameters in the range from ten to one hundred microns (blood cells, lymphocytes) and can also have locally planar surfaces (endothelial, muscle) means that the approximations made in Section 3 in describing the free energy effects of membrane curvature are likely to hold. In other words, the inherent cell curvature is generally small compared to the particle surface curvature.
Cases where the nanoparticles are covered in protein (this generally occurs in vivo but not necessarily in vitro) are not described by : our work needs to be extended through simulations of lipid membranes on corona proteins such as serum albumin. However, once through the plasma membrane nanoparticles with a protein corona will be taken up by lysosomes inside the cell and the protein removed in the acid environment of the lumen exposing the nanoparticle surface. In this regard, the adhesion strengths given in allow us to rank the nanoparticles with respect to the strength of the interaction with the lipids forming the inside of the lysosome (or more accurately the autolysosome) membrane. We can see that gold nanoparticles should interact strongly with these lipids, with potential for membrane disruption while silica and titania have a much weaker interaction indicating they may well not be able to disrupt the membrane, for example by lysosomal membrane permabilisation or rupture and release of lysosomal hydrolases from the lumen into the cytosol and subsequent toxic effects. Further work is required to extend our models to include the effect of membrane protein in the autolysosome, and since lysosomes typically have sub-micron diameters the effect of negative membrane curvature may also need to be taken into account.
4.4. Separations
Many techniques exist to isolate liposomes from the surrounding solution, such as centrifugation, chromatography or dialysis. The code can therefore be used to design separation processes where particles that adhere to liposomes can be separated from those that remain in solution. For spherical gold particles in contact with liposomes with and without cholesterol, the minimum predicted diameter for adhesion to a liposome is zero, which indicates that all gold nanoparticles are predicted to adhere, regardless of particle size. Hence any solution of fine spherical particles containing gold mixed with a non-gold species, the latter having particle diameters less than their critical diameter (as given in ), will separate into two components upon addition of a sufficient quantity of liposomes: gold enriched liposomes and a solution of non-gold particles. Upon centrifugation, for example, the gold (along with the lipids) will be isolated in the precipitate and the second species will remain in the supernatant.
In the absence of a strongly adhering species for which all particles will adhere independent of size i.e. the critical diameter is approximately zero (here gold), then a clear divide exists between those particles in solution with diameters less than the critical diameter and those with diameters greater than the critical diameter, the former not adhering to the liposomes while the latter will adhere. Thus it will be possible to separate, in a similar fashion, a solution of a single species of particle with a wide particle size distribution on the basis of particle size.
Separation could also be performed on the basis of shape. From it is clear that cylindrical particles have a smaller critical diameter than spherical particles of the same material. Thus a solution of cylindrical and spherical particles with the same diameter mixed with a liposome solution could be separated with rods adhering to liposomes and spheres in solution. Likewise, the adhesion strength is also dependent on the particular polymorph and surface cleavage plane and separation processes could be designed on this basis.
All the separation processes described thus far rely on the differentiation between adhering and non-adhering particles, as the techniques to isolate the liposomes will include any adhering particles. However, it may be desirable to differentiate between particles adhering to the outside of the liposome and particles fully engulfed. This may prove to be possible by altering the pH of the solution to lower the strength adhesion and thereby encourage the adhering particles to detach from liposomes. Then the usual liposome isolation techniques could be used to separate the two types of particles. At present, the adhesion strength dependency on pH has only been investigated for silica but future studies could generate more data.
5. Conclusions
Adhesion strength estimates based on atomistic classical molecular dynamics simulation for a variety of materials representing a range of strengths were presented. An extension to thin film theory was advanced that captures the wrapping behaviour of both cylindrical and spherical particles by bilayers of finite thickness, observed in coarse grain simulations, using a single pair of parameters. The flat surface adhesion strength is recovered in the limit of large particle radius. The modified theory was applied to generate diagrams that allow the prediction of the extent of wrapping based on adhesion strength, membrane tension and particle concentration and hence the classification of particles according to their ability to penetrate membranes. The results of Section 3 have been incorporated in the interpolation code Nanolip available from http://www.smartnanotox.eu/?page_id=143.
Acknowledgements
The coarse grain simulations measuring the membrane bending modulus were conducted by Jiahao Xu as part of his BSc in chemistry. We also thank the peer reviewers for their input which greatly enhanced the paper.
Supplementary material
An archive containing all input files required to run the simulations referred to in this paper including truncated output data is available here: http://dx.doi.org/10.5281/zenodo.4249707
Disclosure statement
No potential conflict of interest was reported by the author(s).
Correction Statement
This article has been corrected with minor changes. These changes do not impact the academic content of the article.
Additional information
Funding
References
- Sajid M, Ilyas M, Basheer C, et al. Impact of nanoparticles on human and environment: review of toxicity factors, exposures, control strategies, and future prospects. Environ Sci Pollut Res. 2015;22(6):4122–4143.
- Joris F, Manshian BB, Peynshaert K, et al. Assessing nanoparticle toxicity in cell-based assays: influence of cell culture parameters and optimized models for bridging the in vitro–in vivo gap. Chem Soc Rev. 2013;42(21):8339–8359.
- Lewinski N, Colvin V, Drezek R. Cytotoxicity of nanoparticles. Small. 2008;4(1):26–49.
- Yildirimer L, Thanh NTK, Loizidou M, et al. Toxicology and clinical potential of nanoparticles. Nano Today. 2011;6(6):585–607.
- Yamashita K, Yoshioka Y, Higashisaka K, et al. Silica and titanium dioxide nanoparticles cause pregnancy complications in mice. Nat Nanotechnol. 2011;6(5):321–328.
- Gottschalk F, Nowack B. The release of engineered nanomaterials to the environment. J Environ Monit. 2011;13(5):1145–1155.
- Nel A, Xia T, M€adler L, et al. Toxic potential of materials at the nanolevel. Science. 2006;311(5761):622–627.
- Rouse I, Power D, Brandt EG, et al. First principles characterisation of bio–nano interface. Phys Chem Chem Phys. 2021;23:13473–13482.
- http://smartnanotox.scientia.global/
- EU NanoSafety cluster – about the NanoSafety cluster. Available from: https://www.nanosafetycluster.eu/.
- Kettler K, Veltman K, van de Meent D, et al. Cellular uptake of nanoparticles as determined by particle properties, experimental conditions, and cell type. Environ Toxicol Chem. 2014;33:481–492.
- Michel R, Kesselman E, Plostica T, et al. Internalization of silica nanoparticles into fluid liposomes: formation of interesting hybrid colloids. Angew Chem Int Ed. 2014;53:12441–12445.
- Roiter Y, Ornatska M, Rammohan AR, et al. Interaction of nanoparticles with lipid membrane. Nano Lett. 2008;8:941–944.
- Tollefsen KE, Scholz S, Cronin MT, et al. Applying adverse outcome pathways (AOPs) to support integrated approaches to testing and assessment (IATA). Regul Toxicol Pharmacol. 2014;70:629–640.
- Bunderson-Schelvan M, Holian A, Hamilton RF. Engineered nanomaterial-induced lysosomal membrane permeabilization and anti-cathepsin agents. Null. 2017;20:230–248.
- Pavan C, Fubini B. Unveiling the variability of “quartz hazard” in light of recent toxicological findings. Chem Res Toxicol. 2017;30:469–485.
- Helfrich W. Elastic properties of lipid bilayers: theory and possible experiments. Zeitschrift für Naturforschung C. 1973;28:693–703.
- Deserno M. Elastic deformation of a fluid membrane upon colloid binding. Phys Rev E. 2004;69:031903.
- Bahrami AH, Lipowsky R, Weikl TR. The role of membrane curvature for the wrapping of nanoparticles. Soft Matter. 2016;12:581–587.
- Agudo-Canalejo J, Lipowsky R. Adhesive nanoparticles as local probes of membrane curvature. Nano Lett. 2015;15:7168–7173.
- Yu Q, Othman S, Dasgupta S, et al. Nanoparticle wrapping at small non-spherical vesicles: curvatures at play. Nanoscale. 2018;10:6445–6458.
- Spanke HT, Style RW, François-Martin C, et al. Wrapping of microparticles by floppy lipid vesicles. Phys Rev Lett. 2020;125:198102.
- Laradji M, Kumar PBS, Spangler EJ. Adhesion and aggregation of spherical nanoparticles on lipid membranes. Chem Phys Lipids. 2020;233:104989.
- Kokot H, Kokot B, Sebastijanović A, et al. Prediction of chronic inflammation for inhaled particles: the impact of material cycling and quarantining in the lung epithelium. Adv Mater. 2020;32:2003913.
- Nativo P, Prior IA, Brust M. Uptake and intracellular fate of surface-modified gold nanoparticles. ACS Nano. 2008;2:1639–1644.
- Contini C, Schneemilch M, Gaisford S, et al. Nanoparticle–membrane interactions. J Exp Nanosci. 2018;13:62–81.
- Spangler EJ, Upreti S, Laradji M. Partial wrapping and spontaneous endocytosis of spherical nanoparticles by tensionless lipid membranes. J Chem Phys. 2016;144:044901.
- van der Wel C, Vahid A, Šarić A, et al. Lipid membrane-mediated attraction between curvature inducing objects. Sci Rep. 2016;6:32825.
- Jämbeck JPM, Lyubartsev AP. Derivation and systematic validation of a refined All-Atom force field for phosphatidylcholine lipids. J Phys Chem B. 2012;116:3164–3179.
- Jämbeck JPM, Lyubartsev AP. An extension and further validation of an All-atomistic force field for Biological membranes. J Chem Theory Comput. 2012;8:2938–2948.
- Jämbeck JPM, Lyubartsev AP. Another piece of the membrane puzzle: extending Slipids further. J Chem Theory Comput. 2013;9:774–784.
- Schneemilch M, Quirke N. Free energy of adsorption of supported lipid bilayers from molecular dynamics simulation. Chem Phys Lett. 2016;664:199–204.
- Schneemilch M, Quirke N. Free energy of adhesion of lipid bilayers on silica surfaces. J Chem Phys. 2018;148:194704. Erratum, J Chem Phys. 2019;150:229901.
- Schneemilch M, Quirke N. Free energy of adhesion of lipid bilayers on titania surfaces. J Chem Phys. 2019;151:134707.
- Mirzoev A, Lyubartsev AP. Magic: software package for multiscale modeling. J Chem Theory Comput. 2013;9:1512–1520.
- Evans E, Heinrich V, Ludwig F, et al. Dynamic tension spectroscopy and strength of biomembranes. Biophys J. 2003;85:2342–2350.
- Hu M, Diggins P, Deserno M. Determining the bending modulus of a lipid membrane by simulating buckling. J Chem Phys. 2013;138:214110.
- Watson MC, Brandt EG, Welch PM, et al. Determining biomembrane bending rigidities from simulations of modest size. Phys Rev Lett. 2012.109.028102
- Müller M. Theoretical studies of fluid membrane mechanics [PhD thesis]. Mainz: Johannes Gutenberg-Universitat; 2007.
- Mkrtchyan S, Ing C, Chen JZY. Adhesion of cylindrical colloids to the surface of a membrane. Phys Rev E. 2010. 81.011904
- Bin X, Zawisza I, Goddard JD, et al. Electrochemical and PM-IRRAS studies of the effect of the static electric field on the structure of the DMPC bilayer supported at a Au(111) electrode surface. Langmuir. 2005;21:330–347.
- Emami FS, Puddu V, Berry RJ, et al. Force field and a surface model database for silica to simulate interfacial properties in atomic resolution. Chem Mater. 2014;26:2647–2658.
- Anderson TH, Min Y, Weirich KL, et al. Formation of supported bilayers on silica substrates. Langmuir. 2009;25:6997–7005.
- Schneemilch M, Quirke N. Unpublished data.
- Gallala HD, Sandhoff K. Biological function of the cellular lipid BMP—BMP as a key activator for cholesterol sorting and membrane digestion. Neurochem Res. 2011;36:1594–1600.
- Dasgupta S, Auth T, Gompper G. Shape and orientation matter for the cellular uptake of nonspherical particles. Nano Lett. 2014;14:687–693.
- Esch TR, Gadaczek I, Bredow T. Surface structures and thermodynamics of low-index of rutile, brookite and anatase – a comparative DFT study. Appl Surf Sci. 2014;288:275–287.
- Deserno M, Gelbart WM. Adhesion and wrapping in colloid−vesicle complexes. J Phys Chem B. 2002;106:5543–5552.
- Contini C, Hindley JW, Macdonald TJ, et al. Size dependency of gold nanoparticles interacting with model membranes. Commun Chem. 2020;3:130.
- Dietrich C, Angelova M, Pouligny B. Adhesion of latex spheres to giant phospholipid vesicles: statics and dynamics. J Phys II. 1997;7:1651–1682.
- Gauthier NC, Masters TA, Sheetz MP. Mechanical feedback between membrane tension and dynamics. Trends Cell Biol. 2012;22:527–535.
- Raucher D, Sheetz MP. Characteristics of a membrane reservoir buffering membrane tension. Biophys J. 1999;77:1992–2002.