
Abstract
To remain viable, agricultural producers will need to adapt to changing climatic conditions in coming decades. Agricultural advisers play an important role in helping producers decide to adopt appropriate adaptation practices. Photovisualizations have the potential to complement currently utilized outreach and education strategies. This research uses a focus group approach to explore (1) whether photovisualizations can aid in decision-making about climate change adaptation, and (2) what characteristics of photovisualizations are most effective at conveying spatial aspects of adaptation practices. We found that photovisualizations generate rich discussions about ecological and economic effects as well as tradeoffs associated with climate adaptation practices. To have the greatest impact, photovisualizations should be used when producers are considering implementing high-cost or high-risk projects, when practices are likely to dramatically change the visual landscape, or when a practice is unfamiliar to a producer.
In the coming decades, climate change will continue to alter the weather patterns that affect agricultural systems (Tubiello et al. Citation2008). Recent scholarship has examined the many factors that influence the willingness or intention of agricultural producers to adopt climate adaptation practices. These factors include risk perceptions (e.g. Prokopy et al. Citation2015), social context (e.g. Casanova-Pérez et al. Citation2016), and access to information (e.g. Raymond and Robinson Citation2013), among others. Research in this domain provides guidance for the design of outreach, education, and technical assistance, specifically that which focuses on supporting the use of adaptation practices in various agricultural sectors.
Photovisualizations (PVZs) are tools increasingly used to help decision-makers in natural resources fields, especially those that engage public participation in management decisions (Pettit et al. Citation2011). These tools have been applied in public processes to assist participants to visualize the impacts associated with climate change (Sheppard and Meitner Citation2005; Sheppard et al. Citation2011). PVZs are accessible and complementary to other forms of communication and can help laypersons with limited background knowledge engage with technical topics (Lewis and Sheppard Citation2005). Our objectives were to determine (1) whether PVZ can aid in decision-making about climate change adaptation, and if so, (2) what characteristics of PVZ are most effective at conveying spatial aspects of adaptation practices.
Methods
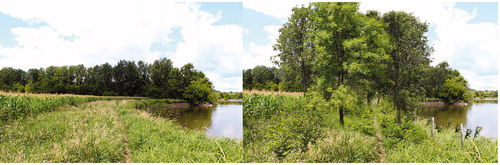
Because the global impacts of climate change vary across geographies, our team decided to create PVZs that use local photographs of agricultural systems as their backdrop and depict regionally appropriate adaptation practices, in order to test them with participants from that same region. This approach increased the likelihood that PVZs would inform management decisions that are familiar to study participants and/or that would be relevant to farms in their area. The base images for our PVZs were photographs taken on farms in Vermont, in the northeastern United States, in the summer of 2013. We reviewed scholarly manuscripts to identify a list of on-farm practices that could potentially enhance the ability of farms to adapt to climate change (Schattman et al. Citation2014). From this list, we selected a subset of four practices to superimpose onto the photographs using Adobe Photoshop (Creative Suite, version 5.5). These were: (1) silvopasture, (2) vegetative riparian buffers, (3) a retention pond with slope stabilization, and (4) drainage tile with constructed wetlands. The final PVZs (61 × 91 cm2 posters) depict the original photograph paired with the digitally-altered version (see depicting silvopasture and depicting vegetative riparian buffers).
Figure 1. Photovisualization depicting silvopasture.
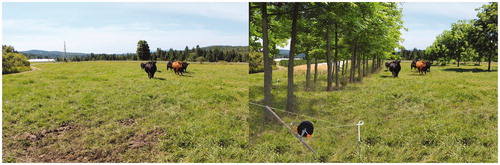
Figure 2. Photovisualization depicting riparian buffers (Schattman et al. Citation2014).
We conducted four focus groups between March 2015 and December 2016. To solicit participation, we targeted organizations whose staff or membership included agricultural advisers or technical service providers (3 focus groups), or farmers (1 focus group). Each focus group included 5–10 participants. A summary of the focus group participants can be found in . Additional farmer organizations were contacted with requests that their staff or members participate in the study, but were either unresponsive or declined. Data collection stopped when no additional organizations agreed to participate.
Table 1. Focus group descriptions, groups conducted in the state of Vermont, United States, 2015–2016.
During the focus groups, the PVZs were displayed around the rooms in which the focus groups were held, and sent by email to remote/telephone phone participants to review simultaneously. A semi-structured focus group instrument was used to capture the in-depth perspectives of participants. Each focus group lasted between 1.5 and 2 h. Audio recordings were made of the focus groups, and later manually transcribed. Researchers also took field notes to document the context of each session. Transcripts were coded using HyperRESEARCH (Researchware Inc. Citation2013).
We used Grounded Theory to guide our study design and analysis, specifically the variation of that approach described by Glaser (Citation1992), which abdicates use of structured hypothesis and allows for unanticipated findings to emerge from the analysis process (Heath and Cowley Citation2004). To present our results, we use the biographical narrative approach as described by Creswell (Citation2013). General themes were identified by two researchers who facilitated the focus groups prior to coding. Sub-codes and additional code categories were added as additional themes emerged. Two researchers coded each transcript independently, with regular check-ins to confirm coding approaches and interpretation of the data. This method, also known as the constant comparative method, is used to identify and reduce researcher bias in qualitative analysis (Boeije Citation2002). The complete codebook (Table SOM 01) and focus group instrument (Methods SOM 02) are both included in the supplemental materials for this manuscript, should readers wish for more detailed information about our analysis.
Results and Discussion
Can PVZ Aid in Decision-Making About Climate Change Adaptation?
Results from the focus groups show that participants’ perceptions of climate change adaptation practices were changed in response to the images represented by the photo-visualizations in some cases, though not all. Participants described changes in perceptions in response to visualizations when (a) the practices depicted were unfamiliar to them, or (b) when the visualization triggered critical analysis of the visual representation of the practice, generating dialog among participants. For example, participants stated their belief that there is a difference between common conceptualization of silvopasture, which is not widely used in the northeastern United States, and correct use of the practice:
“[The photo-visualization] actually helps a lot because it shows what true silvopasture is. I’ll tell you that most people in Vermont think of silvopasture as going out and modifying the woodland to be a grazing land…and that’s not what it is at all. That would be a step in the wrong direction. This helps a lot because you’re taking a pasture and you’re integrating trees into it as opposed to going the other way. The images were extremely helpful for that end.” – Agricultural Adviser, focus group #2
Providing the visualization, in this case, helped to create a common understanding of a practice. From this point, a more informed conversation could be held regarding the merits and demerits of a practice. Additionally, this may present an opportunity to discuss the uncertainty of practice effectiveness (e.g. the suitability of specific tree species considering potential climate change related impacts, including floods, rising temperatures, or potential pest invasions.)
For those practices with which participants had greater familiarity prior to the focus group, viewing the visualizations generated rich critical discussion about particular details for implementing practices (often deviating from what was illustrated in the visualization), as well as benefits and drawbacks of doing so. Examples of the types of questions raised by participants included: (1) How much time would it take for a vegetative buffer strip to appear as mature as the one depicted in the visualization? (2) What is the cost of putting in the type of buffer strip depicted in the visualization? (3) Can the buffers be used for production purposes (e.g. haying or grazing cows in grass buffer strips, timber harvest, or tree fruit) as well as providing conservation benefits? (4) How will the trees, depicted, impact farmers’ abilities to use their equipment? The richness of the discussion and the degree to which participants engaged with one another suggests that PVZs facilitate group learning about farm practices.
Participants had widely varying responses when asked whether the PVZs could convince them to either adopt a new practice, or encourage a producer to do so. Some participants suggested that effective alternatives to PVZ are commonly used, such as site visits and before/after imagery. Those who thought the PVZs would serve as useful tools for outreach and education thought that they would be most effective in tandem with one-on-one site visits, group workshops, or other forms of outreach. An agricultural adviser described the potential for PVZs to support producer adoption of specific practices when he stated:
“I think that…it could be one more step closer to implementation. Because often it’s multiple conversations and sometimes years of nurturing a relationship and quietly and gently encouraging [a farmer] to adopt a practice - and this is just like one more tool that can help get you there.” –Agricultural Adviser, focus group #2
What Characteristics of PVZ Are Most Effective at Conveying Spatial Aspects of Adaptation Practices?
Our analysis identified several characteristics of PVZs that enhanced their usefulness to producers and agricultural advisers, in addition to potential strategies for extending the impact of PVZs through complementary media. First, participants found PVZs most useful when they depicted high-cost or high-risk projects, where producers may want to consider multiple options prior to selecting an approach. For example, a dairy producer suggested that PVZs would be helpful if she were considering investments in additional barns or manure holding facilities. Separate visualizations for distinct options can help the farmer and the technical service provider effectively communicate about the benefits, costs, and other drawbacks associated with each one. Second, PVZs evoked the richest conversation when they depicted practices that have an obvious visual impact on the landscape. For example, the PVZ of a retention pond with slope stabilization generated a wide-ranging dialog that included the size and shape of the pond, whether a pond was needed at all, various processes for installing ponds, and if the altered shape of the surrounding cropland would be conducive to input and labor efficiency. Third, participants were interested in PVZs, that depicted a practice that was unfamiliar or where prior conceptions of the practice were inaccurate, as in the previously described example of silvopasture. Lastly, we found that participants wanted PVZs that represented a suite of approaches within a category. For example, agricultural advisers may present photos of vegetative riparian buffers of a variety of widths, or that use different plant species. Alternatively, the visualizations can represent sequential phases of implementing the practice (e.g. a silvopasture practice at planting and in 5–10 year intervals.) These phased images would help communicate to producers not only the potential impact of the practice over time but multiple possible outcomes of each practice.
Additional suggestions from participants offer new directions for PVZs as communication tools. For example, the PVZs could be placed in the context of a short video, accompanied by a producer discussing other factors that weighed into their decision to adopt a practice. Alternatively, several participants suggested that depictions of worst-case scenarios might have a greater impact on farmer decision-making than depictions of successful practices. As one technical service provider in focus group #1 observed: “I think that would be a great tool … in good weather conditions, but what would it look like given the worst-case scenario?” These discussions led our group to consider additional alternative approaches included PVZs that showed the potential impacts of extreme weather events, practices in difference timescales, or multiple angle views of a single practice.
Conclusion
Based on our analysis, PVZs are tools that have potential to support agricultural adaptation to climate change. The important components of PVZs are the conversations they generate and the questions they raise, especially when producers are unfamiliar with a practice or when additional information is needed. PVZs have potential to complement other forms of outreach and education related to climate adaptation. We found that PVZs generate rich discussions about ecological and economic effects as well as tradeoffs associated with depicted practices. To have the greatest impact, PVZs should be used when producers are considering implementing high-cost or high-risk projects, when practices are likely to dramatically change the visual landscape, or when a practice is unfamiliar to a producer. Alternative approaches to PVZ that may be useful in the future are the use of PVZs embedded in video or virtual reality platforms, depiction of worst-case-scenarios, or to show how practices may visually change over time. In the future, participatory development of PVZs with the agricultural advisors who use them would create an opportunity for further assessment of efficacy and impact of this novel approach.
Supplemental Material
Download Zip (34.3 KB)Acknowledgments
Thank you to Holly Greenleaf, Ernesto Méndez, Gavin Zeitz, Chelsea Gieryic, and Kate Odell for contributing to this research. We would also like to extend our appreciation to the three anonymous reviewers who provided constructive comments on this manuscript. Thank you to all the Vermont farmers that allowed us to take photos on their land.
Additional information
Funding
Related Research Data
References
- Boeije, H. 2002. A purposeful approach to the constant comparative method in the analysis of qualitative interviews. Quality and Quantity 36:391–409. doi:10.1023/A:1020909529486
- Casanova-Pérez, L., J. P. Martínez-Dávila, S. López-Ortiz, C. Landeros-Sánchez, and G. López-Romero. 2016. Sociocultural dimension in agriculture adaptation to climate change. Agroecology and Sustainable Food Systems 40 (8):848–862. doi:10.1080/21683565.2016.1204582
- Creswell, J. W. 2013. Qualitative inquiry and research design: Choosing among five approaches. 3rd edition. Thousand Oaks, CA: Sage Publications.
- Glaser, B. G. 1992. Basics of grounded theory analysis. Mill Valley, CA: Sociology Press.
- Heath, H., and S. Cowley. 2004. Developing a grounded theory approach: A comparison of Glaser and Strauss. International Journal of Nursing Studies 41 (2):141–150. doi:10.1016/S0020-7489(03)00113-5
- Lewis, J. L., and S. R. J. Sheppard. 2005. Ancient values, new challenges: Indigenous spiritual perceptions of landscapes and Forest management. Society & Natural Resources 18 (10):907–920. doi:10.1080/08941920500205533
- Pettit, C. J., C. M. Raymond, B. A. Bryan, and H. Lewis. 2011. Identifying strengths and weaknesses of landscape visualisation for effective communication of future alternatives. Landscape and Urban Planning 100 (3):231–241. doi:10.1016/j.landurbplan.2011.01.001
- Prokopy, L. S., J. G. Arbuckle, A. P. Barnes, V. R. Haden, A. Hogan, M. T. Niles, and J. Tyndall. 2015. Farmers and climate change: A cross-national comparison of beliefs and risk perceptions in high-income countries. Environmental Management 56 (2):492–504. doi:10.1007/s00267-015-0504-2
- Raymond, C. M., and G. M. Robinson. 2013. Factors affecting rural landholders’ adaptation to climate change: Insights from formal institutions and communities of practice. Global Environmental Change 23 (1):103–114. doi:10.1016/j.gloenvcha.2012.11.004
- Researchware Inc. 2013. HyperRESEARCH 3.5.2. Accessed November 30, 2016. http://www.researchware.com/products/hyperreseach.html
- Schattman, R. E., V. E. Mendez, K. Westdijk, M. Caswell, D. Conner, C. Koliba, A. Zia, S. Hurley, C. Adair, L. Berlin, et al. 2014. Vermont agricultural resilience in a changing climate: A transdisciplinary and participatory action research (PAR) process. In Agroecology, ecosystems, and sustainability. ed. N. Benkeblia, 325–346. Boca Raton, FL: CRC Press Taylor Francis.
- Sheppard, S. R. J., and M. Meitner. 2005. Using multi-criteria analysis and visualisation for sustainable Forest management planning with stakeholder groups. Forest Ecology and Management 207 (1-2):171–187. doi:10.1016/j.foreco.2004.10.032
- Sheppard, S. R. J., A. Shaw, D. Flanders, S. Burch, A. Wiek, J. Carmichael, J. Robinson, and S. Cohen. 2011. Future visioning of local climate change: A framework for community engagement and planning with scenarios and visualisation. Futures 43 (4):400–412. doi:10.1016/j.futures.2011.01.009
- Tubiello, F., J. Schmidhuber, M. Howden, P. G. Neofotis, S. Park, E. Fernandes, and D. Thapa. 2008. Climate change response strategies for agriculture: Challenges and opportunities for the 21st century. Agriculture and Rural Development Discussion Paper No. 42, The World Bank, Washington, DC, U.S.A.
- Walthall, C. L., J. Hatfield, P. Backlund, L. Lengnick, E. Marshall, M. Walsh, S. Adkins, S. Aillery, E. A. Ainsworth, C. Ammann, et al. 2012. Climate change and agriculture in the United States: Effects and adaptation. Technical bulletin 1935. Washington, DC: United States Department of Agriculture.