
Abstract
Background: There is no clear description of the evolution of the progression of abdominal adhesions over time.
Method: The optimized model was selected using different adhesion scoring systems. Then, this model was used to observe the progression of abdominal adhesions. Visualized observation of abdominal adhesion evolution was performed by laparoscopy and computed tomography. The inflammatory cell infiltration and collagen fibers in adhesion tissues at different times were evaluated by hematoxylin-eosin and picrosirius red staining. RNA sequencing was used to predict potential key targets of abdominal adhesions at different times.
Results: The abdominal adhesion model showed the highest reproducibility when it was established using a circular tool and an electric brush. Based on this model, we found that the inflammatory response was activated early in the process of adhesion formation, peaking on day 3 and then gradually decreasing until stabilization on day 7. Collagen and fibronectin formed on day 1 and gradually increased until remaining stable on day 7. In addition, the characteristic changes in the adhesion zone from initial congestion, edema and fragile tissue to later dense and stable tissue could be vividly observed in live mice by laparoscopy and artificial pneumoperitoneum CT. The RNA sequencing results revealed that Hck on day 1, Ndufs3 and Ndufs8 on day 3 and Aif1 on day 7 might play key roles in abdominal adhesion formation.
Conclusion: The construction of a standard process for describing the evolution of abdominal adhesions based on an optimized mouse model will help to facilitate subsequent adhesion-related studies.
1. Introduction
Postoperative abdominal adhesions (PAAs) are one of most common complications of abdominal surgery, and the severe complications arising from PAAs include intestinal obstruction, chronic abdominal pain and infertility [Citation1, Citation2]. Therefore, it is necessary to explore the pathological mechanism of PAAs. It is worth noting that achieving consistency in the formation of PAAs is an important prerequisite for the study of the pathological mechanism and prevention of PAAs, which requires the establishment of a stable and highly repeatable model of PAA formation [Citation3]. However, most models of PAAs lack detailed descriptions or are difficult to reproduce correctly [Citation4], making it impossible to objectively compare the different methods of preventing PAAs proposed in the literature.
Although inflammation, fibrosis and mesothelial cells are known to play key roles in the formation of PAAs [Citation5–7], the specific time points in the processes of inflammation, fibrosis and self-repair of mesothelial cells are still unclear. This leads to our inability to standardize the specific course of PAA progression, which affects the progress of research on the treatment of PAAs.
Here, we established an optimized mouse model of PAAs with high consistency in the degree of adhesion formation. Then, this model was used to observe the progression of PAAs. The results from PAA observation and histopathological experiments exhibited the characteristics of the pathological process of PAA progression, which will help to set standard levels for the dynamic progression of PAAs. Additionally, the standard dynamic progression of PAAs may facilitate subsequent adhesion-related studies.
2. Materials and methods
2.1. Animals
This experimental research was conducted at the animal experiment center of Xi’an Jiaotong University. Virgin female mice (n = 70) weighing 20-35 g were randomized into seven groups. The laboratory fulfilled the following requirements: temperature, 20-28 °C; relative humidity range, 40 to 60%; 12/12-h light/dark cycle; and frequency of air purification, 10-15 h. All cages were disinfected and lined with 5 × 5 × 1 mm wood chips. Food and tap water were available ad libitum. This experiment was approved by the Institutional Animal Care and Use Committee of Xi’an Jiaotong University and performed in accordance with their guidance and regulations (No. 20221405). All mice were housed in cages (5 mice per cage) under specific pathogen-free (SPF) conditions for at least 5 days prior to surgery.
2.2. Procedure for establishment of PAA model
Seventy mice were selected to complete the experiment and were randomly divided into 7 groups (Figure S1). Infection was prevented by an intravenous tail vein injection of cefazolin in 0.1 ml for three consecutive days prior to surgery [Citation8]. All mice were fasted for six hours before and not allowed water for four hours before surgery; however, no special preoperative nutrition was offered. Analgesia was achieved with a subcutaneous injection of buprenorphine two hours before surgery.
All surgical procedures were performed in an animal operating room under aseptic conditions. Mice were anesthetized with isoflurane inhalation through spontaneous breathing. Anesthesia was evaluated by rubbing the mouse cornea with gauze. Intrarectal monitoring was used to monitor the core body temperature. Throughout the surgical procedures, the anesthetized animals were placed on a heating pad at 38 °C. After disinfecting the surgical field 3 times, draping was completed. All surgeries were performed by the same surgeon to maintain the same operating conditions and were limited to ten minutes to minimize the effect of air on tissues. After a 1.5-cm ventral midline incision was made in the skin with a scalpel, the musculoperitoneal layer was opened with a 1.2-cm incision in the linea alba using surgical scissors. As shown in , the right parietal peritoneum 1 cm from the incision and the cecum were subsequently manipulated according to the treatment group. The specific details of the operation are shown in .
Figure 1. Diagram of the groups and operations in the standardized mouse abdominal adhesion models explored. (A). Sham group. (B). Brush group. (C). Ischemic button (IB) group. (D). Brush and ischemic button (BIB) group. (E). Clamp group. (F). Electric coagulation (EC) group. (G). Suture group.
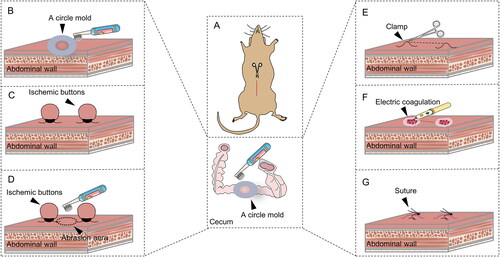
Table 1. Groups and operation details of standardized mouse PAA models.
After treatment of the parietal peritoneum and cecum, the peritoneum was closed with polyglycolic acid absorbable sutures (6/0 suture), and the abdominal wall was closed using 6/0 nonabsorbable sutures. In addition, the wound was disinfected three times before the incision was protected with sterile dressings.
After surgery, each mouse was placed in a clean cage with continuous monitoring until spontaneous awakening. Mice were monitored twice daily for signs of wound dehiscence, infection, and other complications. The mice received a subcutaneous injection of buprenorphine every 6 h for the following 2 days for pain management. Furthermore, the mice were fasted for the first 12 h but free to consume 5% glucose water. The animals were provided with food and tap water from 12 h postoperatively to postoperative day (POD) 7. The mice were sacrificed by open surgery on POD 7 to observe the degree of adhesion formation, as previously described [Citation9].
2.3. Scoring criteria for adhesions
The extent of the adhesion area was assessed, and the quantity of adhesions was determined according to Nair’s scoring system [Citation10] (Table S1). In addition, the quality of adhesions was evaluated according to Lauder’s scoring system (scores ranging from 0 to 6), as shown in Table S2.
2.4. Laparoscopy
To investigate the progression of PAAs, the peritoneal brushing method was used to establish a PAA model. A flow chart of the laparoscopic observation of PAA progression in the groups of mice is shown in Figure S2. Briefly, 60 mice were used to complete this procedure, including 10 untreated mice as the control group. The other 50 mice were used to establish the mouse model, were randomly divided into five groups and euthanized on POD 1, 3, 5, 7 or 14. A laparoscope was purchased in China (Xiaomi, Zhejiang, China). Before laparoscopy, a syringe was used to inject 3 ml of air into the abdominal cavity to establish pneumoperitoneum. The laparoscope was inserted into the abdominal cavity through a 5-mm incision in the left upper abdomen. After laparoscopy, the peritoneum was closed with polyglycolic acid absorbable sutures (6/0 sutures), and the abdominal wall was closed using 6/0 nonabsorbable silk sutures.
2.5. Artificial pneumoperitoneum computed tomography (CT) examinations
CT examinations were performed using a 64-channel MDCT scanner (Super Nova, China). The section thickness was 0.1 mm, and the section spacing was 3.9 mm. We used a total of 60 mice, grouped in the same way as for laparoscopic observation, to complete this procedure. Details regarding grouping can be found in Figure S2. After mice were anesthetized with isoflurane inhalation, 5 ml of air was injected intraperitoneally into the left lower abdomen. Notably, the rate of injection was slow, and when the establishment of pneumoperitoneum was confirmed, the inflation speed could be accelerated. The mice were then kept in the supine position and underwent CT scans immediately from the diaphragmatic apex to the pelvic floor. The obtained images were analyzed by a picture archiving and communication system (PACS).
2.6. Histopathological evaluation
Control or adhesion peritoneal tissues were collected from the mice in the open surgery experiment and minced on ice. All collected tissues were stained with hematoxylin and eosin (H&E) and picrosirius red. H&E staining was used to measure the level of inflammation. As shown in Table S3, the degree of inflammation was evaluated in a double-blinded manner by two assessors based on a published scoring system [Citation11]. Picrosirius red staining was used to evaluate the thickness of collagen and was performed in a double-blinded manner by two assessors as previously described [Citation12].
2.7. RNA-seq data analysis
Sequencing libraries were generated using the NEBNext® UltraTM RNA Library Prep Kit for Illumina® (NEB, USA) following the manufacturer’s recommendations. Fastq format raw data (raw reads) were processed first by internal Perl scripts. High-quality clean data were used for all downstream analyses. The mapped reads of each sample were assembled by StringTie (v1.3.3b) with a reference-based approach. The read numbers mapped to each gene were counted by featureCounts. The fragments per kilobase per million mapped fragments (FPKM) of each gene was then mapped to the gene based on read counts calculated from the length of the gene. Two conditions/group (4 biological replicates per condition) were used for differential expression analysis using the DESeq2 R package (1.16.1). Using the Benjamini–Hochberg method, the resulting P values were adjusted to control for the false discovery rate. Genes with an adjusted p value <0.05 identified by DESeq2 were identified as differentially expressed. Differentially expressed genes (DEGs) were subjected to Gene Ontology (GO) enrichment analysis and Kyoto Encyclopedia of Genes and Genomes (KEGG) pathway analysis using the cluster Profiler R package to correct for gene length bias. For the DEGs, protein–protein interaction network (PPIN) analysis was performed based on the STRING database. The cytoHubba plugin was used for clustering coefficient analysis to predict the key targets and subnetworks that were more closely related in the PPIN.
2.8. Statistical analysis
SPSS 18.0 was used to analyze all the data in this study. Quantitative data are presented as the mean and standard deviation, while enumeration data are expressed as the median. Categorical variables were assessed by the Kruskal–Wallis test. Mean values were compared among groups with one-way analysis of variance (ANOVA), and Dunnett’s t test was performed to determine the differences between any two groups. Differences between groups with a P value less than 0.05 were considered statistically significant.
3. Results
3.1. Most reproducible adhesion formation achieved with peritoneal brushing
Previous studies have shown that stable adhesions are generally formed on POD 7 [Citation13–15], so we selected POD 7 to observe adhesions in different groups (). All animals survived the primary procedure and the 7 days of follow-up without complications or pain symptoms. In the sham group, no adhesions were observed. More than 2 adhesion bands were apparent in the brush group and the electric coagulation (EC) group. Although adhesions were observed in both the ischemic button (IB) group and the suture group, the number of adhesion bands varied from 1 to more than 2. In the brush and ischemic button (BIB) group, the cecum and small intestine were adhered directly to the peritoneum in 3 mice, while almost all of the remaining mice had 2 adhesion bands. In contrast, no adhesions were observed in two mice in the clamp group, while the other mice had two or more adhesion bands.
Figure 2. Highly reproducible induction of abdominal adhesions by brushing of the parietal peritoneum and cecum. (A) Open surgical observation of PAA conditions in each group (n = 10; red arrows mark adhesion tissue). (B–D) Raincloud map showing Nair’s adhesion scores (B), Lauder’s adhesion scores (C) and adhesion percentage (D) of mice in different modeling groups. (Raincloud map: cloud is a violin diagram; umbrella is a boxplot; rain is a scatter diagram; thunder is the line of the average score in each group. As shown in the figure, brushing of the parietal peritoneum and cecum was the most stable method with the best consistency).
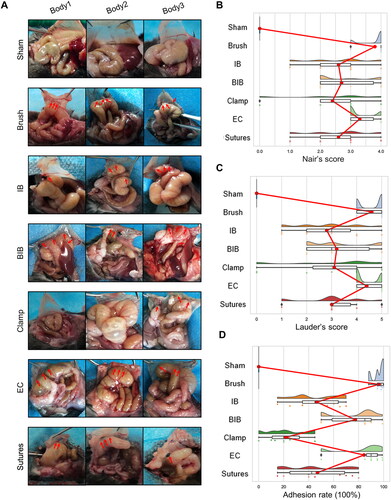
Then, raincloud plots based on the different adhesion scoring systems were generated to visualize the distribution of the degree of adhesion formation in each group (). Whether Nair’s adhesion scoring system or Lauder’s adhesion scoring system was used, the distribution of scores was most concentrated in the brush group, reflecting the high stability of this model (). As shown in , the span of the adhesion rate was the smallest in the brush group, excluding the sham group, suggesting that the reproducibility of adhesions in the brush group was high.
3.2. Dynamic observation of PAA progression after peritoneal brushing in live mice using laparoscopy
Based on the results of our optimized model, we believed that the PAA model established with peritoneal brushing with a circular mold was the most stable model for adhesion formation. Therefore, this model was selected to observe the dynamic progression of PAAs through an open surgical approach, as shown in . No hyperemia, edema or adhesion formation was observed in the control mice. On POD 1, severe hyperemia and edema were observed in adhesions and the cecum. Then, on POD 7 and POD 14, hyperemia and edema were no longer observable. Next, the different adhesion scoring systems were used to evaluate the degree of adhesion formation (). Using both Nair’s and Lauder’s adhesion scoring systems, there was no significant difference between the scores on PODs 7 and 14, while a significant difference in the degree of adhesion formation between the brush and control groups was observed on PODs 5, 7 and 14. In addition, the adhesion rates at different time points are shown in Figure S3A. There was no significant difference in the adhesion rate between PODs 7 and 14.
Figure 3. Dynamic visual observation of the process of adhesion evolution by laparoscopy. (A) Open surgical observation of normal peritoneum and PAA conditions on PODs 1, 3, 5, 7 and 14; black arrows mark adhesion tissue (n = 60). (B) Nair’s adhesion scores at different time points under typical gross observation (n = 10; compared with the control group, *P < 0.05). (C) Lauder’s adhesion scores at different time points under typical gross observation (n = 10; compared with the control group, *P < 0.05). (D) Representative images of abdominal adhesion formation in the injured areas visualized by laparoscopy (n = 60, yellow arrows indicate subserosal hemorrhage on the injured cecal surface, and red arrows indicate tight flaky adhesion of the cecum to the abdominal wall). (E) Nair’s adhesion scores at different time points under laparoscopy (n = 10; compared with the control group, *P < 0.05, ***P<0.001). (F) Lauder’s adhesion scores at different time points under laparoscopy (n = 10; compared with the control group, *P < 0.05, ***P<0.001).
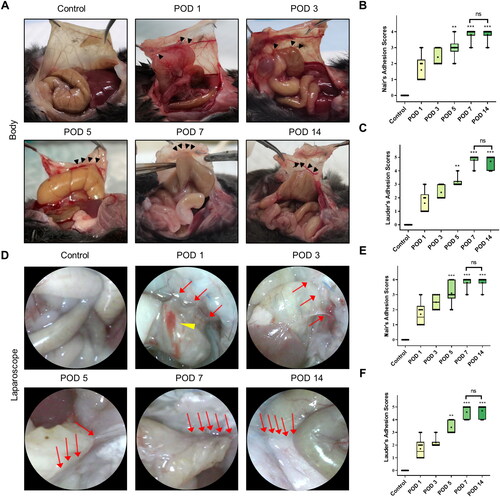
Then, laparoscopic technology was used to observe the development of PAAs continuously and dynamically in living mice. As shown in , compared to mice in the control group, mice in the other five groups showed obvious adhesions. The endoscopic features were mainly severe hyperemia and edema in adhesion bands accompanied by subserous hemorrhage on the injury surface on POD 1. Subsequently, the hyperemia and edema gradually decreased and disappeared on POD 7. Furthermore, the observed adhesions gradually became dense and appeared tough on POD 7, and the observations made on POD 14 were similar to those made on POD 7. In addition, the degree of adhesion formation observed laparoscopically at different time points was assessed by the two adhesion scoring systems. The results were similar to those of open surgery, and there was a statistically significant difference in the adhesion score between the experimental and control groups on PODs 5, 7 and 14 (). These results indicated that the degree of adhesion formation gradually increased over time, with stable and permanent adhesions forming on approximately POD 7.
3.3. Significant advantages of artificial pneumoperitoneum CT in observing the area of mature adhesions without causing trauma in mice
It has been proven that CT with an artificial pneumoperitoneum is of great value in the diagnosis of PAAs [Citation16]. Additionally, CT followed by three-dimensional reconstruction can provide a more intuitive basis for the diagnosis and treatment of PAAs. For these reasons, the evolution of PAAs in the brush group was observed using artificial pneumoperitoneum CT (). Interestingly, although the cecum was significantly more edematous on PODs 1 and 3 than in the control group, no adhesion bands were observed on CT on POD 1 or 3. Subsequently, images acquired on PODs 5, 7 and 14 showed that the intestines and organs were attached to the abdominal wall, implying the presence of adhesions. Then, we evaluated differences in the adhesion rate among these three points through three-dimensional reconstruction ( and Figure S3B), and we found that the adhesion area was almost the same on PODs 5, 7 and 14, with a statistically significant difference in the adhesion area compared to the control group on all three days. In summary, while exploring the standardization process, we also identified two new noninvasive methods for visualizing PAA morphology in mice, reducing the abstraction of PAAs. Each of the two methods has advantages and can serve as a new in vivo imaging method for the observation of PAAs ().
Figure 4. Dynamic visual observation of the process of adhesion evolution by artificial pneumoperitoneum CT. (A) CT images of adhesions in the abdominal cavity at different time points. The yellow five-pointed stars indicate the gas-filled intestine, and the red dotted line indicates the longest diameter of the adhesion between the cecum and the parietal peritoneum (n = 60). The intra-abdominal organs were evenly distributed, and an obvious semicircular gas-density gap was clearly displayed between the cecum and the abdominal wall, indicating a clear separation and lack of adhesion bands between the cecum and the abdominal wall. (B) Three-dimensional reconstruction of PAAs in mice on PODs 5, 7 and 14 (sagittal view; red dotted line indicates the longest diameter of the adhesion between the cecum and the parietal peritoneum).
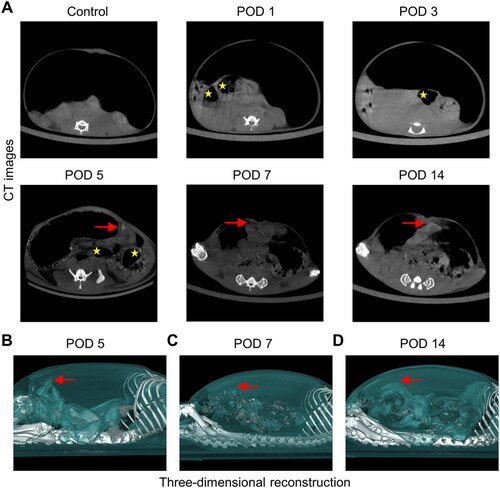
Table 2. Different examination methods for visualizing PAA formation and the scope of application.
3.4. Unique characteristics of inflammatory, fibrotic and mesothelial changes in the different stages of PAA formation after peritoneal brushing
We collected tissues from model mice at the indicated time points and performed H&E staining. As shown in , no inflammatory response was present in the control group, while a large number of inflammatory cells, mainly neutrophils, were recruited to adhesion tissues on POD 1. On POD 3, the thickness of inflammatory cell infiltration was significantly increased, and while the inflammatory cells were mainly mixed cells, such as plasma cells and neutrophils, foreign body giant cells were also present. Then, the inflammatory response weakened gradually, with a slight decrease on POD 5 and almost complete resolution after POD 7. Next, we calculated the inflammation score to evaluate the results we observed (). Inflammatory cell aggregation started on POD 1, reached a maximum on POD 3, and then continued to gradually decline, reaching a normal level on POD 7. The inflammation scores on PODs 1, 3, and 5 were significantly different from those in the control group, while those on PODs 7 and 14 were not.
Figure 5. Degree of inflammation and collagen deposition in injured peritoneum and adhesion. (A) Histological observation of peritoneal tissues at different time points (100×; inset, 400×). (B) Representative images showing picrosirius red staining (100×; inset, 400×). (C) Inflammatory scores at different time points based on histology (n = 10; compared with the control group, *P < 0.05, ***P<0.001). (D) Thickness of the collagen fiber zone in the adhesion tissue (n = 10; compared with the control group, *P < 0.05, ***P<0.001).
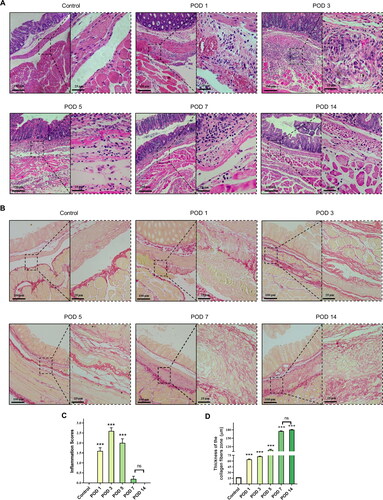
Then, picrosirius red staining was applied to detect collagen deposition. As shown in , the structure in the control group was clear and intact, with only a very thin layer of red-stained collagen fibers on the peritoneal surface. At the other time points, obvious proliferation of collagen fibers was observed, with red interlacing structures. Then, we evaluated the degree of collagen deposition by measuring the thickness of collagen fibers (). There was a significant difference in the degree of collagen deposition in the adhesion tissues at all time points between the brush and control groups. During the formation of PAAs, gradual collagen fiber formation and deposition began on POD 1 and was followed by a gradual increase in collagen fiber thickness that peaked on POD 7, after which a steady state was reached.
The formation of PAAs is closely associated with mesothelial cells. As shown in , we observed that mesothelial cells were present in a single layer and exhibited a linear arrangement on the peritoneal surface in the control group and that intercellular connections were lost on POD 1. Mesothelial cells exhibited a proliferative phenotype, as evidenced by the signs of thickening on PODs 3 and 5. Notably, a single layer of linear mesothelial cells between the damaged peritoneum and cecum was almost repaired, and regenerated mesothelial cells were observed to cover the surface of adhesion bands and form stable adhesions on POD 7. Additionally, TUNEL staining was applied to detect the apoptosis level and indicated that the injured peritoneum stimulated apoptosis during the first 3 days after surgery. Above all, we developed standards for the histological observation of PAA progression, as shown in .
Figure 6. Representative images of the mesothelial cell layer and apoptosis in the peritoneal tissue and adhesions visualized by immunofluorescence staining (40×). The yellow lines indicate mesothelial cells, and adhesions (ADH) are indicated by gray boxes (mesothelial cells are characterized by the expression of cytokeratin 19 (CK 19)).
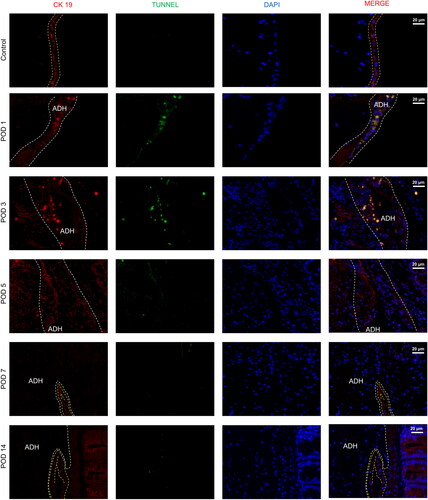
Table 3. Histological characteristics at different stages of PAA formation.
3.5. Key genes and pathways regulating the development of PAAs at different time points during adhesion formation revealed by RNA-seq analysis
To predict potential genes associated with the formation and evolution of PAAs, RNA-seq was employed to analyze PAA tissues collected at different time points. We compared the data between the 3 groups and the sham group to identify DEGs (). Additionally, we analyzed the expression patterns of the DEGs mentioned above and selected the top 50 DEGs. We found that most genes were highly expressed at different time points after the formation of PAAs and that only a few genes were downregulated ().
Figure 7. RNA-seq analysis of adhesion tissues at different time points. (A–C) Volcano plot of overall gene-based differential expression results for adhesion tissues on PODs 1 (A), 3 (B) and 7 (C) vs. normal peritoneal-cecal tissues (each dot corresponds to a gene). The y-axis corresponds to the negative log (base 10) of the P values, while the x-axis corresponds to the negative log (base 2) of the fold change for the difference in expression in adhesion tissues at different time points. Adjusted p value<0.01 (red dots and green dots). POD 1 showed 1,037 upregulated genes and 590 downregulated genes. POD 3 showed 1535 upregulated genes and 969 upregulated genes. POD 7 showed 866 upregulated and 325 downregulated genes. (D) Heatmap representing the top 50 DEGs among normal peritoneal-cecal tissues and adhesion tissues on PODs 1, 3 and 7. FDR <0.05. Red indicates upregulation, and green indicates downregulation. (E–G) KEGG pathway enrichment analysis of DEGs in adhesion tissues on PODs 1 (E), 3 (F) and 7 (G). The size of the circle represents the significance of enrichment.
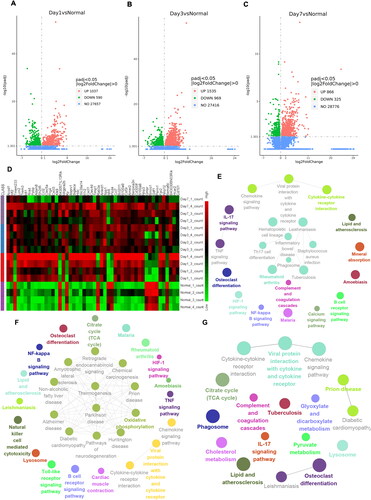
The KEGG and GO databases were used for enrichment analyses, as shown in and Figure S4. The DEGs evaluated by KEGG analysis were significantly enriched in the gene sets of the chemokine signaling pathway and cytokine–cytokine receptor interaction function (). Additionally, the GO analysis confirmed that the DEGs on POD 1 were closely associated with leukocyte migration and chemotaxis function (Figure S4A). On POD 3, the DEGs were mainly concentrated in oxidative phosphorylation and thermogenesis pathways, as indicated by KEGG analysis (). In addition, the DEGs in the GO database were closely related to oxidoreductase complex 1 (Figure S4B). On POD 7, the DEGs evaluated by GO and KEGG analyses were enriched in cytokine activity and chemokine activity. In addition, KEGG analyses showed that the DEGs were closely related to the phagosome, the IL-17 signaling pathway and complement and coagulation (Figure S4C and ).
After excluding DEGs with insufficient variation, the DEGs identified in the PAAs at the different time points were analyzed to construct the PPIN. We hypothesized that the genes with connections at different time points may be involved in the formation of PAAs. On this basis, we used cytoHubba for clustering coefficient analysis to predict the key targets and subnetworks that were more closely related in the PPIN. Furthermore, we used the clueGO plugin to analyze the GO pathway enrichment of the top 10 hub genes.
We observed multiple pairs of interactions between HcK, Hcls1, Tyrobp and other targets on POD 1 (). They were enriched in a variety of biological functions, including the regulation of macrophage differentiation and neutrophil activation involved in the immune response. These results suggested a correlation between the early stage of adhesion formation and the occurrence of inflammation, along with the infiltration, adhesion and migration of inflammatory cells.
Figure 8. Identification and functional analysis of 10 hub genes. (A–C) The top 10 hub genes in the PPIN of adhesion tissues on PODs 1 (A), 3 (B) and POD 7 (C) were screened by the Cytoscape plugin cytoHubba based on the degree of connection. Functions and pathways of the hub genes were visualized using ClueGO.
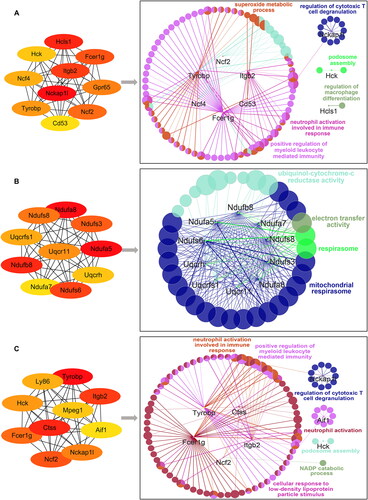
On POD 3, direct interactions between Ndufs3, Ndufs6, Ndufs8, Ndufa8, Uqcrfs1 and other targets were predicted, and the enrichment analysis indicated that the top 10 hub genes were significantly enriched in electron transfer activity, the respirasome and the mitochondrial respirasome (). In vivo, reactive oxygen species (ROS) are mainly derived from mitochondrial respiratory chain function and are indicators of the oxidative stress state in vivo. These results suggested that the formation of PAAs was related to oxidative stress on POD 3.
Next, we analyzed the interactions among the predicted targets Hck, Itgb2 and Aif1 on POD 7 (). According to the pathway enrichment analysis results generated using the GO platform, the top 10 hub genes were associated with NADP catabolism, neutrophil activation, positive regulation of myeloid leukocyte-mediated immunity and neutrophil activation involved in the immune response, with Aif1 being significantly enriched in the positive regulation of fibroblast growth factor (FGF) production and having extensive angiogenic activity and potential mitogenic activity in mesothelial cells. Aif1 is a calcium-binding protein that promotes the activation and growth of macrophages, which affects the progression of inflammation, immunity and fibrosis in PAAs. These results suggested that Aif1 might be involved in PAA formation and promote adhesion maturation by influencing macrophage activation and positively regulating the FGF production pathway on POD 7.
Notably, the results of the gene enrichment analyses conducted with the GO and KEGG databases were similar to the results of the gene clustering analysis conducted with cytoHubba based on the PPIN. In addition, pathways and target genes with different functions were found to play leading roles in PAA formation at different time points; that is, initiation of the inflammatory response, oxidative stress, fibrosis and angiogenesis played roles in the early, middle (POD 3) and late (POD 7) stages of adhesion formation.
4. Discussion
Rats are widely used in adhesion models. First, pre- and postoperative management is more convenient in rats than in large animals [Citation17]; second, they heal faster than humans [Citation18]. The reason why the research model in this study was established with mice is that mouse models offer the same advantages as rat models. More importantly, transgenic mice can be used to establish animal models of human diseases and to test and compare the results of various treatment options for drug screening and disease diagnosis and treatment. In previous studies, the cecum and opposite parietal peritoneum have been abraded with sterile dry gauze [Citation19], a sterile scalpel [Citation20] or a sterile rasp [Citation21] to establish a model of adhesion formation. However, there is no quantitative evidence describing the intensity of treatment. In this study, we used a circular mold to control the area of treatment and keep the area consistent. On this basis, we first proposed to use a round electric brush for the operation. The advantage of the round electric brush lies in its constant vibration frequency, which exerts a consistent force. We confirmed the stability and reproducibility of this model by evaluating the degree of adhesion formation on POD 7. The results indicated that peritoneal brushing with a circular mold was the most practical method for establishing an adhesion model, which could be used as an optimized PAA model in subsequent studies on PAA progression.
Inflammation and fibrosis are the main mechanisms involved in adhesion formation [Citation22]. In this study, we found that local inflammation presents in the peritoneal tissue once the peritoneum is damaged. Additionally, we observed that the inflammatory response is activated early and is dominated by neutrophils. The thickness of the inflammatory cell zone was the highest on POD 3 and was dominated by macrophages, and then the inflammatory response gradually weakened, stabilizing on POD 7. These results are similar to those of previous research [Citation14]. Additionally, Setareh Soltany et al demonstrated that the inflammatory response was dominated by neutrophils and macrophages on the first day after surgery [Citation23]. Consistent with this, Adrian Fischer et al reported that neutrophils directed mesenchymal cells to repair tissue sites within minutes of peritoneal damage [Citation24], which is closely related to extracellular matrix formation. At the same time, macrophages are involved in the inflammatory and immune responses in the early stage of adhesion formation. On the one hand, macrophages promote the aggregation of mesothelial cells and fibroblasts by producing ROS [Citation25]. On the other hand, macrophages may play an important role in the fibrinolytic process of PAA formation [Citation26]. These results explain one of the reasons for the increase in fibroblast activity and collagen formation in the later stages. Additionally, according to the PPIN analysis results, the expression of inflammation-related genes, such as Hcls1 and Tyrobp, was significantly increased on POD 1. These results reflect the role of the inflammatory response in the early stage of adhesion formation and suggest that Hcls1 may be a key target gene in the formation of PAAs on POD 1.
PAA formation is essentially peritoneal overrepair. Qiongyuan Hu et al [Citation14] confirmed that the macrophage–myofibroblast transition (MMT) and the progressive migration of fibroblasts during adhesion formation enhanced the formation of collagen in the adhesion tissue. In the early stage, a large amount of prothrombin is activated to form thrombin after the coagulation process begins, which in turn activates fibrinogen to form fibrin. The fibrin then coagulates with platelets around the wound surface to form a fibrin mesh. Subsequently, the rate of fibrinolysis decreases during adhesion formation, resulting in progressive collagen deposition. We demonstrated that collagen and fibrin formation began on POD 1 and gradually increased until it remained stable on POD 7, which is largely consistent with the pattern of development. In addition, the expression of macrophage-related genes, such as Aif1 and Tyrobp, was significantly increased on POD 7. Aif1 may promote vascular smooth muscle growth and regulate the FGF production pathway [Citation27, Citation28], which is involved in angiogenesis [Citation25, Citation29, Citation30]. Therefore, we speculated that Aif1 may affect the fibrinolytic process and vascular formation during the late stage of PAA formation. However, the role of these genes in the pathogenesis of PAAs remains to be further investigated.
In addition, oxidative stress is involved in peritoneal tissue healing [Citation31, Citation32]. A large amount of ROS can lead to the MMT and necrosis in mesenchymal cells [Citation23]. Our results suggested that the expression of Ndufs3, Ndufs8, and Uqcrfs1, genes related to oxidative phosphorylation and mitochondrial protection, was significantly increased on POD 3, suggesting that Ndufs3, Ndufs8 and Uqcrfs1 might be key genes affecting PAA formation. The combination of our results with those of many studies related to PAAs provides a clear description of the whole adhesion formation process ().
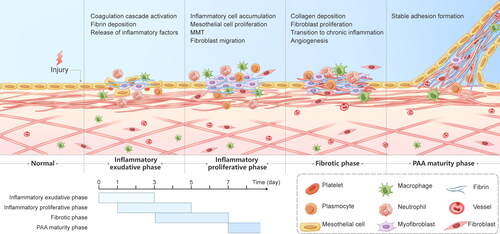
Figure 9. Graphical description of the progression of PAAs. PAA formation mainly consists of the inflammatory exudative phase, the inflammatory proliferative phase, the fibrotic phase and the PAA maturity phase, with overlap between the first three phases. The inflammatory exudative phase lasts 3 days from the beginning of the surgery and is dominated by early activation of the coagulation cascade, massive release of inflammatory factors and fibrin deposition. The inflammatory proliferative phase is mainly present on PODs 1-5 and is characterized by inflammatory cell aggregation, fibroblast migration, and the MMT. The fibrotic phase lasts from POD 3 to POD 7 and consists mainly of fibroblast growth into the deposited collagen, angiogenesis and the transition from acute to chronic inflammation, culminating in the formation of stable adhesions.
A study that assessed the degree of intestinal inflammation and gastrointestinal transit in mice by laparoscopic surgery provided a technical and theoretical basis for the observation of adhesions under laparoscopy [Citation33]. Therefore, we first proposed to perform dynamic observation of the evolution of PAAs by laparoscopy. We found that the results of laparoscopy were similar to those of open surgery, and the superiority of laparoscopy was obvious. Compared with open surgery, laparoscopy not only significantly reduces the scope of surgical trauma and the occurrence of postoperative pain but also more closely follows the "3 R principle" of animal experiments.
CT is characterized as rapid and noninvasive and is considered to play a key role in the diagnosis of PAAs [Citation33, Citation34]. In our study, although the existence of adhesions was not clearly observed within the first 3 days, the CT results combined with the laparoscopic findings led us to suspect that the adhesions were filmy and easily separated by increased intra-abdominal pressure at the beginning of PAA formation, creating the illusion of the absence of adhesion formation. Above all, these results show that artificial pneumoperitoneum CT has a significant advantage in observing the area of mature adhesions.
However, this study had some limitations. First, we chose a small animal model for this experiment instead of a large animal model, such as a porcine model. Although large animals are more reflective of humans than mice, mice have the advantage of being more suitable for high-throughput screening experiments. Second, the degree of PAA formation caused by the same modeling method varies among different mouse strains [Citation35]. In this study, we chose C57BL/6 mice to establish the optimized model and explore the standard changes in PAA progression. Therefore, we could not clearly characterize PAA progression in other strains of mice. Third, there have been no previous studies on the progression of PAA formation in mice using laparoscopy and artificial pneumoperitoneum CT. However, we are aware that both techniques are slightly damaging to mice. For this reason, to exclude the potential interference of the two methods on adhesion formation, we conducted separate experiments in two groups.
In summary, we established an optimized mouse model of PAA formation with high repeatability using a round electric brush. Based on this model, we explored the stages of PAA progression, providing a stable baseline reference for the subsequent prevention and treatment of PAAs. Second, we explored the possible key pathways in the process of PAA formation through bioinformatics analysis to provide directions for the subsequent study of PAAs. Third, this work was focused on experimental methods. We tried a variety of methods to observe PAA progression in mice and provided the scope of application of these methods. Among them, the laparoscopic approach allowed more vivid and intuitive observation of morphological changes in the adhesion bands. Compared with open surgery, it not only significantly reduces the scope of surgical trauma and the occurrence of postoperative pain but also more closely follows the "3 R principle" of animal experiments. For this reason, we believe that it is applicable in most experiments where adhesion formation needs to be observed. Additionally, artificial pneumoperitoneum CT is more suitable for use in observational experiments involving mature adhesions.
Supplemental Material
Download PDF (510.2 KB)Acknowledgements
The manuscript has been edited for English language usage by a native English speaker with a scientific background.
Disclosure statement
No potential conflict of interest was reported by the authors.
Data availability statement
The data supporting the findings of this study are available from the corresponding author upon request.
Additional information
Funding
References
- Diamond MP, Freeman ML. Clinical implications of postsurgical adhesions. Hum Reprod Update. 2001;7(6):1–15. doi:10.1093/humupd/7.6.567.
- Alpay Z, Saed GM, Diamond MP. Postoperative adhesions: from formation to prevention. Semin Reprod Med. 2008;26(4):313–321. doi:10.1055/s-0028-1082389.[Mismatch]s
- Kraemer B, Wallwiener C, Rajab TK, Brochhausen C, Wallwiener M, Rothmund R. Standardised models for inducing experimental peritoneal adhesions in female rats. Biomed Res Int. 2014;2014:435056. doi:10.1155/2014/435056.
- Tang J, Xiang Z, Bernards MT, Chen S. Peritoneal adhesions: occurrence, prevention and experimental models. Acta Biomater. 2020;116:84–104. doi:10.1016/j.actbio.2020.08.036.
- Koninckx PR, Gomel V, Ussia A, Adamyan L. Role of the peritoneal cavity in the prevention of postoperative adhesions, pain, and fatigue. Fertil Steril. 2016;106(5):998–1010. doi:10.1016/j.fertnstert.2016.08.012.
- Saini R, Bains L, Hadke N, Koner B, Singh R, Lal P. Evaluation of oxidative stress response in endoscopic and Lichtenstein hernia repair: a randomized control study. Int J Abdom Wall Hernia Surg. 2020;3(4):148–154. doi:10.4103/ijawhs.ijawhs_33_20.
- Foster DS, Marshall CD, Gulati GS, et al. Elucidating the fundamental fibrotic processes driving abdominal adhesion formation. Nat Commun. 2020;11(1):4061. doi:10.1038/s41467-020-17883-1.
- Sarap MD, Scher KS, Jones CW. Anaerobic coverage for wound prophylaxis. Comparison of cefazolin and cefoxitin. Am J Surg. 1986;151(2):213–215. doi:10.1016/0002-9610(86)90072-3.
- Wu Y, Li E, Wang Z, et al. TMIGD1 inhibited abdominal adhesion formation by alleviating oxidative stress in the mitochondria of peritoneal mesothelial cells. Oxid Med Cell Longev. 2021;2021:9993704. doi:10.1155/2021/9993704.
- Wei G, Wang Z, Liu R, et al. A combination of hybrid polydopamine-human keratinocyte growth factor nanoparticles and sodium hyaluronate for the efficient prevention of postoperative abdominal adhesion formation. Acta Biomater. 2022;138:155–167. doi:10.1016/j.actbio.2021.10.015.
- Nair SK, Bhat IK, Aurora AL. Role of proteolytic enzyme in the prevention of postoperative intraperitoneal adhesions. Arch Surg. 1974;108(6):849–853. doi:10.1001/archsurg.1974.01350300081019.
- Wu Y, Wei G, Yu J, et al. Danhong injection alleviates postoperative intra-abdominal adhesion in a rat model. Oxid Med Cell Longev. 2019;2019:4591384. doi:10.1155/2019/4591384.
- Ward BC, Panitch A. Abdominal adhesions: current and novel therapies. J Surg Res. 2011;165(1):91–111. doi:10.1016/j.jss.2009.09.015.
- Hu Q, Xia X, Kang X, et al. A review of physiological and cellular mechanisms underlying fibrotic postoperative adhesion. Int J Biol Sci. 2021;17(1):298–306. doi:10.7150/ijbs.54403.
- Zindel J, Mittner J, Bayer J, et al. Intraperitoneal microbial contamination drives post-surgical peritoneal adhesions by mesothelial EGFR-signaling. Nat Commun. 2021;12(1):7316. doi:10.1038/s41467-021-27612-x.
- Wang GS, Zhang ZY, Qi XT, et al. The technology of artificial pneumoperitoneum CT and its application in diagnosis of abdominal adhesion. Sci Rep. 2021;11(1):20785. doi:10.1038/s41598-021-00408-1.
- Landgraf P, Rusu M, Sheridan R, et al. A mammalian microRNA expression atlas based on small RNA library sequencing. Cell. 2007;129(7):1401–1414. doi:10.1016/j.cell.2007.04.040.
- Yue Y, Yan S, Li H, Zong Y, Yue J, Zeng L. The role of oral fluvastatin on postoperative peritoneal adhesion formation in an experimental rat model. Acta Chir Belg. 2018;118(6):372–379. doi:10.1080/00015458.2018.1444549.
- Yang YL, Lee MG, Lee CC, et al. Pentoxifylline decreases post-operative intra-abdominal adhesion formation in an animal model. PeerJ. 2018;6:e5434. doi:10.7717/peerj.5434.
- Laukka M, Hoppela E, Salo J, et al. Preperitoneal fat grafting inhibits the formation of intra-abdominal adhesions in mice. J Gastrointest Surg. 2020;24(12):2838–2848. doi:10.1007/s11605-019-04425-4.
- Zeng L, Yan S, Li WL, et al. Assessment of postoperative adhesion formation in a rat cecum model using different techniques. Pak J Pharm Sci. 2015;28(3 Suppl):1049–1054.
- Moris D, Chakedis J, Rahnemai-Azar AA, et al. Postoperative abdominal adhesions: clinical significance and advances in prevention and management. J Gastrointest Surg. 2017;21(10):1713–1722. doi:10.1007/s11605-017-3488-9.
- Soltany S. Postoperative peritoneal adhesion: an update on physiopathology and novel traditional herbal and modern medical therapeutics. Naunyn Schmiedebergs Arch Pharmacol. 2021;394(2):317–336. doi:10.1007/s00210-020-01961-8.
- Fischer A, Wannemacher J, Christ S, et al. Neutrophils direct preexisting matrix to initiate repair in damaged tissues. Nat Immunol. 2022;23(4):518–531. doi:10.1038/s41590-022-01166-6.
- Capobianco A, Cottone L, Monno A, Manfredi AA, Rovere-Querini P. The peritoneum: healing, immunity, and diseases. J Pathol. 2017;243(2):137–147. doi:10.1002/path.4942.
- Fukasawa M, Campeau JD, Girgis W, Bryant SM, Rodgers KE, DiZerega GS. Production of protease inhibitors by postsurgical macrophages. J Surg Res. 1989;46(3):256–261. doi:10.1016/0022-4804(89)90067-x.
- Mori S, Tran V, Nishikawa K, et al. A dominant-negative FGF1 mutant (the R50E mutant) suppresses tumorigenesis and angiogenesis. PLoS One. 2013;8(2):e57927. doi:10.1371/journal.pone.0057927.
- Mori S, Hatori N, Kawaguchi N, et al. The integrin-binding defective FGF2 mutants potently suppress FGF2 signalling and angiogenesis. Biosci Rep. 2017;37(2):BSR20170173. doi:10.1042/BSR20170173.
- Haney AF, Doty E. The formation of coalescing peritoneal adhesions requires injury to both contacting peritoneal surfaces. Fertil Steril. 1994;61(4):767–775. doi:10.1016/s0015-0282(16)56660-6.
- Chegini N. Peritoneal molecular environment, adhesion formation and clinical implication. Front Biosci. 2002;7:e91-115–115. doi:10.2741/A911.
- Sultana T, Van Hai H, Park M, Lee SY, Lee BT. Controlled release of Mitomycin C from modified cellulose based thermo-gel prevents post-operative de novo peritoneal adhesion. Carbohydr Polym. 2020;229:115552. doi:10.1016/j.carbpol.2019.115552.
- Shen T, Wu Y, Wang X, et al. Activating SIRT3 in peritoneal mesothelial cells alleviates postsurgical peritoneal adhesion formation by decreasing oxidative stress and inhibiting the NLRP3 inflammasome. Exp Mol Med. 2022;54(9):1486–1501. doi:10.1038/s12276-022-00848-3.
- Gomez-Pinilla PJ, Binda MM, Lissens A, et al. Absence of intestinal inflammation and postoperative ileus in a mouse model of laparoscopic surgery. Neurogastroenterol Motil. 2014;26(9):1238–1247. doi:10.1111/nmo.12376.
- Long B, Robertson J, Koyfman A. Emergency medicine evaluation and management of small bowel obstruction: evidence-based recommendations. J Emerg Med. 2019;56(2):166–176. doi:10.1016/j.jemermed.2018.10.024.
- Sahputra R, Dejyong K, Woolf AS, et al. Monocyte-derived peritoneal macrophages protect C57BL/6 mice against surgery-induced adhesions. Front Immunol. 2022;13:1000491. doi:10.3389/fimmu.2022.1000491.