
 ?Mathematical formulae have been encoded as MathML and are displayed in this HTML version using MathJax in order to improve their display. Uncheck the box to turn MathJax off. This feature requires Javascript. Click on a formula to zoom.
Abstract
Introduction: The extent to which electronic cigarette users will compensate for lower nicotine eliquids has implications on the risk associated with regulating eliquid composition. This article elucidates topography as a compensatory mechanism by investigating the impact of nicotine strength on total particulate matter (TPM) and nicotine consumed per puff.
Methods: Thirty-three experienced vape pen users were assigned an NJOY™ VapePen and AVAIL™ brand Tobacco Row eliquid with their usual nicotine strength (L = 6 mg/mL, M = 12 mg/mL, H = 18 mg/mL) and vaped through RIT’s wPUMTM vape pen monitor to record every puff during 1 week. Nicotine and TPM yield per puff was determined accounting for the impact of topography characteristics on emissions and used to compute participant-specific mean yield per puff.
Results: Nicotine yields ranged from 0.01 to 0.05 mg/puff and varied widely within each group (L, M, and H nicotine strength). Group-wise mean flow rate was lower for L compared to M (p = 0.2) and duration was higher compared to M (p = 0.09). Larger TPM was consumed per puff for L compared to M (p = 0.07), yet nicotine per puff for L was less than M (p = 0.3). H users took smaller volumes than L (p = 0.1) or M (p = 0.17), and there was little difference between L and M (p = 0.47).
Conclusions: Evidence was provided for topography as a compensatory mechanism. Use of low nicotine strength eliquids can increase TPM, which can lead to increase in HPHC. Regulatory review of new products should consider natural use topography and realistic use exposures to nicotine, TPM and HPHCs.
Introduction
The population-level health effect resulting from electronic cigarettes remains a matter of controversy. Some studies report that e-cigs reduce harm associated with smoking (Hill and Camacho Citation2017; Levy et al. Citation2017; Shahab et al. Citation2017; Levy et al. Citation2018) because they reduce cigarette consumption (Etter Citation2010; Etter and Bullen Citation2011; Siegel et al. Citation2011; Adkison et al. Citation2013; Caponnetto et al. Citation2013; Etter and Bullen Citation2014; Selya et al. Citation2017) and improve cessation rates (Brown et al. Citation2014; Beard et al. Citation2019; Hajek et al. Citation2019; Jackson et al. Citation2019), (Caponnetto et al. Citation2013). Other studies report that e-cigs increase harm (Soneji et al. Citation2018), because they contain unacceptably large amounts of harmful constituents (Behar et al. Citation2018) pose significant abuse liability for never users (National Academies of Sciences Citation2018) and have not been shown effective in cessation (Kalkhoran and Glantz Citation2016) nor in reducing cigarette consumption (Grana et al. Citation2014). Variation in testing methods across studies and lack of standardized testing and reporting methods continue to hinder tobacco regulatory science research, along with the wide variety of e-cigarette products available, and the uncertainty of how product characteristics, impact user behavior.
There is a wide body of evidence that users of lower nicotine products adopt use patterns that do not result in lower nicotine exposure (Benowttz et al. Citation1983; Jarvis et al. Citation2001), NIH, (US NCI Citation2001). Hammond et al. (Citation2005) found that cigarette smokers, when switched to low-yield cigarettes, and observed in the natural environment, increased their total smoke intake per cigarette by 40% while maintaining their salivary cotinine levels. Dawkins et al. (Citation2016) found that e-cig users, when switched to a low nicotine e-liquid, and observed in a 60-min ad lib laboratory session, doubled e-liquid consumption, but were unable to maintain plasma nicotine levels. There are several additional studies reporting cigarette and e-cig users changing topography behaviors under various conditions (Farsalinos et al. Citation2013; Hua et al. Citation2013; Norton et al. Citation2014; Etter and Eissenberg Citation2015), but the variety of study conditions make it difficult to unravel which behavior mechanisms might be at play. Hiler et al. (Citation2017) found that nicotine delivery from ecigs differed across experienced and naïve individuals despite controlling for device power, liquid PG:VG ratio, and puff number, and suggested these differences may be explained by differences in user puff topography. Most studies to date involve short-term switching interventions, rather than observing natural use of their usual product. To our knowledge, observation of natural use topography of different nicotine strength users, experienced with their own product, has not been widely studied.
We propose there are a number of possible mechanisms for e-cig users to extract their desired nicotine dose from low nicotine e-liquids, as evidenced by cigarette studies (Scherer Citation1999; Scherer and Lee Citation2014) including altering the puff topography (e.g. the manner in which they draw the puff into their mouth including puff volume, puff duration, puff flow rate, interpuff gap) (Jarvis et al. Citation2001; Hammond et al. Citation2005; Marian et al. Citation2009) altering the inhalation topography (e.g. the manner in which they take the puff into their lungs including inhale and exhale volume, flow rate and breath hold) (Sutton et al. Citation1982; Tobin et al. Citation1982; Tobin and Sackner Citation1982; Robinson and Yu Citation2001; Armitage et al. Citation2004; Gower and Hammond Citation2007) and increasing their overall frequency of use (Biener and Hargraves Citation2015; Brose et al. Citation2015; Hitchman et al. Citation2015). We will hereafter refer these behaviors as compensatory mechanisms.
In this paper, we apply a new mathematical framework, based on puff-by-puff analysis of real-world behaviors (Hensel et al. Citation2019) to examine the role of nicotine strength and topography on the amount of total particulate matter (TPM) and nicotine consumed per puff. The study builds on previous work which demonstrated dependence of machine-generated e-cig emissions on topography (Robinson et al. Citation2018). We combined machine-generated emissions with field topography data from a one-week natural environment observational study (Robinson et al. Citation2018) to obtain personalized behavior-based yield characteristics of puffs taken in the natural environment. The goal was to determine if users of lower nicotine e-liquids indeed consumed a smaller mass of nicotine in each puff compared to users of higher nicotine e-liquids. In addition, we were interested to know if users of lower nicotine e-liquids consumed a higher mass of TPM in each puff compared to users of higher nicotine e-liquids, as a proxy for increasing their exposure to other non-nicotine HPHCs.
Methods
Topography characterization
Device-specific topography was determined for NJOY based on a previously conducted natural environment study (Robinson et al. Citation2018) in which 33 current regular (4 out of the past 7 days) experienced (product use history of at least 3 months) vape pen users were observed in their natural environment. Data were collected over a 6-month period between April 1 and October 1, 2016. Participants were provided with an ‘NJOY VapePen’ (NOY, Inc.) which is a pen style device having a rechargeable 1000 mAh and a 1.6 (mL) top-fill tank. The atomizer assembly is contained within the removable tank, which is refilled with e-liquid. There were no user adjustable parameters (such as power, voltage or temperature) on the ecig used. The ecig was activated by pressing a button on the side of the device. The ecig had a nominal battery voltage of 3.7 Volts. The measured resistance of the ecig coils used in the study was observed to be 2.3 ± 0.3 (95% CI) ohms. The nominal power of this device was approximately 6 [W], but this value was not measurable during natural environment deployment. Vape pens were pre-filled with Avail brand ‘Tobacco Row’ e-liquid containing one of three labeled nicotine strengths (L = 6 mg/mL, M = 12 mg/mL, H = 18 mg/mL) that best matched their usual nicotine strength.
Participants were asked to use their assigned product for the duration of the observation period and to use the RIT wPUMTM vape pen topography monitor for every vaping session to record the date, time and puff topography of every puff taken over the course of the week. The RIT TAPTM topography analysis program was used to identify and analyze the topography characteristics of individual puffs (flow rate, volume, and duration) and provide descriptive statistics by puff, session, participant and group. Thirty-three of the 34 subjects completed the week of tobacco flavor use. One participant did not like the assigned ‘Tobacco Row’ flavor and did not provide any topography.
Device and E-liquid characterization
The NJOY was characterized over 85% of the range of topographies for the 34 participants, using a previously validated PES1TM emission system with closed-loop feedback to control flow rate, and experimentally validated puff volumes (Hensel et al. Citation2018) to compute aerosol mass concentration (CTPM). CTPM was determined for topography conditions ranging in flow rate from 10 to 55 mL/s and ranging in duration from 1 to 7.5 s, with six repeated trials (Hensel et al. Citation2019).
Linear regression was applied to derive a closed-form equation for TPM as a function of flow rate and puff duration. A closed-form equation for NJOY based on the empirical emissions characterization is given by
(1)
(1)
where qpuff and dpuff are the puff flow rate and duration, respectively, α1=9.51 (p < 0.0001), α2=1.31 (p = 0.0283), α3=0.449 (p < 0.0001), α4=0.582 (p < 0.0001), α5=1.77 (p < 0.0001), α6=0.00722 (p < 0.0001). EquationEquation (1)
(1)
(1) was applied for flow rates from 0 to 55 mL/s and durations of 0 to 7.5 s. For the purposes of this study, in which the observed user topography extended beyond the empirical model domain, the NJOY emissions characterization model was extended using linear interpolation. The region was divided into three areas and one equation form was derived for each area. Area one had a linear decay with dpuff as the independent variable. Area two had a linear decay with qpuff as the independent variable. Area three had a bilinear decay with both qpuff and dpuff as independent variables. The slope was chosen to ensure that all curves vanished to zero at the boundaries specified by qpuff=90 mL/s and dpuff=20 s and the intercept was chosen to ensure the function was continuous at the edge of the experimental emissions domain.
The nicotine mass ratio, fNIC, was modeled as a bi-linear function of puff flow rate and the concentration of nicotine in the un-puffed eliquid, ρeliquid. Empirical estimates of β1 and β2 were determined experimentally using GC-MS as previously described (Hensel et al. Citation2019) and were scaled in direct proportion to ρeliquid:
(2)
(2)
The coefficients β1 and β2 in EquationEquation (2)(2)
(2) were estimated as β1=0.009809 (p < 0.00001) and β2= −0.000005 (p = 0.0283) for the high nicotine strength eliquid, ρH, using GC-MS as previously described (Hensel et al. Citation2019). A colleague measured the nicotine concentration in each un-puffed eliquid, ρeliquid, and found them experimentally to be consistent with the labeled concentrations: ρL=6 mg/mL, ρM=12 mg/mL, and ρH=18 mg/mL. GC-MS analyses of fNIC were conducted on 82 emissions samples generated from H strength e-liquids across flow rates ranging from 10 to 60 (mL/s) and puff duration from 1.2 to 7.5 (s). We confirmed the mass ratio of nicotine via LC-MS analyses of the H, M, and L strength un-puffed eliquids to confirm that our experimental observations of fNIC linearly scaled with the ratio ρeliquid/ρH.
Personalized nicotine and total particulate matter yield
Personalized yields for TPM and nicotine were determined for every puff taken by the participants using a novel mathematical framework. The framework, validated previously (Hensel et al. Citation2019), inherently incorporates the combined effect of device-specific user topography and the impact of topography on device-specific emissions to obtain yields that would naturally occur under realistic (non-machine) testing conditions. The equations are briefly described below.
A user can change the aerosol mass concentration by altering their puff flow rate or puff duration, as shown in EquationEquation (1)(1)
(1) and . Thus, the topography of each puff was used to determine the aerosol mass concentration of that puff, CTPM (qpuff, dpuff). The total mass consumed in each puff was determined by multiplying the volume of aerosol in each puff (vpuff) by the mass per unit volume contained within the puff (CTPM). The total mass consumed in each puff is referred to as TPM yield or YTPM and can be written mathematically as,
(3)
(3)
where YTPM has units of (mg/puff), vpuff has units of (mL/puff), and CTPM has units of (mg/mL). CTPM was determined for each puff having flow rate, qpuff, and puff duration, dpuff, using the empirically derived emissions surface for NJOY (EquationEquation (1)
(1)
(1) ; ).
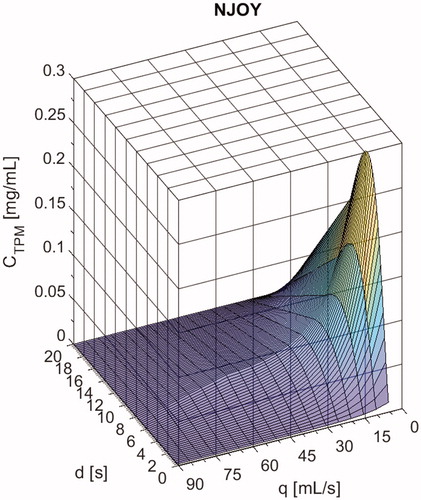
Figure 1. NJOY VapePen emissions characterization curve for total particulate matter (TPM) concentration, CTPM (mg/mL) as a function of puff flow rate, qpuff (mL/s) and duration, dpuff (s).
EquationEquation (3)(3)
(3) was evaluated for each puff and averaged over all puffs, Npuff, taken by each user to determine participant-mean TPM yield,
(4)
(4)
The mass of nicotine consumed in each puff depends on the TPM yield, and therefore is also a function of topography. The mass of nicotine consumed in each puff is referred to as nicotine yield or YNIC and was calculated by multiplying TPM yield by the experimentally determined nicotine mass ratio (fNIC). Written mathematically, nicotine yield is
(5)
(5)
where YNIC has units of mg/puff and fNIC is unitless and determined from EquationEquation (2)
(2)
(2) for each eliquid having L, M, and H nicotine strengths. EquationEquation (5)
(5)
(5) was evaluated for each puff and averaged over all puffs taken by each user to determine participant-mean nicotine yield,
(6)
(6)
The model was validated experimentally by using natural environment topographies from user vaping sessions to program the emissions system and collect emissions samples. We previously reported (Hensel et al. Citation2019) experimental validation of the mathematical model demonstrated sufficient predictive utility, with a correlation between model predictions and experimental data of R2=0.58 for YTPM and R2=0.71 for YNIC.
Analysis
The TAPTM analytics program was used to calculate descriptive and inferential statistics. Participant-mean TPM and nicotine yields and the 95% confidence intervals on the means were determined for each of the participants. Group-mean TPM and nicotine yields for were determined for L, M, and H nicotine strength groups with 95% confidence interval on the means.
To investigate topography as a compensation mechanism, we tested hypothesis H1: Lower compared to higher nicotine strength users exhibit (i) lower puff flow rates (qL < qM < qH), (ii) longer puff durations (dL > dM > dH), and (iii) larger puff volumes (vL > vM > vH). To assess the influence of nicotine strength on reduced nicotine exposure, we tested hypothesis H2: Higher nicotine strength users have higher nicotine yields per puff compared to lower nicotine strength users (YNIC,H > YNIC,M > YNIC,L). Using TPM yield as a proxy for increased harm arising from compensatory behavior, we tested hypothesis H3: Lower nicotine strength users have higher TPM yields per puff compared to higher nicotine strength users (YTPM,L > YTPM,M > YTPM,H). All tests were between groups one-sided t tests (α = 0.10).
Results
Emissions characterization for NJOY
The three-dimensional emissions characterization plot for NJOY, provides the TPM concentration as a function of puff flow rate and duration (shown in ). The plot is based on the empirically derived model (EquationEquation 1(1)
(1) ) between 0 and 7.5 s duration and 0–55 ml/s puff flow rate. CTPM approaches zero beyond the range of the empirical model and shown here is the result of our linear interpolation curve used to approximate CTPM beyond the model range to accommodate the range of user behaviors observed for the 33 subjects. About 19% of puffs had characteristics in the linear interpolated region and due to the low emissions in this region, the incremental contribution of these puffs to personalized TPM yield was small. Nicotine mass ratio was found to be a weak function of topography for NJOY with Avail Tobacco Row eliquid and therefore the plot is not shown.
As seen in , CTPM emissions for NJOY are jointly dependent on puff flow rate and puff duration. The dependence on duration is greater at lower flow rates, where the curve peaks at 0.26 for 7.5 mL/s flow rate and 4.25 s duration and decreases for longer durations and higher flow rates. This phenomenon may be associated with wicking and will be e-liquid dependent (PG:VG ratio) and device dependent (operating power, coil location, flow path) based on the design of the eliquid supply to the coil. As the puff duration increases for a given flow rate, the aerosol may become more concentrated with eliquid droplets, but at some critical duration the wick is depleted and can no longer maintain the supply of eliquid to the coil. The critical duration effect diminishes at higher flow rates where aerosolization effectiveness is much lower and the wick has more time to replenish.
Topography use behavior for NJOY
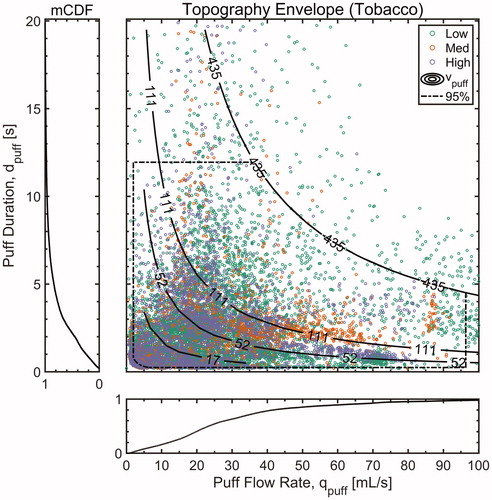
shows a topography map of all puffs taken by the thirty-three users over the course of one week as a function of puff flow rate and duration. A total of 10,156 puffs are shown with different colored markers for different nicotine strength eliquids (n = 6427 puffs for L, n = 1332 puffs for M and n = 2397 puffs for H). Puffs were analyzed to determine the empirical probability density function (PDF), which was then integrated to determine the marginal CDF of puff flow rate, puff duration and puff volume. The marginal CDF for puff flow rate is shown along the horizontal axis and for duration along the vertical axis. Lines of constant puff volume are superimposed on the main panel. The mCDFs indicate that 95% of puffs had puff durations between approximately 1 and 5.5 s, 95% of the puffs had flow rates between approximately 10–50 mL/s, and 95% puffs had puff volumes between 2 and 435 mL. The mCDFs define the topography envelope which encompasses approximately 93% of puffs and confirm that the previously generated emissions curve for NJOY appropriately represented natural use behavior.
Figure 2. NJOY VapePen topography map showing the puff flow rate, qpuff (mL/s), and puff duration, dpuff (s), for every puff taken by thirty-three users of high, medium and low nicotine strength eliquids over the course of 1 week in the natural environment. The marginal cumulative distribution function (mCDF) is plotted in the bottom panel for flow rate and in the left panel for duration. Lines of constant volume (mL) are superimposed on the main panel for puff volumes for mCDF values of 25% (17 mL), 50% (52 mL), 75% (111 mL), and 97.5% (435 mL). The dotted black line represents the topography envelope, drawn to include 95% of puff flow rates, durations, and volumes observed.
Participants used a variety of topographies to achieve their nicotine yields. The participant-specific mean flow rates, durations and volumes were previously published (Robinson et al. Citation2018), and included in Supplementary Table S1, along with users’ nicotine level. Group-wise means for L, M, and H users are shown in . Power was insufficient to confirm differences in group-wise behavior. For L users compared to M users, puff flow rates were smaller (p = 0.20), puff durations were longer (p = 0.09), and puff volumes were about the same (p = 0.47).
Table 1. Group-wise mean topography, per-puff TPM yield, and per-puff nicotine yield resulting from puff-by-puff analysis.
H users took smaller puff volumes compared to M users (p = 0.17) and L users (p = 0.1) and exhibited smaller flow rates compared to M users (p = 0.15) and L users (p = 0.22). There was little difference in duration between H users compared to M or L users.
TPM yield and nicotine yield for NJOY based on puff-by-Puff analysis
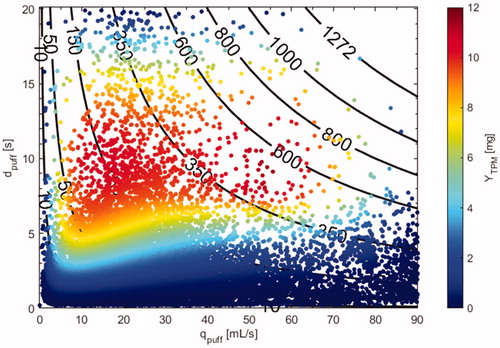
shows a color-coded scatter plot of TPM yield per puff based on a puff-by-puff analysis incorporating puff topography and CTPM (EquationEquation 3(3)
(3) ) for every puff taken by the thirty-three users over the course of 1 week. Lines of constant puff volume are superimposed on the plot clearly illustrating how users achieved higher TPM yields per puff for the same puff volume by adjusting their puff duration and puff flow rate. For example, for the same puff volume of 350 mL, users were able to achieve TPM yields per puff ranging from 1 mg per puff to 11.5 mg per puff. The scatter plot shows that even for a given nicotine strength eliquid, there is wide range of TPM yield per puff, and reinforces the need to determine personalized TPM and nicotine yield using the characteristics and composition of each puff taken by each user.
Figure 3. NJOY VapePen TPM yield map, YTPM (mg/puff), showing the puff flow rate, duration and volume associated with every puff taken by 33 users over the course of 1 week in the natural environment. Constant puff volume lines (mL) are superimposed on the plot and have units of mL. YTPM is contoured by magnitude.
The participant-specific mean TPM and nicotine yields per puff, determined from EquationEquations (5)(5)
(5) and Equation(6)
(6)
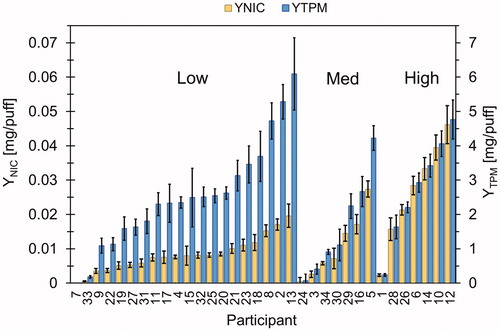
(6) , respectively, are shown in with 95% confidence intervals on the mean. Data were grouped by the users’ nicotine level and sorted from low to high yield within each group. The data show a wide range of yield for each group with considerable overlap in both YNIC and YTPM between groups. In some cases, L users were able achieve the same mean nicotine yield per puff as M users by adjusting their mean TPM yield per puff. But L users were unable to achieve mean nicotine yields per puff at levels comparable to H users, despite having consumed on average much more TPM yield per puff than H users. For example, the highest nicotine yield per puff achieved by an L user (participant 13) was still much lower (57%, p < 0.0001) than the highest nicotine yield per puff achieved by an H user (participant 12), despite the L user consuming more average TPM yield per puff (27%, p = 0.009).
Figure 4. Participant-specific mean yields from puff-by-puff analysis of week-long behavior. Mean nicotine yield per puff, YNIC (mg/puff) is shown on the left axis. Total particulate matter (TPM) yield per puff, YTPM (mg/puff) is shown on the right axis. Data are grouped be nicotine strength users, low, medium, and high, and sorted by magnitude from left to right. Bars are 95% CI on the mean for each participant.
Group mean TPM and nicotine yields are given in for L, M, and H users. We conducted between-groups comparisons to assess the impact of nicotine strength on exposure to TPM and nicotine. Data show L users were exposed to larger TPM yields per puff compared to M users (p = 0.07). H users were exposed to larger TPM yields per puff than M users (p = 0.1) but not L users (p = 0.54). Data show L users consume less nicotine per puff than M users (p = 0.3) and M users consume less nicotine per puff than H users (p = 0.02).
Discussion
This article aimed to provide insight into potential compensatory mechanisms employed by current regular experienced vape pen users who choose to consume lower nicotine strength eliquids. The data clearly show that consuming low nicotine strength eliquid does not ensure lower nicotine exposure and may result in exposure to higher levels of other harmful constituents. Some lower nicotine strength eliquid users were able to achieve the same mass of nicotine per puff as users of higher nicotine strength eliquids, and by doing so consumed significantly more total particular matter. Data from this study are reminiscent of pioneering studies that revealed users of low nicotine combustible cigarettes did not consume less nicotine (Benowttz et al. Citation1983), and may justify a concern that, like low yield combustible cigarettes, a reduced health effect may not be realized by switching from high to low nicotine eliquids (US NCI Citation2001).
In the face of lower nicotine strength eliquids, users can theoretically increase their nicotine consumption by increasing the amount of nicotine in each puff. There are at least two mechanisms by which users can increase the amount of nicotine in each puff; one is to increase the puff volume and the other is to increase the aerosol mass concentration (CTPM), which can be achieved for NJOY by decreasing puff flow rate or increasing puff duration (until max optimum duration).
Based on these data, the compensatory mechanisms for NJOY appear to be a combination of increasing puff volume and increasing the aerosol mass concentration and are highly user-dependent. The TPM yield envelope provided clear evidence that users altered their aerosol mass concentration by changing their puff flow rate and puff duration and thus users achieved more or less TPM for the same puff volumes. Data further show that even for a given nicotine strength eliquid, variations in puff topography resulted in a wide range of TPM and nicotine yield per puff.
The emission surface plot for NJOY VapePen provides supporting evidence as to why and how users would alter their topography in order to achieve the desired level of nicotine. For NJOY VapePen, the amount of TPM per unit puff volume increases with decreasing puff flow rate and with increasing puff duration to a point, after which concentration decreased. Results presented here are specific for NJOY VapePen and should not be generalized to other electronic cigarettes without further study. However, the construction details of the NJOY appear similar to the Standardized Research E-Cigarette (SREC) developed by NJOY under a small business innovative research (SBIR) project with the National Institutes of Health. Thus, the findings of this study are anticipated to be valuable to future researchers who may employ the SREC or similar pen-style ecigs in experiments or as baseline for comparison with contemporary ecig designs. In addition, pod-style, cigalike, and box mod emissions were previously shown to be a function of topography (Robinson et al. Citation2018), and so are also expected to provide the opportunity for users to compensate their behavior in the face of different nicotine strength eliquids.
The current analysis is limited by lack of use history regarding participants’ current nicotine strength eliquid, valuable information that would add context to compensatory puffing behaviors. In addition, participants were not assessed for nicotine dependence scores which may help explain the spread in results presented here and limited the power of some group-wise comparisons.
The puff-by-puff framework described in this article provides the unique ability to assess cumulative personalized yield from natural environment topography data and lays the groundwork for future studies aimed to better understand and anticipate the behavior of users who may be required to adjust to lower nicotine eliquids. In this article, we focused on topography as a compensation mechanism, but in addition to taking larger more concentrated puffs, users could also achieve higher nicotine exposure by taking more puffs per day. The frequency of use factor will compound the effect of the compensatory mechanisms described in this paper which can be further studied by applying the framework presented here. Furthermore, the framework can be extended for a given topography data set to investigate the increased risk from other potentially harmful constituents such as flavorants and aldehydes produced from thermal degradation of the base eliquid. If consumers are compensating to achieve their desired nicotine levels by consuming more TPM, the risk of exposure to harmful levels of other constituents must be considered for meaningful risk assessment.
Conclusion
Topography, emissions, and yield for NJOY were characterized based on natural environment behavior for high, medium, and low nicotine strength users. Results suggest that our hypothesis was reasonable; higher nicotine users consume more nicotine, and lower nicotine users consume more TPM, although the observations did not provide sufficient power to establish significance of the effect for all comparisons. There was sufficient evidence to support topography as a potential compensation mechanism for electronic cigarette users. Further work is warranted to assess the compounding effect of topography and consumption on compensation (i.e. frequency of use in addition to the per-puff yield) and the effect of compensation on exposure to other harmful constituents.
The framework illustrated in this article provides a means to account for puff-by-puff variations in use behavior and the impact of product characteristics on topography, emissions, consumption, and yield. Because a wide range of puff topographies and yields occur in the natural use environment, one standardized topography for machine emissions is insufficient to assess risk. It is essential that emissions test results submitted for new product regulatory review be conducted across the range of user puff flow rate, duration, and volume which may be employed by users of the product. Further, because users can alter their exposure by adjusting their topography, new product regulatory review must consider exposure resulting from natural use behavior. Lowering the nicotine in e-liquids may not result in lower risk products. Exposure to both nicotine and TPM are important in risk assessment, and the potential to inadvertently increase one by decreasing the other must be considered in product regulation.
Natural use behavior should be considered for meaningful risk assessment of the impact of product characteristics on health effect. After accounting for natural use behavior, low nicotine e-liquids may not result in lower-risk products.
Acknowledgements
Dr. Nathan C. Eddingsaas conducted the analysis on the unpuffed e-liquids and coauthored previously reported results for nicotine mass ratio presented in EquationEquation (2)(2)
(2) .
Disclosure statement
No potential conflict of interest was reported by the authors.
Additional information
Funding
References
- Adkison SE, O'Connor RJ, Bansal-Travers M, Hyland A, Borland R, Yong H-H, Cummings KM, McNeill A, Thrasher JF, Hammond D, et al. 2013. Electronic nicotine delivery systems: international tobacco control four-country survey. Am J Prev Med. 44(3):207–215.
- Armitage AK, Dixon M, Frost BE, Mariner DC, Sinclair NM. 2004. The effect of inhalation volume and breath-hold duration on the retention of nicotine and solanesol in the human respiratory tract and on subsequent plasma nicotine concentrations during cigarette smoking. Beiträge Zur Tabakforschung International/Contrib Tobacco Res. 21(4):240–249.
- Beard E, West R, Michie S, Brown J. 2019. Association of prevalence of electronic cigarette use with smoking cessation and cigarette consumption in England: a time series analysis between 2006 and 2017. Addiction. doi:10.1111/add.14851
- Behar RZ, Luo W, McWhirter KJ, Pankow JF, Talbot P. 2018. Analytical and toxicological evaluation of flavor chemicals in electronic cigarette refill fluids. Sci Rep. 8(1):8288.
- Benowttz N, Hall SMP, Herning RIP, Jacob P, Jones R, Osman A-L. 1983. Smokers of low-yield cigarettes do not consume less nicotine. N Engl J Med. 309(3):139–142.
- Biener L, Hargraves JL. 2015. A longitudinal study of electronic cigarette use among a population-based sample of adult smokers: association with smoking cessation and motivation to quit. Nicotine Tob Res. 17(2):127–133.
- Brose LS, Hitchman SC, Brown J, West R, McNeill A. 2015. Is the use of electronic cigarettes while smoking associated with smoking cessation attempts, cessation and reduced cigarette consumption? A survey with a 1-year follow-up. Addiction. 110(7):1160–1168.
- Brown J, Beard E, Kotz D, Michie S, West R. 2014. Real-world effectiveness of e-cigarettes when used to aid smoking cessation: a cross-sectional population study. Addiction. 109(9):1531–1540.
- Caponnetto P, Campagna D, Cibella F, Morjaria JB, Caruso M, Russo C, Polosa R. 2013. Efficiency and safety of an electronic cigarette (ECLAT) as tobacco cigarettes substitute: a prospective 12-month randomized control design study. PLoS One. 8(6):e66317.
- Dawkins LE, Kimber CF, Doig M, Feyerabend C, Corcoran O. 2016. Self-titration by experienced e-cigarette users: blood nicotine delivery and subjective effects. Psychopharmacology. 233(15–16):2933–2941.
- Etter JF. 2010. Electronic cigarettes: a survey of users. BMC Public Health. 10(1):231.
- Etter JF, Bullen C. 2011. Electronic cigarette: users profile, utilization, satisfaction and perceived efficacy. Addiction. 106(11):2017–2028.
- Etter JF, Bullen C. 2014. A longitudinal study of electronic cigarette users. Addict Behav. 39(2):491–494.
- Etter J-F, Eissenberg T. 2015. Dependence levels in users of electronic cigarettes, nicotine gums and tobacco cigarettes. Drug Alcohol Depend. 147:68–75.
- Farsalinos KE, Romagna G, Tsiapras D, Kyrzopoulos S, Voudris V. 2013. Evaluation of electronic cigarette use (vaping) topography and estimation of liquid consumption: implications for research protocol standards definition and for public health authorities’ regulation. IJERPH. 10(6):2500–2514.
- Gower S, Hammond D. 2007. CSP deposition to the alveolar region of the lung: implications of cigarette design. Risk Anal. 27(6):1519–1533.
- Grana RA, Popova L, Ling PM. 2014. A longitudinal analysis of e-cigarette use and smoking cessation. JAMA Intern Med. 174(5):812–813.
- Hajek P, Phillips-Waller A, Przulj D, Pesola F, Myers Smith K, Bisal N, Li J, Parrott S, Sasieni P, Dawkins L, et al. 2019. A randomized trial of E-cigarettes versus nicotine-replacement therapy. N Engl J Med. 380(7):629–637.
- Hammond D, Fong GT, Cummings KM, Hyland A. 2005. Smoking topography, brand switching, and nicotine delivery: results from an in vivo study. Cancer Epidemiol Biomark Prev. 14(6):1370–1375.
- Hensel EC, Eddingsaas NC, DiFrancesco AG, Jayasekera S, O’Dea S, Robinson RJ. 2019. Framework to estimate total particulate mass and nicotine delivered to E-cig users from natural environment monitoring data. Sci Rep. 9(1);8752.
- Hensel EC, Jayasekera S, Robinson RJ. 2018. Accounting for effects of system dynamics to improve accuracy of emissions reported in e-cig vaping machines. Inhal Toxicol. 30:343–353.
- Hiler M, Breland A, Spindle T, Maloney S, Lipato T, Karaoghlanian N, Shihadeh A, Lopez A, Ramoa C, Eissenberg T. 2017. Electronic cigarette user plasma nicotine concentration, puff topography, heart rate, and subjective effects: influence of liquid nicotine concentration and user experience. Exp Clin Psychopharmacol. 25(5):380–392.
- Hill A, Camacho OM. 2017. A system dynamics modelling approach to assess the impact of launching a new nicotine product on population health outcomes. Regul Toxicol Pharmacol. 86:265–278.
- Hitchman SC, Brose LS, Brown J, Robson D, McNeill A. 2015. Associations between E-cigarette type, frequency of use, and quitting smoking: findings from a longitudinal online panel survey in Great Britain. NICTOB. 17(10):1187–1194.
- Hua M, Yip H, Talbot P. 2013. Mining data on usage of electronic nicotine delivery systems (ENDS) from YouTube videos. Tob Control. 22(2):103–106.
- Jackson SE, Kotz D, West R, Brown J. 2019. Moderators of real-world effectiveness of smoking cessation aids: a population study. Addiction. 114(9):1627–1638.
- Jarvis MJ, Boreham R, Primatesta P, Feyerabend C, Bryant A. 2001. Nicotine yield from machine-smoked cigarettes and nicotine intakes in smokers: evidence from a representative population survey. JNCI. 93(2):134–138.
- Kalkhoran S, Glantz SA. 2016. E-cigarettes and smoking cessation in real-world and clinical settings: a systematic review and meta-analysis. Lancet Respir Med. 4(2):116–128.
- Levy DT, Borland R, Lindblom EN, Goniewicz ML, Meza R, Holford TR, Yuan Z, Luo Y, O’Connor RJ, Niaura R, et al. 2018. Potential deaths averted in USA by replacing cigarettes with e-cigarettes. Tob Control. 27(1):18–25.
- Levy DT, Borland R, Villanti AC, Niaura R, Yuan Z, Zhang Y, Meza R, Holford TR, Fong GT, Cummings KM, et al. 2017. The application of a decision-theoretic model to estimate the public health impact of vaporized nicotine product initiation in the United States. NICTOB. 19(2):149–159.
- Marian C, O’Connor RJ, Djordjevic MV, Rees VW, Hatsukami DK, Shields PG. 2009. Reconciling human smoking behavior and machine smoking patterns: implications for understanding smoking behavior and the impact on laboratory studies. Cancer Epidemiol Biomark Prev. 18(12):3305–3320.
- National Academies of Sciences. 2018. Public health consequences of e-cigarettes. Washington, DC: The National Academies Press.
- Norton KJ, June KM, O’Connor RJ. 2014. Initial puffing behaviors and subjective responses differ between an electronic nicotine delivery system and traditional cigarettes. Tob Induced Dis. 12(1):17. English.
- Robinson RJ, Eddingsaas NC, DiFrancesco AG, Jayasekera S, Hensel EC. Jr. 2018. A framework to investigate the impact of topography and product characteristics on electronic cigarette emissions. Plos One. 13(11):e0206341.
- Robinson RJ, Hensel EC, Al-Olayan AA, Nonnemaker JM, Lee YO. 2018. Effect of e-liquid flavor on electronic cigarette topography and consumption behavior in a 2-week natural environment switching study. PLoS One. 13(5):e0196640.
- Robinson RP, Yu C. 2001. Deposition of cigarette smoke particles in the human respiratory tract. 34:202–215.
- Scherer G. 1999. Smoking behaviour and compensation: a review of the literature. Psychopharmacology. 145(1):1–20.
- Scherer G, Lee PN. 2014. Smoking behaviour and compensation: a review of the literature with meta-analysis. Regul Toxicol Pharmacol. 70(3):615–628.
- Selya AS, Dierker L, Rose JS, Hedeker D, Mermelstein RJ. 2017. The role of nicotine dependence in E-cigarettes’ potential for smoking reduction. Nicotine Tob Res. 20:1272–1277.
- Shahab L, Goniewicz ML, Blount BC, Brown J, McNeill A, Alwis KU, Feng J, Wang L, West R. 2017. Nicotine, carcinogen, and toxin exposure in long-term E-cigarette and nicotine replacement therapy users: a cross-sectional study. Ann Intern Med. 166(6):390–400.
- Siegel MB, Tanwar KL, Wood KS. 2011. Electronic cigarettes as smoking-cessation tool: results of an online survey. Am J Prev Med. 40:472–475.
- Soneji SS, Sung H-Y, Primack BA, Pierce JP, Sargent JD. 2018. Quantifying population-level health benefits and harms of e-cigarette use in the United States. Plos One. 13(3):e0193328.
- Sutton SR, Russell MA, Iyer R, Feyerabend C, Saloojee Y. 1982. Relationship between cigarette yields, puffing patterns, and smoke intake: evidence for tar compensation? Br Med J. 285(6342):600–603.
- Tobin MJ, Jenouri G, Sackner MA. 1982. Subjective and objective measurement of cigarette smoke inhalation. CHEST. 82(6):696–700.
- Tobin MJ, Sackner MA. 1982. Monitoring smoking patterns of low and high tar cigarettes with inductive plethysmography. Am Rev Respir Dis. 126(2):258–264.
- US NCI. 2001. Risks associated with smoking cigarettes with low machine-measured yields of tar and nicotine. Bethesda, MD: U.S. Department of Health and Human Services, Public Health Service, National Institutes of Health, National Cancer Institute.