
Abstract
Aim: The cardiovascular toxicity of unheated and heated flavorants and their products as commonly present in electronic cigarette liquids (e-liquids) was evaluated previously in vitro. Based on the results of in vitro assays, cinnamaldehyde, eugenol, menthol, and vanillin were selected to conduct a detailed chemical analysis of the aerosol generated following heating of each compound both at 250 and 750 °C. Materials and Methods: Each flavoring was heated in a drop-tube furnace within a quartz tube. The combustion atmosphere was captured using different methods to enable analysis of 308 formed compounds. Volatile organic compounds (VOCs) were captured with an evacuated Summa canister and assayed via gas chromatography interfaced with mass spectrometry (GC–MS). Carbonyls (aldehydes and ketones) were captured using a 2,4-dinitrophenylhydrazine (DNPH) cartridge and assayed via a high-performance liquid chromatography-ultra-violet (HPLC-UV) assay. Polyaromatic hydrocarbons (PAHs) were captured using an XAD cartridge and filter, and extracts were assayed using GC–MS/MS. Polar compounds were assayed after derivatization of the XAD/filter extracts and analyzed via GC–MS. Conclusion: At higher temperature, both cinnamaldehyde and menthol combustion significantly increased formaldehyde and acetaldehyde levels. At higher temperature, cinnamaldehyde, eugenol, and menthol resulted in increased benzene concentrations. At low temperature, all four compounds led to higher levels of benzoic acid. These data show that products of thermal degradation of common flavorant compounds vary by flavorant and by temperature and include a wide variety of harmful and potentially harmful constituents (HPHCs).
Introduction
Many tobacco products are flavored to enhance palatability and appeal. Market research has shown that flavorings increase the sale of tobacco products and appeal to specific demographics of tobacco users, particularly youth (Courtemanche et al. Citation2017). Although most flavorings are FDA approved and formally are generally regarded as safe (GRAS) for ingestion, these flavors are not FDA approved for inhalation after heating/burning, and thus, are not GRAS under these conditions. Therefore, additional research is needed to evaluate the toxicological effects of aerosols derived from heated and burned flavors to assess whether these additives generate toxic thermal degradation products (Hess et al. Citation2017; Tegin et al. Citation2018).
Previous work has evaluated in vitro cardiovascular toxicity of parent and products of heated flavorants commonly present in electronic cigarette liquids (Benowitz and Burbank Citation2016; Nystoriak et al. Citation2019). In this work, four key flavorants commonly found in electronic cigarette liquids (cinnamaldehyde, eugenol, menthol, and vanillin) and other tobacco products were selected for a detailed chemical analysis of the aerosols generated following heating of the compounds. The overall goal of this project was to identify and quantify the chemical products generated due to thermal degradation. The evaluation was conducted at a low (250 °C) and high (750 °C) temperature. The low temperature was selected from current patent literature for electronic cigarettes (White Citation2000) and the high temperature was based on the temperature of combustion from a cigarette (Nayir et al. Citation2016). In this manner, the complete chemical analysis was performed over the range of temperatures these flavorants would be exposed to in a wide range of tobacco products.
The results of this project provide comprehensive data identifying chemicals that are formed solely from thermal degradation of commonly used flavors as well as quantifying the extent to which these chemicals are generated upon pyrolysis and/or oxidation of flavor chemicals. Thus, this study provides novel information about the chemicals generated from the thermal degradation of commonly used tobacco product flavorings. Moreover, the study provides detailed methodology regarding conditions used in the forced degradation experiments and the collection and analytical approaches used in identification and quantitation of the degraded products of the flavorant-derived aerosols.
Materials and methods
Flavorant heating
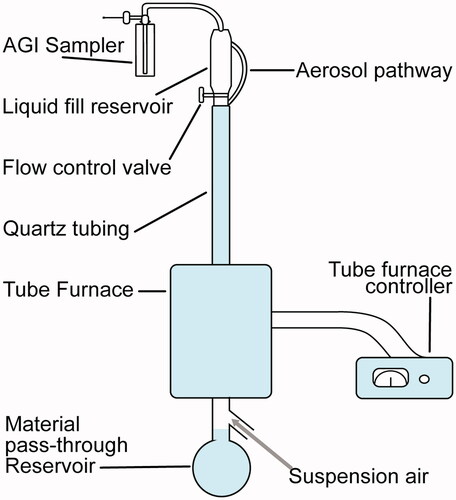
The four key flavorants of interest (; cinnamaldehyde, eugenol, menthol, and vanillin) were obtained in a pure solution (Sigma-Aldrich, St. Louis, MO) and were heated (without dilution or mixing) in a drop-tube furnace () within a quartz tube (1 in ID × 4 ft length) to 250 C (±50 C; low temperature) and 750 C (±50 C; high temperature). The suspension air flow rate in the tube was set to 1.5 L/min to allow for the suspension of combustion products without interfering with atmosphere generation. Each flavorant was loaded into the liquid fill reservoir with a clean system. A nominal feed rate of 0.5–1.0 mL of each flavoring (pure flavorant) was introduced dropwise into the system. Samples were collected at the top of the system (shown as the AGI sampler in ). The sampling parameters were modulated based on each collection system. Specifically, all glass impingers for total particulate matter were collected at 5 L/min in 55% ethanol, XAD, and 2,4-dinitrophenylhydrazine (DNPH) cartridges were collected at ∼0.5 L/min and summa canisters were filled at ∼0.5 L/min. The material pass-through reservoir at the bottom of the system was used to collect the liquid flavorant that did not vaporize and was used to quantify the efficiency.
Figure 1. Structures of the parent compounds, cinnamaldehyde (A), eugenol (B), menthol (C), and vanillin (D).
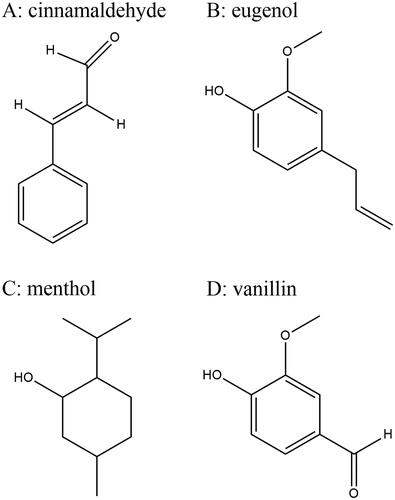
Figure 2. Diagram of the drop-tube furnace within a quartz tube used to heat flavorants.
Sample collection
The atmosphere was captured using different methods to enable analysis of an array of potential chemicals. Samples were collected using: (1) evacuated Summa canisters to collect volatile organic compounds (VOCs); (2) DNPH cartridges to capture carbonyls (aldehydes and ketones); (3) XAD cartridges and filters to capture polyaromatic hydrocarbons (PAHs) and other polar compounds. Summa canisters, DNPH cartridges, and XAD cartridges and filters were sent to the Organic Analytical Laboratory of Desert Research Institute (Reno, NV) for analysis and quantification of 308 individual compounds.
VOC analysis
Canister samples were analyzed for 72 VOC species using (gas chromatography interfaced with mass spectrometry [GC–MS]) according to EPA Method TO-15 (U.S. EPA Citation1999). The GC–MS-FID system includes a Lotus Consulting Ultra-Trace Toxics sample preconcentration system built into a Varian 3800 gas chromatograph with flame ionization detector (FID) and a Varian Saturn 2000 ion trap mass spectrometer. The Lotus preconcentration system consists of three traps. Mid and heavier weight hydrocarbons are trapped on the front trap consisting of 1/8 ‘nickel tubing packed with multiple adsorbents. Trapping is performed at 55 °C and eluting is performed at 200 °C. The rear traps consist of two traps: empty 0.040’ ID nickel tubing for trapping light hydrocarbons and a cryo-focusing trap for mid and higher weight hydrocarbons isolated in the front trap. The cryo-focusing trap is built from 6′×1/8ʺ nickel tubing filled with glass beads. Trapping of both rear traps occurs at −180 °C and eluting at 200 °C. Light hydrocarbons are deposited to a Varian CP-Sil5 column (15 m ×0.32 mm × 1 μm) plumbed to a column-switching valve in the GC oven, then to a Chrompack Al2O3/KCl column (25 m × 0.53 mm × 10 μm) leading to the FID for quantitation of light hydrocarbons. The mid-range and heavier hydrocarbons cryo-focused in the rear trap are deposited to a J&W DB-1 column (60 m × 0.32 mm × 1 μm) connected to the ion trap mass spectrometer. The GC initial temperature is 5 °C held for approximately 9.5 min, then ramps at 3 °C/min to 200 °C for a total run time of 80 min.
Carbonyl (aldehyde/ketone) analysis
DNPH cartridges were eluted within 2 d after delivery and analyzed within 10 d following US-EPA TO-11A method (U.S.EPA 1997). Briefly, an aliquot of the eluent is transferred into a 2-mL septum vial and injected with an autosampler into a high-performance liquid chromatograph (Waters 2690 Alliance System with 996 Photodiode Array Detector (PDA), Waters, Milford, MA, USA) for separation and quantitation of the hydrazones. Since our HPLC system is equipped with the PDA, the identification of carbonyl compounds is much more accurate than with standard UV/VIS detector. The PDA also enhances the sensitivity of the method. Our current HPLC method requires: Polaris C18-A 3 µm 100 × 2.0 mm HPLC column (Agilent, Palo Alto, CA, USA), flow 0.2 mL/min, injection volume 2 µL, solvent A: water, solvent B: acetonitrile. The HPLC program is: 50% A, 50% B for 10 min, 30% A and 70% B for 8 min, and 100% B for 1 min. Run time: 31 min. The HPLC response is calibrated with certified calibration mixture purchased from AccuStandard. Five-point external calibration is run prior to analysis, and one calibration check is run every 24 h. If the response of an individual compound is more than 10% off, the system is recalibrated.
Carbonyl identification was performed by retention time matching with standards. The identification was further confirmed by comparing the UV–Vis spectrum of each chromatographic peak (measured with the PDA) with the standard for each compound (Khlystov and Samburova Citation2016; Son and Khlystov Citation2021).
Filter and XAD extraction
Filters and XAD-4 resin were loaded together into accelerated solvent extractor (ASE, Dionex, Sunnyvale, CA) cells and spiked with the following deuterated internal standards: naphthalene-d8, biphenyl-d10, acenaphthene-d10, phenanthrene-d10, anthracene-d10, pyrene-d12, benz(a)anthracene-d12, chrysene-d12, benzo(k)fluoranthene-d12, benzo(e)pyrene-d12, benzo(a)pyrene-d12, perylene-d12, benzo(ghi)perylene-d12 coronene-d12, hexanoic-d11 acid, succinic-d4 acid, decanoic-d19 acid, adipic-d10 acid, suberic-d12 acid, homovanillic-2,2-d2 acid, myristic-d27 acid, heptadecanoic-d33 acid, oleic-9,10-d2 acid, and tetradecanedioic-d24 acid (CDN Isotopes, Quebec, Canada) and benzoic-d5 acid, levoglucosan-d7, and cholesterol-2,2,3,4,4,6-d6 (Cambridge Isotope Laboratories, Inc., Andover, MA, USA) Parameters for ASE extraction were: temperature: 80 °C, solvents: 150 mL of dichloromethane followed by 150 mL of acetone, pressure: 1500 psi, extraction time for each solvent: 15 min. After extraction, samples were pre-concentrated to 1 mL with a rotary evaporator (Rotavapor R-124, BÜCHI, New Castle, DE, USA ) under gentle vacuum at 35 ± 2 C. The extracts were then filtered with a 0.2-µm pore size polytetrafluoroethylene membrane syringe filters (Whatman, Florham Park, NJ, USA), and transferred into 2-mL volume amber glass vials. The extracts were split into two parts for PAH and polar compound analysis.
PAH analysis
For PAH analysis, the solvent mixture (dichloromethane/acetone) was exchanged on toluene and then pre-concentrated to 0.5 mL volume under ultra-high purity nitrogen stream. XAD and filter extracts were then quantitatively analyzed using a Varian CP-3800 GC equipped with a CP-8400 autosampler and interfaced to a Varian 4000 Ion Trap Mass Spectrometer (Varian, Inc., Walnut Creek, CA, USA). The analysis was performed using splitless injections onto a 30-m column (5% phenylmethylsilicone-fused silica capillary column, DB-5MS, Agilent Technologies, Palo Alto, CA, USA) that has a 10 m integrated deactivated guard column. PAH separation was performed by gradient elution of compounds with N2 gas (ultra-high purity grade) as the mobile phase. The GC oven temperature was programmed as follows: 75 °C for 2 min, 14 °C min−1 ramp to 300 °C for 16.1 min, 10 C min−1 ramp to 325 °C, and hold for 9 min. Transfer line and injector temperatures were set at 250 and 280 °C, respectively. The injection volume was 1µL. The MS was operated in SIM mode in the range of m/z 124 − 320. PAH quantification was performed using an internal standard approach, where concentration of analyte is determined based on the ratio of the target compound signal to the internal standard signal.
Analysis of polar compounds
A fraction of each extract was evaporated to 100 µL under UHP nitrogen and transferred to 300 µL silanized glass inserts (National Scientific Supply Company, Inc., Claremont, CA, USA). Samples were evaporated further to 50 µL, and then 50 µL of pyridine and 150 µL of N,O-bis-(trimethylsilyl) trifluoroacetamide (BSTFA) with 1% trimethylchlorosilane (TMCS) (Pierce, Appleton, WI, USA)] were added. These derivatizing reagents convert the polar compounds into their trimethylsilyl derivatives for analysis of organic acids, methoxyphenols, cholesterol, sitosterol, and levoglucosan. The maximum recovery vial from Waters Corporation containing the sample was placed into a thermal plate at 65 °C for 2 h. Calibration solutions were made fresh in methanol and derivatized just prior to the analysis of each sample set. All samples were analyzed by GC/MS within 18 h to avoid degradation. The samples were analyzed by an electron impact ionization GC/MS technique using a Varian 4000 gas chromatograph with a model 4000 autosampler and interfaced to a Saturn 2000 ion trap mass spectrometer.
Filter, XAD and canister samples were assayed with the GC–MS method. All compounds were identified using retention times of the standard compounds. The identification was then confirmed by comparing the mass spectra of each chromatographic peak with that of the standard compound (Zielinska, Sagebiel, Arnott, et al. Citation2004; Zielinsk, Sagebiel, McDonald, et al. 2004; Samburova et al. Citation2019; Sengupta et al. Citation2020).
Results
The aerosol generation system utilized to create the high and low temperature atmospheres was initially evaluated for the efficiency of aerosol generation. This was conducted by quantitative differential mass analysis of the flavorant dropped into the system and the mass collected in the pass-through reservoir; this was determined to be ∼70% for all flavorants. The concentration of compounds in the flavorant atmosphere was determined by burning each flavoring liquid (cinnamaldehyde, eugenol, menthol, and vanillin) at high (750 °C) and low (250 °C) temperature. Samples were collected with the purpose of characterizing the composition of both the aerosol in the gas, and particulate phase. Data are reported in units of concentration per unit of air in the test atmosphere. reveals the top five degradation products (ranked by concentration in the test atmosphere) for each of the tested conditions. indicates the compounds that were identified by analysis of mass spectral analysis of samples, but were not quantitatively analyzed. Appendix 1 lists the measured concentration of all 308 compounds measured in all flavorant atmospheres tested. The composition of each individual flavorant degradant atmosphere at different temperatures varied, and was in general related to the chemical structures of the starting materials ().
Table 1. Compounds (5) of highest concentration in each flavorant atmosphere (excluding the parent flavorant).
Table 2. Identified compounds determined by mass spectral analysis of flavorant atmosphere samples at low and high temperatures.
Cinnamaldehyde
Cinnamaldehyde (3-phenylprop-2-enal) showed degradation to primary aromatic compounds, with eugenol and benzoic acid/dibenzoic acid being the largest concentrations at low temperature and benzene at the high temperature. illustrates the composition of volatile aromatic organics measured from each of the test atmospheres, indicating the high presence of alkylated benzene across each of the molecules and both temperatures. At the high temperature there were also high concentrations of low molecular weight alkene and alkynes for cinnamaldehyde, presumably from dealkylation of the functional group from the alkenal of the parent compound. A primary difference in the cinnamaldehyde flavorant atmosphere is the presence of eugenol at 158.1 mg/m3 in the low temperature sample and at 3.1 mg/m3 in the high temperature sample. Nystoriak et al. (Citation2019) report less toxicity of high temperature mixture than the parent cinnamaldehyde. Authors hypothesize that double bond breakage with heating led to the formation of less reactive aldehydes such as formaldehyde and acetaldehyde. The results of this study show that high temperature burning, in fact, increased both formaldehyde (101.5 µg/m3) and acetaldehyde (34.8 µg/m3), respectively, compared with the low temperature (formaldehyde, 6.1 µg/m3; acetaldehyde, 3.3 µg/m3), respectively. This is not surprising due to the expected increased oxidation at higher temperatures. illustrates the composition of semi-volatile PAHs formed at low and high temperatures. The lower molecular weight compounds (2–3 aromatic rings and substituted 2–3 aromatic rings) were formed at similar concentrations at both temperatures, but the higher temperature made more complex PAHs (heavier molecular weight) (McDonald et al. Citation2000).
Figure 3. Volatile organic aromatic hydrocarbons measured in the flavorant aerosols at low (blue; 250 °C) and high (red; 750 °C) temperatures.
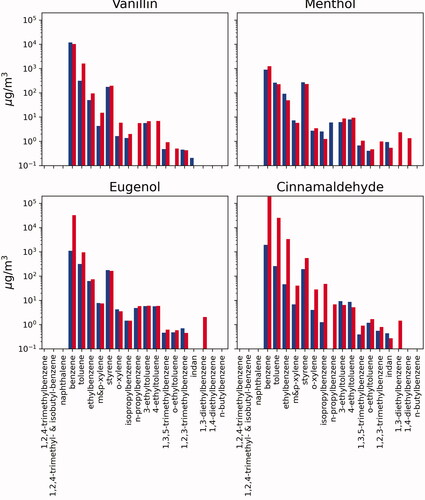
Figure 4. Polycyclic aromatic hydrocarbons (PAH) measured in the flavorant aerosols at low (blue; 250 °C) and high (red; 750 °C) temperatures.
Eugenol
Eugenol (4-allyl-2-methoxyphenol) is the main constituent of several essential oils of clove (Bhuiyan et al. Citation2010). The primary degradation products of eugenol were vanillin (4-hydroxy-3-methoxybenzaldehyde), 2,4-dimethylbenzoic acid and 2-3 ring PAHs (naphthalene and acenathylene). Notably, eugenol is often used as a precursor of vanillin through chemical or biotransformation, and thus, vanillin formation was unsurprising. In fact, isomerization of eugenol double bond and oxidation of isoeugenol is described (Lampman et al. Citation1977). Additional constituents result from the oxidation and aromatization. High temperature formed vanillin and benzene as well as low molecular weight VOCs (e.g. formaldehyde and acetaldehyde). Volatile aromatic organics were produced in similar concentrations by high and low temperature, but these were more minor constituents compared with the low molecular weight alkenes and alkanes.
Menthol
Menthol (cyclohexanol, 5-methyl-2-(1-methylethyl)) aromatizes and converts to benzoic and dibenzioc acid as the primary degradation products at both low and high temperatures. The next most prevalent compounds were small molecular weight alkanes at the high temperatures, and cyclo-acids at both temperatures. These data reflect an oxidative mechanism as well as an aromatization under both temperature conditions. Further, there was a larger abundance of carbonyls, such as glyoxyl, acetone, and propionaldehyde, compared with the amount produced from other flavorants. For menthol, PAHs were formed in similar amounts as lower molecular weight compounds but the higher molecular weight PAHs were only formed at high temperature.
Vanillin
Vanillin (4-hydroxy-3-methoxybenzaldehyde) degradation products at both temperatures included benzone and oxidized benzenes. At low temperature, the most abundant products were acetylene, ethene, and isobutane, indicating carbon-carbon breaks and dehydrogenation reactions occurring during the thermal heating process. The high temperature formed primarily oxidized aromatics, including vanillic acid. Similar to the products of other flavorants, the degradation profile also included lower concentrations of carbonyls, alkylated aromatic compounds, and PAHs at both temperatures.
Comparison among flavorants and unknown compounds
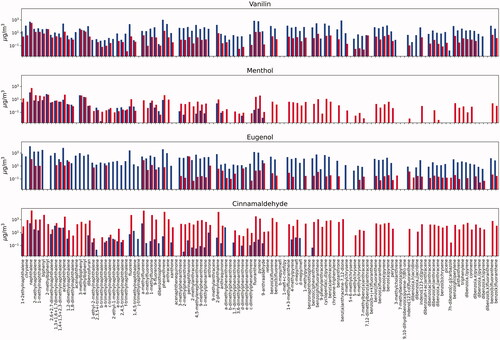
illustrates the compositional differences among each of the four flavorants studied at both temperatures. Each of the flavorants had their own characteristic chemical profile upon degradation that can be linked to the chemical structure of the parent compound and the mechanism of degradation (i.e. oxidation, cyclization, dehydrogenation, etc.). As illustrated, vanillin and menthol both showed high abundance of benzoic acid: at both temperatures for menthol, yet only at the high temperature for vanillin. In contrast, benzoic acid was only present (in lower concentrations) for eugenol and cinnamaldehyde and only at the lower temperature. Eugenol interestingly decomposes in large part to vanillin, especially at the lower temperature. At the higher temperature, eugenol made a mix of alkylated and oxygenated volatile aromatics. Cinnamaldehyde formed large amounts of eugenol at the lower temperature, and formed benzene and acetylene at the higher concentrations. Eugenol may be present as a contaminant in the cinnamaldehyde starting material as they both commonly co-exist in the natural products in which they originate (Sharma et al. Citation2017). All of the flavorants formed somewhat similar amounts of volatile aromatic and PAH compounds; and each had small amounts of acid and other polar compounds (Appendix 1).
Figure 5. Proportion of total measured organic compounds for each of the flavorants in the low (250 °C) and high (750 °C) temperature-generated atmospheres. Individual listed compounds were measured in the highest abundance (excluding parent flavorant).
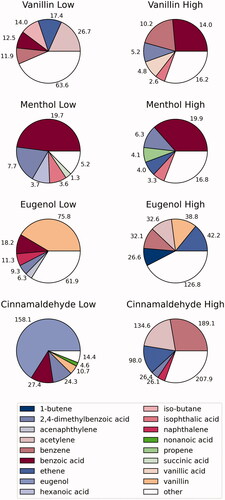
illustrates the compounds that were identified by mass spectral analysis in each of the test atmospheres but were not quantified due to a lack of an analytical standard. The table provides a relative abundance of these compounds in each of the atmospheres (i.e. low, medium, and high). As would be expected based on the composition of the measured compounds, the compounds are volatile aromatics with varying substituent groups that include: alkenes, alkanes, acids, alcohols (phenols), and carbonyls. Almost all test atmospheres showed high concentrations of menthol. The observation of menthol from thermal decomposition of flavorants had not been reported to our knowledge. Although a surprise, the chemical structure of menthol is similar enough to the other flavorants (albeit simpler in complexity) that it is possible it is a decomposition product.
Discussion
Because many flavorants are additives in an incredible array of tobacco products including electronic nicotine delivery systems such as E-cigarettes and e-hookah, this study was performed to generate atmospheres of a few common yet ubiquitous flavorants. The system was adapted to capture and quantify the complex atmospheres using multiple approaches to enable analysis of over 300 compounds. Because tobacco products vary widely in their applied internal temperatures (e-cigs to ‘mods’ to conventional cigarettes), we applied these methods uniformly to four common flavorants (cinnamaldehyde, eugenol, menthol and vanillin) for resolution of aerosol composition at both low (250 C) and high (750 °C) temperatures.
Our findings show that heating initiates thermal degradation of common flavorant compounds to generate (not surprisingly) a broad array of compounds that vary dependent on the chemical structure of the parent material and the temperature. Similarly, Czegeny et al. (2016) performed thermal degradation experiments of flavorants in a similar study that evaluated thermal decomposition in a helium atmosphere. The heating conditions in that study (300 and 900 °C) are intended to mimic the hot and cold zones of tobacco combustion products. Consistent with this study, they report a number of polar oxidation products that were dependent upon temperature conditions. However, the only overlapping compound of both studies is menthol, and they report the presence of menthone and menthene (in low abundance), which were not detected (or directly analyzed) in our study. Nonetheless, our temperatures are in agreement with this previous study and with reports of temperatures reached in e-cigarettes (Farsalinos and Konstantinos Citation2017) and in conventional tobacco cigarettes (Czégény et al. Citation2016).
The study advances our understanding of the composition of thermal degradation products of commonly used flavorants that are likely present within aerosols generated from a number of tobacco products. Despite this, our study has a number of limitations regarding any direct extrapolation to ENDS products. First, these studies used neat flavorant material that was directly heated in a thermal atmosphere with air present. This results in a high temperature oxidative environment that does not directly compare with the environment within ENDS products or conventional cigarettes where there are other excipients present that alter significantly the degradation conditions. Second, the high temperature setting far exceeds the temperature that is seen in e-cigarettes (Farsalinos and Konstantinos Citation2017); however, the high temperature sample is within range of combustion temperatures of commercial cigarettes. Thus, our system used herein is an exaggerated degradation environment that results in changes that may occur under certain (more extreme) conditions, such as with high wattage, open dripping on coils of modified e-cigs (mods) and perhaps under other conditions, yet, perhaps not to the extent observed here. Third, we did not include the common solvents of propylene glycol and vegetable glycerin that not only undergo thermal degradation themselves as well but can form more toxic flavor acetals with parent flavors or their degradation aldehyde products (Jabba et al. Citation2020).
Nonetheless, these degradation aerosol mixtures can be used in an in vitro toxicity study to evaluate and screen for the potential impact of these products created under extreme degradation conditions. In fact, in one such study, the high temperature atmosphere mixture from parent cinnamaldehyde is less toxic than the parent compound in human induced pluripotent stem cells differentiated into cardiomyocytes (hiPSC-CM) (Nystoriak et al. Citation2019), which is not surprising given the high toxicity of concentrated cinnamaldehyde as present in some e-liquids (Clapp et al. Citation2017, Citation2019). Of particular concern is that each heated flavorant atmosphere contained abundant menthol. Menthol has coolant properties that mask the effects of irritants in tobacco smoke, and thereby, it promotes both deeper inhalation, greater acquisition of nicotine, and thus, more rapid addiction (Willis et al. Citation2011; Ha et al. Citation2015). Thus, menthol has been long used in combustible cigarettes to market cigarettes to communities of color to promote greater smoking. Thus, inclusion of any one of these four flavorants tested here (and perhaps other flavorants, e.g. ethylvanillin) may be one way that tobacco industry promotes addiction with e-cigarettes. Notably, FDA did not ban menthol flavoring from e-liquids although fruit, candy and other characterizing flavors were banned. (FDA News Release FDA Citation2020).
Overall, we identify a variety of potential degradation products from common e-cigarette flavorants when heated under low and high (extreme) conditions. Some of these degradants, such as the carbonyls, are shown to be present in aerosols of many ENDS products as a function of coil resistance, wattage, temperature and PG:VG ratio (Kosmider et al. 2014; Ogunwale et al. Citation2017; Conklin et al. Citation2019; Szafran et al. Citation2020). It is likely that many of the constituents measured herein are also present in varying amounts within aerosols of ENDS under a variety of use circumstances. Moreover, as these flavorants are used in combination with many other e-liquid constituents, the complexity of degradations is likely greater, and thus, it makes it a greater challenge to address the potential health risks that come with exposures to these mixtures produced by the many and varied forms of electronic cigarettes in the ever-evolving marketplace.
Supplemental Material
Download MS Word (158.5 KB)Acknowledgments
The content is solely the responsibility of the authors and does not necessarily represent the official views of NIH, FDA, or the American Heart Association.
Disclosure statement
No potential conflict of interest was reported by the author(s).
Additional information
Funding
References
- Benowitz NL, Burbank AD. 2016. Cardiovascular toxicity of nicotine: implications for electronic cigarette use. Trends Cardiovasc Med. 26(6):515–523.
- Bhuiyan MNI, Begum J, Akter F. 2010. Constituents of the essential oil from leaves and buds of clove (Syzigium caryophyllatum (L.) Alston). Afr J Plant Sci. 4(11):451–454.
- Clapp PW, Lavrich KS, van Heusden CA, Lazarowski ER, Carson JL, Jasper I. 2019. Cinnamaldehyde in flavored e-cigarette liquids temporarily suppressesbronchial epithelial cell ciliary motility by dysregulation of mitochondrialfunction. Am J Physiol Lung Cell Mol Physiol. 316(3):L470–L486.
- Clapp PW, Pawlak EA, Lackey JT, Keating JE, Reeber SL, Glish GL, Jaspers I. 2017. Flavored e-cigarette liquids and cinnamaldehyde impair respiratory innate immune cell function. Am J Physiol Lung Cell Mol Physiol. 313(2):L278–L292.
- Conklin DJ, Schick S, Blaha MJ, Carll A, DeFilippis A, Ganz P, Hall ME, Hamburg N, O’Toole T, Reynolds L, Srivastava S, Bhatnagar A. 2019. Cardiovascular injury induced by tobacco products: assessment of risk factors and biomarkers of harm. A Tobacco Centers of Regulatory Science compilation. Am J Physiol Heart Circ Physiol. 316: H801–H827.
- Courtemanche CJ, Palmer MK, Pesko MF. 2017. Influence of the flavored cigarette ban on adolescent tobacco use. Am J Prev Med. 52(5):e139–e146.
- Czégény Z, Bozi J, Sebestyén Z, Blazsó M, Jakab E, Barta-Rajnai E, Forster M, Nicol J, McAdam KG, Liu C. 2016. Thermal behavior of selected flavor ingredients and additives under simulated cigarette combustion and tobacco heating conditions. J Anal Appl Pyrolysis. 121:190–204.
- Farsalinos, Konstantinos E. 2017. Analytical assessment of e-cigarettes: from contents to chemical and particle exposure profiles. Amsterdam, Netherlands: Elsevier.
- FDA News Release FDA. 2020. Finalizes enforcement policy on unauthorized flavored cartridge-based e-cigarettes that appeal to children, including fruit and mint. https://www.fda.gov/news-events/press-announcements/fda-finalizes-enforcement-policy-unauthorized-flavored-cartridge-based-e-cigarettes-appeal-children.
- Ha MA, Smith GJ, Cichocki JA, Fan L, Liu YS, Caceres AI, Jordt SE, Morris JB. 2015. Menthol attenuates respiratory irritation and elevates blood cotinine in cigarette smoke exposed mice. PLOS One. 10(2):e0117128.
- Hess CA, Olmedo P, Navas-Acien A, Goessler W, Cohen JE, Rule AM. 2017. E-cigarettes as a source of toxic and potentially carcinogenic metals. Environ Res. 152:221–225.
- Jabba SV, Diaz AN, Erythropel HC, Zimmerman JB, Jordt S-E. 2020. Chemical adducts of reactive flavor aldehydes formed in e-cigarette liquids are cytotoxic and inhibit mitochondrial function in respiratory epithelial cells. Nicotine Tob Res. 22(1):S25–S34.
- Khlystov A, Samburova V. 2016. Flavoring compounds dominate toxic aldehyde production during e-cigarette vaping. Environ Sci Technol. 50(23):13080–13085.
- Kosmider L, Sobczak A, Fik M, Knysak J, Zaciera M, Kurek J, Goniewicz ML. 2014. Carbonyl compounds in electronic cigarette vapors: effects of nicotine solvent and battery output voltage. Nicotine Tob Res. 16(10):1319–1326.
- Lampman GM, Andrews J, Bratz W, Hanssen O, Kelley K, Perry D, Ridgeway A. 1977. Preparation of vanillin from eugenol and sawdust. J Chem Educ. 54(12):776.
- McDonald JD, Zielinska B, Fujita EM, Sagebiel JC, Chow JC, Watson JG. 2000. Fine particle and gaseous emission rates from residential wood combustion. Environ Sci Technol. 34(11):2080–2091.
- Nayir E, Karacabey B, Kirca O, Ozdogan M. 2016. Electronic cigarette (e-cigarette). J Oncol Sci. 2(1):16–20.
- Nystoriak MA, Kilfoil PJ, Lorkiewicz PK, Ramesh B, Kuehl PJ, McDonald J, Bhatnagar A, Conklin DJ. 2019. Comparative effects of parent and heated cinnamaldehyde on the function of human iPSC-derived cardiac myocytes. Toxicol In Vitro. 61:104648.
- Ogunwale MA, Li M, Ramakrishnam Raju MV, Chen Y, Nantz MH, Conklin DJ, Fu XA. 2017. Aldehyde detection in electronic cigarette aerosols. ACS Omega. 2(3):1207–1214.
- Penn State Hershey Medical Center. 2017. Eugenol oil overdose. http://pennstatehershey.adam.com/content.aspx?productId=117&pid=1&gid=002647.
- Samburova V, McDaniel M, Campbell D, Wolf M, Stockwell WR, Khlystov A. 2019. Dominant volatile organic compounds (VOCs) measured at four cannabis growing facilities: pilot study results. J Air Waste Manag Assoc. 69(11):1267–1276.
- Sengupta D, Samburova V, Bhattarai C, Watts A, Moosmuller H, Khlystov A. 2020. Polar semi-volatile organic compounds in biomass burning emissions and their chemical transformations during aging in an oxidation flow reactor. Atmos Chem Phys. 20(13):8227–8250.
- Sharma UK, Sharma AK, Gupta A, Kumar R, Pandey A, Pandey AK. 2017. Pharmacological activities of cinnamaldehyde and eugenol: antioxidant, cytotoxic and anti-leishmanial studies. Cell Mol Biol. 63(6):73–78.
- Son Y, Khlystov A. 2021. An automated aerosol collection and extraction system to characterize electronic cigarette aerosols. Front Chem. 9:764730.
- Szafran BN, Pinkston R, Perveen Z, Ross MK, Morgan T, Paulsen DB, Penn AL, Kaplan BLF, Noël A. 2020. Electronic-cigarette vehicles and flavoring affect lung function and immune responses in a Murine model. Int J Mol Sci. 21(17):6022.
- Tegin G, Mekala HM, Sarai SK, Lippmann S. 2018. E-cigarette toxicity. South Med J. 111(1):35–38.
- U.S. EPA. 1999. Air method, toxic organics-15 (TO-15): compendium of methods for the determination of toxic organic compounds in ambient air. Second edition. Determination of volatile organic compounds (VOCs) in air collected in specially-prepared canisters and analyzed by gas chromatography/mass spectrometry (GC/MS). Washington, D.C.: U.S. EPA.
- Willis DN, Liu B, Ha MA, Jordt SE, Morris JB. 2011. Menthol attenuates respiratory irritation responses to multiple cigarette smoke irritants. FASEB J. 25(12):4434–4444.
- White JL. 2000. Smoking method. R. J. Reynolds Tobacco Company. United States Patent 6,164,287.
- Zielinska B, Sagebiel J, Arnott WP, Rogers CF, Kelly KE, Wagner DA, Lighty JS, Sarofim AF, Palmer G. 2004. Phase and size distribution of polycyclic aromatic hydrocarbons in diesel and gasoline vehicle emissions. Environ Sci Technol. 38(9):2557–2567.
- Zielinska B, Sagebiel J, McDonald JD, Whitney K, Lawson DR. 2004. Emission rates and comparative chemical composition from selected in-use diesel and gasoline fueled vehicles. J Air Waste Manag Assoc. 54(9):1138–1150.