
 ?Mathematical formulae have been encoded as MathML and are displayed in this HTML version using MathJax in order to improve their display. Uncheck the box to turn MathJax off. This feature requires Javascript. Click on a formula to zoom.
Abstract
This paper explores the question of whether real estate development (RED) projects systematically present positive net present value (NPV) and therefore, provide super-normal profit. Such projects are the products of a business operation that governs the exercise of the real call option on development that is represented by developable land. We present a framework for considering super-normal profit in the RED industry, and then in light of that framework we examine RED projects produced by publicly-traded equity real estate investment trusts (REITs). We find strong evidence of positive correlation between REITs’ Tobin-Q ratios, indicative of positive NPV, and the ratio of development assets to total assets in the firm, controlling for other factors. The nature of the firm’s Tobin’s-Q metric is such that the implied added firm value is net of land cost and net of overhead and search costs associated with the RED business operation. While our findings do not prove a direction of causality between REITs’ RED activity and positive NPV, the robust positive correlation controlling for other factors raises interesting implications which are discussed in the paper.
1. Introduction & Background
This paper explores the question of whether commercial real estate development (RED) projects may tend systematically in some significant context to provide super-normal profit. In particular, we focus on the development of medium to large scale investment property by publicly-traded real estate investment trusts (REITs). Super-normal profit equates to positive NPV in the projects, ex ante, expected returns in excess of the opportunity cost of capital (OCC) of the projects, that is, more return on average than is warranted by the amount of risk in the investment or, correspondingly, less risk than is implied by the average project returns. Sustained or systematic positive NPV sufficient to more than cover the overhead and search costs associated with the firm’s RED activity implies additional market value in a publicly-traded firm’s equity shares, that is, “value creation” at the firm level. This, in turn, is reflected in the firm’s Tobin’s-Q ratio.
The question of super-normal profit in RED is of interest for several reasons. First, if super-normal profits are prevalent in real estate development projects in general, it raises interesting economic questions. Classical micro-economic and industrial organization theory states that in a competitive industry, super-normal profits should not be systematically and persistently present. Casual observation would seem to suggest that real estate development is indeed a highly competitive industry in the United States. There are numerous firms, low barriers to entry, and no major apparent economies of scale in production as firms of all sizes seem to thrive. Similarly, the efficient market paradigm in capital market theory suggests that it should not be possible to systematically and persistently “beat the market”, where in this case the market in question is the direct private market for commercial property assets (not the stock market). On the other hand, because of the local nature of real estate markets, in any given metropolitan area firms capable of managing the development of large-scale commercial projects may not be very numerous, and each land site is unique to some degree. The possibility for systematic super-normal profit is therefore an open and interesting question about the industry.
Secondly, real estate development is a large and important sector of the US economy, with construction generally accounting for over six percent of the GDP and non-residential construction alone employing over 800,000 workers. More importantly, real estate development tremendously affects the physical and social environment. It is how cities are built. It is an important industry to understand from an economic and investment perspective, for reasons that go beyond just economics and investment. Widespread and persistent super-normal profits could suggest that less real estate development is occurring in the economy than would be optimal from a social welfare perspective. Classically, the sort of monopoly or market power necessary to sustain super-normal profit reflects some type or degree of constraint on the supply side of the market.
The question of super-normal profits in real estate development also is intriguing from the perspective of several strands of modern business and finance theory. The construction of a real estate development project can be viewed as the exercise of a “real option”, namely the development call option provided by land ownership. Empirical evidence about the economics of real estate development projects may hold implications about option value theory. The theory of innovation and business models also comes into play, as many development projects may have characteristics of product or process innovations, and the possibility for super-normal profits may be a function of the type of business model development firms adopt. Large-scale commercial and mixed-use projects tend to be heterogeneous and unique, often employing creative designs, and likely possessing some degree of market power, if for no other reason than that at the micro-level, locations and sites are unique. Search theory intersects with at least one of the major business models applicable to the real estate development industry, as independent firms specializing in real estate development must find suitable land sites and opportunities for construction projects, or suitable development opportunities for owned land sites.
Finally, the present study may hold implications about the nature and role of the stock market. Most firms that develop commercial property are not publicly traded. But we study the subset that are traded as REITs in the pubic equity market. Our findings therefore may say something not only about the real estate development industry, but also about the stock exchange. Perhaps the informational efficiency, liquidity, and transparency of the public equity market supports a Darwinian type process that attracts, supports, or cultivates firms that tend to be systematically and persistently particularly successful in commercial property development. Further research will be required to clarify whether the interesting association between RED activity and added firm value that this study finds is characteristic of RED activity more broadly or a more specific reflection of a stock market effect.
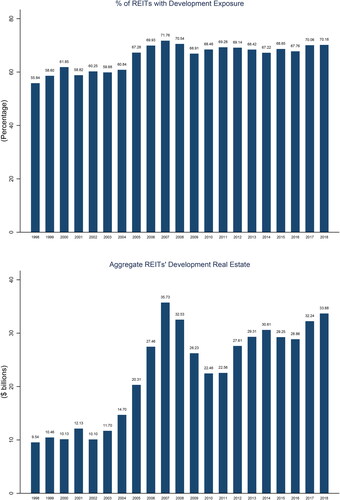
With the above in mind, it is important to note that the REITs we examine are an important sector in the stock market, as well as being important players in the commercial property market. Equity REITs are essentially “pure plays” in investment property. Some 200 such REITs have a total stock market capitalization of approximately $1 trillion, holding income generating property assets worth approximately $1.5 trillion.Footnote1 Though REIT RED is far from the totality of RED in the US, it is a substantial and important component of the industry. REIT RED regularly accounts for over $30 billion per year in activity, which is some 20% of all development of investment properties. Around 70% of REITs engage in development to some degree. Developments in process account for a small portion of REITs’ total assets at any given point in time, because the REIT business model is based on productive income-generating assets. (See above.) But REITs develop for the purpose of holding the projects long-term, and RED activity represents 32% of REIT net asset growth. Thus, development is an important way that REITs obtain their assets and represents an important aspect of their property portfolio management.
Figure 1. REITs’ Development Exposure. This graph presents percentage of REITs doing real estate development (top graph) and REITs’ aggregate development real estate (bottom graph) by year during the sample period 1998 − 2018. REITs’ development exposure data is from the S&P Global SNL Financial Database.
In summary, the information richness and informational efficiency of the stock market, together with consideration of the business models that can theoretically characterize the RED industry (as will be presented in Section 2), enable us to shed a new and different light on the question of the profitability of RED projects and the RED industry.
At this point we should note some points about the intended role and focus of this paper. It is important for the reader to understand what this paper is not, as well as what it is. First, we are not trying to study the efficiency of the stock market. We are not claiming that the ability of a firm to systematically produce positive NPV from RED activity should or would necessarily lead to the firm persistently generating super-normal returns in its share price in the stock market. If the stock market is efficient, the firm’s value creation capability will be impounded in the level of the firm’s stock price, hence, reflected in the firm’s Tobin’s-Q. Any “pop” in share price or super-normal stock returns would presumably have happened historically, perhaps very gradually (or even possibly already in the firm’s IPO price), as the market recognized the firm’s capability. In short, our focus on Tobin’s-Q is a focus on the value of the firm, and in particular on the creation of value within the firm.
Nor are we are doing an event study or a study of the effect of individual or specific RED projects or announcements. Rather, our focus is the firm’s general capabilities, as reflected in the average RED project as recognized by the stock market, not claiming that all projects are successful. Concomitantly, we are not studying how RED activity affects the investment risk of the firm’s stock. Though RED projects may be more risky than stabilized income-generating property holdings and ceteris paribus that should increase the firm’s stock’s volatility, that does not negate the possibility for such RED projects to add value, that is, to present positive NPV which could then be reflected in the firm’s Tobin’s-Q.
How might REITs achieve positive NPV at the firm level as a result of RED activity? Broadly speaking, the success of RED projects is no doubt strongly related to the property type/geographic focus of the REIT’s development activity, and to the REIT being good at making rational decisions on when to develop and when not to. We control for property type/geographic focus in our regressions, and positive NPV, the creation of value at the firm level as reflected in superior Tobin’s-Q, requires the REIT to be more than just “good” to an average or “normal” degree. It requires some degree of uniqueness and scarcity such that market power can be exerted. Otherwise the benefits are by definition offset by the costs (where “costs” include normal profit) leaving firm value (and Tobin’s-Q) unchanged. Sustained positive NPV at the firm level thus requires the REIT to be really good (to a degree that is scarce) at making rational decisions of what, and what not, to develop, when, where, and how.
With this in mind, specific sources of positive NPV in RED activity may be quite idiosyncratic and multifarious. For example, it could be through some manner of consistent innovation in the conceptualization or design of the projects. It could be in the uniqueness of locations, sites and designs. It could be through local political connections. Or it could be spillover effects or synergy of scope across the other properties and projects in the firm’s owned portfolio. It could be one or a combination of the above, or other sources, and it could be different means in different times, locations and circumstances. The ability to create sustained firm-level positive NPV from RED activity may result from, or in some way reflect, good corporate governance. This is true in some sense virtually by definition. After all, systematically and sustainably achieving some degree of monopoly or market power, necessary to obtain super-normal profit, is presumably pretty difficult to accomplish in a generally competitive industry such as real estate development.
All of these possibilities may be interesting to explore in follow-on studies. But the focus of the present paper is merely, but importantly, on the threshold question of simply whether or not positive NPV in RED is prevalent, at least in our sample of publicly-traded firms, and without constraining the direction of causality. That is, our study is focused on correlation, not causation. If we establish the correlation between value creation and RED activity, at least one of three possibilities must exist. Either the RED activity causes the firm-level value creation, or firm-level value creation necessarily entails RED activity, or conceivably some third factor could necessarily cause both RED activity and firm-level value creation. Any (or all) of these three possibilities are interesting, and say something thought-provoking about RED activity, about REITs, and about RED activity by REITs.
To cut to the chase, we do find robust evidence of positive correlation between REIT RED activity and firm-level positive NPV. Consistent with development projects profiting from some market power, we find that REIT Tobin’s-Q ratios are positively related to the proportion of the REITs total assets in development projects after controlling for other factors that could influence the Tobin’s-Q of the firm. The findings suggest positive NPV in RED projects sufficient to more than cover RED business search and overhead costs, since those would also be reflected in the firm’s stock price and hence in the Tobin’s-Q.
It is likely that some, perhaps much, of the Tobin’s-Q effect may reflect anticipated profits from future projects, the stock market’s perception that the REIT can reliably generate super-normal profits in development, with construction in progress or the development pipeline being a signal to the stock market for such a business or portfolio management strategy. It is possible that our findings reflect an effect of the stock market in attracting, supporting or cultivating firm’s that have superior capability in RED, compared to other RED firms.
It should also be noted that our findings are not inconsistent with the notion that REITs generate profits from operational efficiency and cash flow during long-term holding of properties (Feng et al. (Citation2021)). Indeed, our results provide evidence that long-term holding of properties is also, like RED activity, positively correlated with creation of value in REITs. RED activity in REITs is, by statutory requirement, not “merchant building”, but rather the creation of assets that are subsequently held long-term. With this in mind, REIT RED activity may be viewed as an aspect of asset portfolio management, a more efficient means of acquiring property when and where the circumstances are favorable, with, as noted, RED representing typically over 30 percent of the net growth in REIT assets.
We run a number of tests to assess the robustness of our results. First, we address the concern that REITs that do development may differ in some characteristics from other REITs, in some manner that is not already accounted for in our regression control variables, and these characteristics may influence the Tobin’s-Q. To deal with this issue, we match each firm with high development exposure (development real estate assets > 90th percentile) to its closest control firm with very low development exposure (development real estate assets < 10th percentile), identified based on firm size, leverage, cash holdings and exact matching on year. Our results remain robust while using the matched sample.
We perform other robustness tests. Our results are robust to controlling for corporate governance specific variables (e.g. institutional holdings, board size, and CEO characteristic). We utilize an instrumental variable (IV) approach, and the IV regressions confirm that following an increase in the REITs’ RED, their Tobin’s Q increased significantly. We show that results remain robust when instead of Tobin’s-Q, which is an objective accounting-based metric with a pedigree in the financial economics literature, we use the price to net asset value (P/NAV) ratio, which is a market value based alternative indicator of value creation. Although the P/NAV ratio is a subjective estimate, it is widely considered in practice in the real estate investment industry, since in the case of real estate NAV can be estimated based on valuation metrics in the private property market.
Finally, we examine the effect of “boom” and “bust” periods, just before, and during, the Global Financial Crisis. Not surprisingly, the ability of REITs to create value through RED projects was bolstered during the boom, and hampered during the bust.
The remainder of this paper is divided into four sections. Section 2 presents the overall theoretical model and framework, together with a review of some relevant literature. Section 3 discusses the data and econometric methodology. Section 4 presents the results. Section 5 concludes.
2. Theoretical Framework and Literature Review
A threshold purpose of this paper is to introduce a basic theoretical framework and strategy for considering super-normal profitability in RED activity. In this Section we present this framework, which will then provide a context within which to consider the empirical analysis we will describe in later Sections. Section 2 will also present a review of some relevant literature.
We begin with some basic terminology. What we refer to as “RED activity” consists of development projects that construct buildings designed to produce rental income, as well as the related overhead, search and management activities involved in the origination, leadership, management, and ownership of such projects.Footnote2 A RED “firm” is a business entity that engages in RED activity. For our purpose in the present Section, a RED firm may be a part of or an operation within a REIT, where the REIT is a vertically integrated company which also holds and manages existing income-producing property. Importantly, we distinguish RED activity from the activity of investing in (holding and managing) stabilized income-producing properties. Sometimes REITs undertake development projects via joint ventures (JVs) with other firms. In such JVs, the REIT may be the lead or managing partner in the project, or it may be a more passive “money partner”. It is not generally possible in the REIT data to distinguish between these two roles, although it is the belief of the authors that in most development projects done by equity REITs, the REIT is the sole owner or at least the lead or an active partner in any joint project.Footnote3
2.1. Business Models and Empirical Analytical Strategy
Consider three stylized business models of RED firms. All three of these models are consistent with economic theory and seem plausible based on casual empiricism. It is not clear a priori which model should or does prevail, even just within the REIT-based sample that we can study rigorously. The primary purpose of this paper is to distinguish among these three models, which one prevails in our sample of REITs.
(1) Production Model: This model views the RED firm much like a manufacturing firm producing long-lived capital goods in a competitive industry. In the case of RED, the value of real property derives from two sources, the land and the building structures on the land. The land is neither produced nor consumed, so the value added by the production firm is that of the structure, though of course in interaction with its site and location. In a competitive industry the long-run equilibrium price equals the long run marginal cost of production including normal profit and overhead.
There can be, though need not be, a land speculation component or phase in the RED firm, but even though land value may increase during the REIT’s holding of the land, it is important to note that this does not necessarily imply super-normal profit. Developable land is a call option on the highest-&-best-use (HBU) potentially buildable completed development project. From option value theory, the so-called “smooth pasting condition” (aka the “high contact” condition) of the optimal exercise of the call option (Merton (Citation1973)) implies that the value of the asset (and hence of the firm owning the asset) does not change with the optimal exercise of the call option (the construction of the HBU project). In essence, the smooth pasting condition says that optimal exercise of the option occurs when and only when the value of the built project, V, minus its construction cost, K, exactly equals the value of the call option which at that point is the economic value of the land: L = V-K.
In the Production Model of the RED business, the RED firm buys land at fair market value (either before or at the time of construction of the RED projects), adds value equal to the construction cost (including normal, not super-normal, profit including covering basic overhead cost of the development firm), and the smooth pasting condition implies zero NPV at both the project and firm level. The firm receives V-K from the project, but pays V-K for the land (on average, keep in mind that the market value of the land is an opportunity cost of the development project – the option is extinguished by its exercise). Hence, at both the project and firm level:
(1)
(1)
The value added by the production process just equals its total cost. Rational exercise of the development option contained in the land does not imply non-zero NPV and therefore does not in itself affect the value of the firm per share of equity stock (no impact on stock price).
(2) Search Model: This model refers to the situation where the RED firm must expend resources finding good projects or good land sites, but makes profits only from the projects that actually get built. Competitive equilibrium keeps firm level economic profits at zero (that is, the firm earns normal accounting profits on average, reflecting the amount of risk the firm’s investors face), but project-level profits are super-normal (NPV > 0) on average for the projects that get built, in order to cover the firm-level search costs. (Search costs in this model are viewed as reflecting an additional function of the development firm, beyond basic overhead costs which as noted in the Production Model are presumed to be included in K.) At the project level the Search Model implies on average among realized projects: V-K > L, and therefore:
(2a)
(2a)
But at the firm level:
(2b)
(2b)
where “S” is the search costs, across the firm and (we can think of them as being) apportioned in some manner pro rata among the projects that get built. Thus, at the project level, for projects that get built, we have: S = V-K-L. This means that, compared to the Production Model, either V is greater or K is less, taking the land value (L) as the same as in the Production Model, an exogenous value given by the land market. Alternatively, we could have V and K as in the Production Model but under the Search Model the firm is able to acquire the land for a lower price: L = V-K-S. In any case, the point of the Search Model is that the result in terms of profitability at the firm level is the same: no value added to the firm (per share of common stock) as a result of the REIT’s RED business.
(3) Market Power Model: In this business model the RED firm is able to sustain super-normal profits not only at the project level as in the Search Model but at the firm level as well. However it is achieved, the point of the Market Power Model is that the RED firm consistently creates value beyond production costs including the economic opportunity cost of the land and any search costs the firm faces. Labeling such added value as A∗, the Market Power Model implies:
(3)
(3)
Here we have assumed that L = V-K-S, the firm-level zero-profit land price from the Search Model. If the land price is L = V-K, not reflecting search costs, then here we have NPV = A* – S. But the definition of the Market Power Model, and the key point, is that in that case we would have NPV = A*-S > 0, strictly positive project level profits (on average) sufficient to make entity level profits super-normal even net of search costs.Footnote4
Thus, in the Market Power Model, RED projects add value to the firm. They don’t just add scale; they add value per share of common stock. Indeed, the entire RED business adds value. In the terminology of corporate finance as coined by Myers (Citation1977), under the Market Power Model the RED firm is a “growth stock”. It is possible that only some RED firms, not all, have such an ability to sustain the Market Power Model. If that is the case, it would perhaps not be surprising that such firms might grow and thrive in the environment of virtually unlimited liquidity and information efficiency provided by the public stock exchange. In other words, studying REITs might entail a sample selection in relation to the broader RED industry as a whole. We would be studying a sample of the industry’s “champion” firms. Even if so, it is still interesting to study RED in REITs, as an interesting subject in its own right, and as an important component of the overall RED industry, and for the implications that findings about REIT RED entail about both the RED industry and the stock market.
The above three business models are not mutually exclusive, either across firms or across time. However, by studying development activity within publicly-traded equity REITs, we seek to shed light on which of the above three RED business models is most prevalent, at least among such firms and over the time span for which we have data, 1998-2018. We have noted that REITs are an important and interesting component of the RED industry and of the stock market, and the depth, detail and quality of information available on publicly-traded REITs enable us to draw conclusions not possible by studying the private property market where admittedly the bulk of development projects do occur.
In essence, we seek to use the information provided by the Tobin’s-Q of the REITs, in combination with detailed accounting information about REITs’ asset holdings and other firm characteristics, to ascertain whether REITs’ RED activity tends systematically to create value (provide positive NPV, super-normal profit) for the REIT. The numerator of the Tobin’s-Q ratio is the market value of the firm, reflecting the value that the stock market assigns to the firm. The denominator is meant to represent the replacement cost of the firm’s assets. Thus, the ratio is correlated with value creation by the REIT over and above the cost of its assets. Consistent with prior literature, we use the net book value of the firm’s assets as a proxy for replacement cost in the denominator of the Tobin’s-Q.Footnote5 Based on official financial accounting reports, the Tobin’s-Q as thusly defined has the advantage of objective and precise measurement, as well as consistency with the prior financial economic literature. However, in the case of REITs, since real estate assets trade directly in a well functioning market, it is possible to estimate a current market-value-based replacement cost for the REITs’ assets. This is in fact done in the real estate investment industry, defined as the so-called “Net Asset Value” (NAV) of the firm. Although such NAV figures are only estimates, they have been found to be very highly correlated with accounting-based book values (See Hartzell et al. (Citation2006).) In our empirical analysis we supplement the traditional accounting-based Tobin’s-Q with the P/NAV ratio as a substitute dependent variable, to provide a robustness check on our Tobin’s-Q based results.
The approach in this paper is based on the concept of “growth stocks”. As suggested by Myers (Citation1977) in the general corporate finance context, a firm becomes a growth stock by virtue of having “real options” that provide it with positive NPV opportunities. In essence, the stock market perceives such firms as being able to create value beyond what is represented just by the replacement cost of the firm’s currently in-place assets. Of course, a firm can grow in scale simply by raising external debt or equity capital, without producing positive-NPV projects or super-normal profits. And it is possible to use capital structure and dividend policy to skew a firm’s equity returns toward growth and away from income, again without recourse to positive NPV investments. But in principle neither of these approaches to “growth” per se will increase the price per share or the Tobin’s-Q of the firm in a cross-sectional comparison. Only the ability to do positive NPV investments increases the firm’s price per share cross-sectionally, at least in the classical view based on fundamentals.
Thus, the basic idea in our empirical analysis is to use evidence of the effect of RED assets on REITs’ Tobin’s-Q values to identify whether the RED business systematically brings positive NPV to the firm. As is clear from the above description of the RED business models, such firm-level positive NPV can only arise if there is even more project-level positive NPV, because other than real estate development projects that actually get built, the RED business has no source of profit, but it does face costs. Finding of a positive RED impact on REIT Tobin’s-Q can thus, in principle, differentiate between the Market Power Model and the other two RED business models described above. If RED projects in progress bolster REITs’ Tobin’s-Q, then this implies that there are firm-level positive NPV effects (i.e., super-normal profits) from RED projects, considering not only the direct project costs but also entity-level costs associated with the RED business such as search and overhead costs.
Of course, we need to control for other considerations and characteristics of the firm that could affect the Tobin’s-Q without implying positive NPV from development projects. One special such possibility is land holdings, as the market value of land can grow rapidly over time, while it remains on the REITs books at historical cost. Ultimately, any realization of RED profit (super-normal or otherwise), must derive from projects that actually get built (by someone). Conceivably, a REIT could make a profit purely from buying and selling land, without developing the land itself. However, this is not generally what REITs do, and is made difficult by regulatory constraints REITs face in order to preserve their exemption from corporate income tax. Thus, to the extent that REITs profit from land holding, it is generally only as a result of the culmination of the RED process. And as noted, merely buying and selling land at fair market value, though it would generate accounting profits reflecting the opportunity cost of capital of land speculation, would not create positive NPV or an associated windfall “pop” in the firm’s share price. In fact, REITs do very little land holding, and REIT stockholders view REITs as “income stocks”, valued for their dividends.
Another possible confounding factor could be the pure scale-increasing effect of RED projects. As they increase the total value of the firm’s assets, this in itself could have an efficiency-based value enhancing effect on the firm, even though the RED project itself might be zero NPV. Indeed, the real estate literature, such as Ambrose et al. (Citation2000) and Ambrose et al. (Citation2005), has noted economies of scale in capital costs in REITs. This point applies to any strategy that increases the scale of the firm. Thus, we need to control for the size of the firm.
Along the same lines, corporate finance capital structure theory suggests that leverage could affect the value of the firm, which could thereby have implications for the Tobin’s-Q. However, the value of debt tax shields is less relevant for REITs because they are effectively exempt from corporate income tax. And the literature on the effect of capital structure on REIT stock price is mixed and inconclusive (see section 2.3 below). Nevertheless, we control for leverage in our analysis. Since we are using book value rather than actual market value based replacement cost as the denominator of our Tobin’s-Q metric, we need to also control for characteristics of the REITs’ holdings that could cause the difference between the book value and the current market value of the REITs’ assets to differ across REITs. Such a difference would be caused primarily by differences in real (economic) depreciation rates and in the average time since when the depreciating property assets were acquired. These depreciation related considerations could also interact with the types of properties and the geographic locations of the properties held by the REITs. Thus, we need to control for the average age of the properties and the average holding period of the properties, as well as the types and locations of the REITs’ property holdings. (Land is a particular example of this, as noted above.) Furthermore, as we are looking for a general systematic and secular value creation capability, we need to control for how the numerator of the Tobin’s-Q would reflect transient or cyclical real estate market conditions. Thus, we also control for the time fixed effects.
Finally, we want to control for the management and governance quality of the REITs. Of course, the firm’s quality of management and governance could be related to their ability to earn super-normal profit in the RED business, and to that extent we need not control for such a consideration. But management and governance quality could also reflect the firm’s overall general ability to create value apart from RED activities. The most effective way to control for the quality of REIT management and governance is to allow for firm fixed effects in our analysis, allowing each REIT to have its own idiosyncratic effect on Tobin’s-Q apart from its RED assets. For sake of robustness, we also include some direct measures of corporate governance.
To the extent that we can effectively control for confounding factors such as those noted here, the empirical analysis strategy outlined below in Section 3 should enable a reasonably rigorous characterization of which of the above three RED business models is most prevalent among REITs, with the implications described previously for whether RED projects systematically generate super-normal profits within REITs, as reflected in the firms’ Tobin’s-Q. As noted, any resulting conclusions would not necessarily apply to all RED projects among all types of developers in the RED industry. But the REITs that do RED are an important and interesting type of developer. If super-normal profits are prevalent at the project level or firm level among REIT developers, this carries interesting implications about the development industry and about REITs, as we have noted.
2.2. Review of Some Relevant Literature
This paper relates to several strands in the business and economic literature. First, it contributes to the literature that relates land to the call option model of development. For example, Xu and Lai (Citation2018) show that developer behavior combines with flexibility in the development option to cause project timing to avoid down markets that already existing assets cannot avoid, a proposition also suggested by Geltner et al. (Citation2020). Clapp et al. (Citation2012) show that the hedonic model can be extended to include an option value term. They derive the implications of option value for a cross sectional hedonic equilibrium, where value equals use value (the present value of the existing vector of hedonic characteristics) plus option value (the right to exchange the existing vector for a new one at some cost). A related strand of literature studies real options attached with the development process. For example, Lindenthal et al. (Citation2017) show that physical characteristics of lots and buildings, and social variables, i.e. characteristics of lot owners and/or occupiers explain a significant proportion of redevelopment of urban lots. Buttimer et al. (Citation2008) find that using a presale option can reduce market risk and allows developers to carry out projects with a lower expected return on equity. Buttimer and Ott (Citation2007) show that employing a preleasing option can enable developers to hedge the risks of leasing rental rates and vacancies in the space market. Clapp et al. (Citation2013) show that dynamics of the house prices are significantly affected by the re-development option value. Geltner et al. (Citation2020) argue that flexibility in the (re)development option may cause new developments to present less investment risk and greater capital value growth than pre-existing stabilized property assets, controlling for financial and operational leverage, and for depreciation in built structures. In general, the theoretical framework and empirical evidence for the real option model of land development suggests how developers might use optionality and flexibility to create value and achieve positive NPV. However, the option model in itself does not necessarily imply systematic positive NPV from development, due to the smooth pasting condition noted previously in 2.1.
Second, our paper is related to the strand of literature studying value creation by examining the firms’ Tobin’s-Q ratio, as we do. For example, Villalonga and Amit (Citation2006) use Tobin’s-Q as a measure of corporate value and show that family ownership creates value only when the founder serves as CEO of the family firm or as Chairman with a hired CEO. Hartzell et al. (Citation2006) use Tobin’s-Q to find that REITs with stronger corporate governance have higher firm value as they respond more positively to their investment opportunities. One advantage of the Tobin’s Q is that it is a forward-looking measure of firm performance (as opposed to, for example, accounting profit rate used in Demsetz and Lehn (Citation1985)). As noted, the Tobin’s Q reflects the capitalization into stock market value of the firm’s overall capability to create value from the assets it employs, not just from current projects underway, but the market’s forward-looking appraisal of the firm’s future prospects as well. This is important for our focus in this paper.
Third, we contribute to the rather scarce but growing thread of papers that examine the specific nature and role of property development activities, especially regarding commercial or income-producing (investment) property (as distinct from papers focusing on housing per se). Brounen et al. (Citation2000) provide evidence that larger REITs and REITs specializing in outlet centers and regional malls tend to undertake development more frequently. They also provide evidence that the risk and return for REITs engaging in property development are higher than for REITs that do not engage in development. This makes sense a priori on theoretical grounds, and is not inconsistent with any of the three business models proposed above, as development projects face inherent “operational leverage” (even if they are pre-leased), due to the lack of perfect correlation between the value of the built property and the cost of construction. Such leverage understandably increases risk, and that increases the economic opportunity cost of capital. Brounen and Eichholtz (Citation2004), utilizing an international sample of listed property companies, provide evidence that there is substantial variation between countries in the level of development activity among listed property companies. However, as noted in Section 1, there is an important distinction between studies of stock returns such as the above, and our focus on secular value creation as reflected in stock value levels as measured in the Tobin’s-Q.
Another area of literature relevant to the current paper is the study of search friction.Footnote6 Mortensen (Citation2011) argues that even after technological advance has reduced information asymmetry, unique characteristics of real estate still result in significant matching and search cost in the private property asset market where properties are directly valued. Within such a market, search costs are arguably higher for development projects than for existing properties, because development projects are more scarce, and developers need to screen and choose a project based on, not the actual, but the potential value of the property that is yet to be developed.
Other relevant studies on REITs consider the effect of capital structure, and/or of firm size, on the value of the firm. Howe and Shilling (Citation1988) use the fact that REITs do not pay any corporate taxes to examine several hypotheses concerning the market reaction to announcements of new security issues. Ambrose et al. (Citation2000) and Ambrose et al. (Citation2005) provide evidence of economies of scale in capital costs in REITs. A strand of literature dating at least back to Ambrose and Linneman (Citation2001) highlights the importance of corporate governance in REIT performance. For example, Capozza and Seguin (Citation2003) find that REITs with greater insider holdings use less debt in their capital structure and have higher relative valuation as measured by both higher premiums to net asset value and higher multiples of cash flows. As noted, these are all factors that we control for in our analysis of the relationship between development investments and REIT Tobin’s-Q ratio.
Finally, in a recent paper, Van Nieuwerburgh (Citation2019) finds that REIT share prices are too high to be justified by reasonable expected returns and expected dividend growth rates based on capital market equilibrium theory. He argues that the high prices reflect unrealistically optimistic expectations about future income growth from commercial properties. In the present paper, however, we raise the possibility that super-normal profit from RED activity could provide at least one source of more rational growth expectations for REIT value, beyond just income growth from current in-place productive assets.
In summary, while the extant literature is consistent with our study and supports our identification of control variables that affect the value of the firms, to the best of our knowledge, ours is the first paper that examines Tobin’s-Q ratio of REITs and provides evidence of super-normal profit, positive NPV, in REIT RED activity.
3. Data and Methodology
We examine all publicly traded U.S. REITs available in the S&P Global SNL REIT Financial Database from 1998 through 2018. We start with 1998 because that is when SNL started to report the development exposure of REITs.
As noted, we regress REIT Tobin’s-Q ratios onto development assets as a fraction of total assets, and other control variables. Specifically, we run the following firm-fixed effect specification for the Tobin’s-Q ratio of firm i in year t:
(4)
(4)
where our dependent variable, Tobin’s Q, is defined as the ratio of firm’s market value to book value of its total assets. As is typically done in the literature, “market value” of the firm is defined as the enterprise value, equal to the market value of common equity plus the book value of debt and preferred stock. As described in Section 2, Tobin’s-Q as thusly defined is widely used in the literature .
NewDevelopmenti,t is the ratio of RED assets to total assets for REIT i in year t, where “total assets” refers to the net book value of the firm. RED assets (or property development pipeline) is defined as the sum of “Construction in Progress” (book value of funds expended on construction projects currently underway based on historical cost without depreciation) and “Unfunded Pipeline” (value of funds earmarked for but not yet been expended in projects underway).Footnote7 The results are robust to using only “Construction in Progress” as the definition of RED assets.Footnote8
DevelopmentLandi,t is the book value on nondepreciable land held for the purpose of future development. Controlsi,t denotes a set of firm-level controls – firm size, leverage, cash holdings, weighted average age of properties owned, square of weighted average age of properties owned, and weighted average holding period of properties owned – as discussed in Section 2.2 and in more detail later in this section. We also control for firm fixed effects αi as well as year fixed effects zt. Standard errors are clustered at the firm level.
We control for REITs’ property type fixed effects and location fixed effects by relative square foot exposure in their property holdings.Footnote9 We obtain REITs’ property level information from S&P Global SNL Asset Database. The variables and
respectively, are based on the square feet of properties owned by REITs in each property type category (apartment, office, retail, industrial, other) and in each of the top 25 geographical markets (separately), as defined by Real Capital Analytics (RCA).Footnote10
Our control variables are widely used in the finance and real estate literature. Together, they control for the characteristics that could influence the cross section of Tobin’s-Q apart from expectation of positive NPV in development projects. The control variables are as follows.
LogAssets is the natural logarithm of firms’ total assets. It measures the size or scale of the firm, a variable that might reflect scale economies or Fama-French capital market equilibrium stock pricing factors.
Leverage is the ratio of total debt to total assets by book value. This variable will control for possible capital structure effects such as signaling or costs of financial distress, although with REITs being tax-exempt, some of the traditional motivations for such effects are less meaningful for REITs.
Cash is defined as the ratio of cash and cash equivalents to total assets. This is a signaling variable that prior research has suggested may impact Tobin’s Q.
We control for linear and non-linear effects of the age of the properties owned by REITs. This relates to how depreciation of building structures could differentially affect the difference between net book value and current actual market value replacement cost of assets across REITs. For this we compute weighted average age of the properties owned by REITs each year. The weights are calculated based on size of the properties. In the same spirit, we also control for the weighted average holding period of properties, for each REIT in each year. This is defined as the time since each property was acquired by the REIT, and hence would begin accumulating depreciation in its net book value as carried by the REIT.
provides summary statistics of the main variables used in the study. The average Tobin’s-Q is 1.37, suggesting that across REITs and across the time sample REITs overall created net value of 37% beyond the historical cost of their assets. On average 7.7% of REITs’ asset value is itemized in the Property Development Pipeline. Average REIT leverage is 51% of book net assets (or 51/1.37 = 37.22% of their enterprise market value based on the average Tobin’s-Q – recall that Tobin’s-Q is Market/Book Value of the firm). The weighted average age of the properties held by REITs during our sample period is 21 years and on an average REITs have held their existing properties for about 7 years.
Table 1. Detailed summary statistics.
reports the Pearson correlation for the main variables used in our analysis, with their accompanying p values in parentheses. The table shows that there is no evidence of excessive correlation, and hence any concern around multicollinearity is significantly reduced.
Table 2. Correlation table.
4. Results
In this section, we use the firm-level data and methodology described in the previous section to examine the effect of REITs’ development exposure on the cross-section of their Tobin’s-Q.
reports the results of our main test. The dependent variable is the Tobin’s-Q for each REIT, each year. The key independent variable measuring RED activity across all the specifications is Property Development Pipeline. Recall that the Property Development Pipeline variable includes both Construction in Progress as well as the Unfunded Pipeline, but does not include land being held for development. We include Development Land separately in the analysis, in case there is an independent cross-sectional effect of land purely as a high Market/Book Value type of asset (simply reflecting land value growth since acquisition without necessarily implying any positive NPV).
Table 3. Development exposure and Tobin’s Q.
We find a positive and statistically significant relationship between Tobin’s-Q and RED, as indicated by the estimated coefficient on the RED variable (Property Development Pipeline), most importantly in column [2] model, which includes all of the control variables. Development Land has a negative coefficient, with only marginal statistical significance.Footnote11 All the columns include firm fixed effects and year fixed effects. We also include property exposure of REITs in each of the top 25 RCA markets and exposure by property type fixed effects. We use the firm fixed effect specification to address (to an extent, if not entirely) the concern of possible endogeneity or omitted variables (including, as noted, corporate governance).
Column [1] displays the results of the simplest specification of equation (5) without any control variables. In column [2], we add the set of controls typically used in the corporate finance and real estate literature and that we described in Section 3. The Property Development Pipeline Coefficient is positive and statistically significant at the 1% in both the columns. This suggests that an increase in the development exposure of REITs is associated with a higher Tobin’s-Q, consistent with the hypothesis of the Market Power Model of the RED business within REITs.Footnote12
Of course, correlation does not prove a direction of causation. As noted in Section 1, the focus of our analysis is not on how RED activity in REITs is associated with positive NPV for the firm, but whether such value creation tends to occur systematically with such activity. With this in mind, it is interesting to note that our control variables reveal another possible source of systematic value creation in REITs. The coefficient on the variable that measures the average length of time REITs hold onto their properties is also positive and significant. This makes sense. As noted, REITs are not merchant builders or traders of property. Tax law requires REITs to focus on long-term, relatively passive investment in commercial property. Thus, their main route to business success is to hone and optimize their ability to manage and generate profit from the ownership of existing, productive properties. The REITs that are best at this will hold their most profitable properties longest, creating a positive relationship between average property holding period and the the firm’s Tobin’s-Q Ratio.Footnote13
In our main result in , the control firms are the “universe” of all REITs, whether they have any development assets or not. The advantage of including all the firms is that one overcomes possible concerns about the generality of the findings. However, by considering the universe of REITs, some characteristics of treated and control firms will inevitably be different. This could be problematic if there are reasons to believe that these characteristics could influence the firms’ Tobin’s Q beyond their development exposure. To deal with this concern we run a matching analysis where, we match each firm with high development exposure (Property Development Pipeline > 90th percentile) to its closest control firm with very low development exposure (Property Development Pipeline < 10th percentile), identified based on firm size, leverage, cash holdings and exact matching on year. We perform our matching using the Abadie and Imbens (Citation2006) bias-corrected matching estimator. After matching on these characteristics, treated and control firms are similar. shows descriptive statistics and distributional characteristics for the matched samples.Footnote14
Table 4. Matched-sample: mean difference and distributional tests for treated and control firms.
then presents our results using the matched sample. Note that the coefficient estimates on the Property Development Pipeline variable remain positive and statistically significant across all the columns, thus confirming that our results remain robust using the matched sample.
Table 5. Development exposure and Tobin’s Q: matched-sample analysis.
It is well known that the real estate industry tends to be strongly cyclical. Therefore, we also provide results contrasting the role of RED in value creation during boom and recession periods. presents these results. To capture the effect of the differing regimes, we create boom and bust dummies. Specifically, Boom (Bust) Period is an indicator which takes value 1 if time period is 2002-2007 (2008-2011), and 0 otherwise. Columns [1]-[2] present our results while interacting Property Development Pipeline with the Boom Period dummy, while columns [3]-[4] show similar results while using the Bust Period dummy. These results indicate that while the boom period augmented the effect on the Tobin’s-Q impact of RED projects, the bust significantly hampered REITs’ RED value creation ability. This is not surprising, and no doubt many REITs would have delayed or abandoned many more recession period projects with the benefit of hindsight.
Table 6. Development exposure and Tobin’s Q: boom vs bust period.
REITs make many investment decisions, and RED is one of them. Like other corporate policies, investment policy of firms can be significantly impacted by their corporate governance. Therefore, we test our main results presented above in while controlling for various corporate governance related variables commonly used in the literature. Following Hartzell et al. (Citation2006), Hartzell et al. (Citation2014), and Feng et al. (Citation2021) we use measures of institutional investors’ ownership and board size. Specifically, we define (1) Total institutional ownership, defined as the fraction of the firm owned by institutional investors; (2) Top 5 institutional ownership, defined as is the fraction of the firm owned by biggest five institutional investors; (3) Active institutional ownership, defined as the fraction of the firm owned by investment companies and independent investment advisors; and (4) Passive Institutional Ownership, defined as the fraction of the firm owned by banks, insurance companies, endowment and other types of institutional investors.Footnote15 Board size is the number of directors on the board. Data for institutional ownership comes from the Thomson Reuters 13f Filings database. Board size data is obtained from the BoardEx database. We also construct various CEO related variables using data from the Execucomp database. These variables are: (1) CEO compensation, defined as the total compensation received by the CEO; (2) CEO % Shares Owned, defined as the percentage of shares owned by the CEO in the firm, (3) CEO Age; (4) CEO Tenure, defined as the number of years since the CEO has joined the company; and (5) CEO Duality, an indicator equals to one when CEO is also chair of the board.
present our results while controlling for the specific measures of corporate governance. All the specifications are similar to column [2] of , except for the addition of governance related control variables. We present the results by step-wise adding these controls, where columns [1], [4], and [7] only control for different measures of institutional ownership; columns [2], [5], and [8] controls for board size in addition to institutional ownership; and columns [3], [6], [9] include CEO specific controls in addition to the institutional ownership and board size. The coefficient estimate on Property Development Pipeline in all the columns remain positive and qualitatively similar to our main results in . Overall, these findings suggest that our results are robust to controlling for REITs’ governance specific variables.
Table 7. Development exposure and Tobin’s Q: controlling for corporate governance.
Our analysis so far provides strong evidence that higher development exposure of REITs is related to higher Tobin’s Q and the results remain robust in the matching analysis as well as when we add several corporate governance control variables. However, there might still be a concern related to omitted variable that can be affect both our dependent and independent variable at the same time. To further address the endogeneity issue, we run the our specification using an instrumental variable (IV) approach. presents results using the IV approach.
Table 8. Development exposure and Tobin’s Q: results based on IV approach.
We utilize two different IV variables for our analysis. In column [1], we instrument property development pipeline of a REIT in each year using lagged property development pipeline of the same REIT. While the contemporaneous RED may be related with Tobin’s Q through an omitted variable, using lagged RED as an instrument helps us to address this issue to an extent. Our coefficient of interest in column [1] remains positive and statistically significant confirming robustness of our main results using this IV.
As a second instrument, we construct average development assets of all the peer firms in the industry.Footnote16 Thereofore, in column [2], we instrument Property Development Pipeline of a REIT “i” each year using average Property Development Pipeline of all other REITs (excluding the REIT “i”) in the same year. While there may be endogeneity concern between RED and Tobin’s Q of a given firm, arguably the RED of other REITs should be independent of the Tobin’s Q of the individual REIT “i”. Results in column [2] confirms that the positive relationship between firms’ RED and Tobin’s Q remains unchanged when the IV approach is used to control for the endogeneity issue.
As noted in Section 2, Tobin’s Q is the most widely used measure of firm performance and value creation in both Corporate Finance and Real Estate Finance literature. And we include several control variables to address the concern that denominator of the Tobin’s-Q measure is in terms of book value rather than market based replacement cost. Nevertheless, to address this concern and provide a robustness check, we have also analyzed an alternative definition of firm performance. In we replace the Tobin’s-Q with the price-to-net asset value (P/NAV) ratio as the dependent variable. Compared to Tobin’s-Q, the P/NAV ratio has the disadvantage that NAV is a subjective estimate whereas book value is objective. But the advantage is that NAV at least attempts to represent the current market value of the REITs’ assets, based on private property market valuations. Thus, for example, NAV does not automatically decrease with depreciation expenses according to an accounting based formula.
Table 9. Development exposure and price-to-NAV (P/NAV) ratio.
As shown in columns [1] and [2] of , our result regarding the relationship to RED activity is robust to using this alternative indicator of value creation. Overall, the results in provide evidence that the development exposure of REITs is positively associated with value creation at the firm level. The coefficient on our Property Development Pipeline variable is positive and statistically significant, even with all our control variables.Footnote17
5. Conclusion
In this paper we study the question of super-normal profit in real estate development (RED) of commercial investment property. Our analysis is based on, and therefore applies directly only to, RED carried out by publicly traded REITs. However, this is a substantial amount of development nationwide, typically over $30 billion per year. And REITs are major players in the real estate investment industry, and an important sector of the stock market.
We find strong evidence of positive correlation between RED activity by REITs and value creation in the REITs’ share prices as as indicated by Tobin’s-Q Ratio or P/NAV Ratio. Value creation in share price is by definition reflective of positive NPV, that is, super-normal profit, at the firm level. Positive NPV in RED activity can only be generated by the construction projects that actually get built. Therefore, our findings imply that any such positive NPV at the project level must be sufficient to more than cover the overhead and search costs associated with the RED activity. Our empirical findings therefore are consistent with the Market Power Model of the RED business and not consistent with the Search or Production Models, as described in Section 2.
With the foregoing in mind, let us return to our previously noted point that our focus is on correlation rather than causation, on the existence of systematic positive NPV in REIT RED activity rather than on exactly how that positive NPV is achieved. The correlation we find either implies that RED causes the value creation, or that value creation causes the RED, or conceivably there is a “third factor” or characteristic that we have not controlled for and that causes both REIT value creation and also REIT RED activity. So let us consider these possibilities.
The present paper would defer to future research the question of how it matters whether RED activity causes increased share value or increased share value requires or necessarily leads to increased RED activity. Either direction of causation requires positive NPV in the RED activity.Footnote18
What about the question of a “third factor”? We cannot completely rule out such a possibility. But what would such a third factor be? Whatever it is, if it indeed causes super-normal profit in RED projects, this is an interesting finding that begs further research.
If one is willing to suspend belief in the omnipotence of the neoclassical paradigm that market efficiency always precludes super-normal profits, there would seem to be many ways in which super-normal profitability in RED activity could occur in REITs. Certainly it is likely associated with REIT management being good at deciding what projects to build, when and where (and correspondingly, what and when not to build). But we control for property type and location as fixed effects, and skill in picking the right property type in the right location at the right time could be part of how market power is obtained, at least temporarily.
The fact that certain property types in certain geographical markets at certain times present particularly profitable investment opportunities is not sufficient to cause super-normal profit, either from RED investments or from investment in existing assets. Efficient markets and the smooth pasting condition noted in Section 2’s description of the Production Model imply that any such profit opportunity will be impounded in land and construction costs. Building in growth markets will naturally provide normal profit in an efficient market, but not super-normal profit, and therefore in and of itself will not increase the share price of the firm. Super-normal profit at the firm level requires some form of market power.
By definition, super-normal profit requires market power, and there are various ways REITs could obtain market power for development projects. As described in Section 1, these could range from uniqueness of locations, to innovative project conception or design, to local political connections, to positive spillover effects with other property holdings of the firm, and more. Our analysis is designed to discover secular, on-going super-normal profitability at the firm level, not one-off, unique “news” or announcement effects associated with specific projects. One would need a more specific case study approach to identify exactly how successful projects become successful, and at that level the answer might be somewhat idiosyncratic.
It should also be noted that our findings are not inconsistent with the notion that REITs generate superior profitability from operational efficiency and cash flow during long-term holding of stabilized properties (Feng et al., Citation2021). REITs are not “merchant builders”, and RED activity is not likely their only source of super-normal profit. REIT development projects are held long-term after construction by the REITs, and the development phase of that holding, and the share of REIT total assets in development, is a small fraction of the total assets at any one time, although a substantial fraction of property acquisition. In REITs, it is perhaps most accurate to view RED as a means of acquisition of properties for long-term holding, an alternative to purchase of existing fully operational (stabilized) properties, a method of portfolio management that is attractive to some REITs some of the time.
The findings in this study beg the question of the degree to which the systematic super-normal profits found here are broadly characteristic of the RED industry, versus being a reflection of the particular types of firms that are publicly traded in the stock market as REITs. Perhaps the liquidity and informational efficiency of the stock market provide a means of attracting, supporting, or cultivating firms that are particularly capable at RED activity. Are we observing a characteristic of the RED industry, or of the stock market? Perhaps related to this question is the question of why REITs don’t engage in more RED activity, up until there is no super-normal profit? But our analysis measures average profitability of the REIT RED activity, not its profitability on its margin.
Notes
1 This compares to a total of $4.4 trillion multi-family and non-farm non-residential mortgages outstanding as of 1Q2019 according to the Federal Reserve Bank (FRB).
2 The present study does not include the “merchant building” industry which focuses largely on single-family housing development projects. Housing development is a rather separate and different industry, producing a smaller scale and more homogeneous product in a separate market from that of the investment property industry. Though some large housing developers are publicly-traded firms, they are not REITs, as REITs are not permitted to be merchant builders. We also do not consider the social housing development industry that is largely based on governmental subsidies and not-for-profit developers.
3 So-called “mortgage REITs”, which originate and invest in commercial mortgages, are distinct from “equity REITs” and are not included in our study.
4 We characterize the super-normal profits as stemming from value creation, and we think it likely this is a broadly correct characterization. However, one can imagine sources of super-normal profit from the firm’s perspective that are more akin to expropriation or transfer receipts than to value creation from a broader social perspective. For example, political connections might enable the firm to access land at less than its economic value without offsetting contributions by the firm. But strictly speaking the focus of our analysis is on super-normal profit that gets reflected in an increase in the firm’s share price. This is the sense in which super-normal profit equates to “value creation”, positive NPV in the investment, in our context.
5 For example, see Villalonga and Amit (Citation2006), Boudry (Citation2011), Coles et al. (Citation2012), Humphery-Jenner (Citation2014), and Pavlov et al. (Citation2018), which all use book value to define the Tobin’s-Q as an indicator of value creation by the firm (generation of positive NPV).
6 This has been a subject studied in the real estate literature (and more extensively in the labor literature).
7 We use “RED assets” or “property development pipeline” interchangeably as indicators of the REITs’ development exposure.
8 These results are available from the authors upon request.
9 This is superior to defining such fixed effects based only on the headquarters locations of the firms, as is typically done in the corporate finance literature where such direct measures of physical assets is not possible or meaningful. In real estate, it is well established at least since Capozza and Korean (Citation1995) that property type and size can affect both property-level and REIT-level performance.
10 In unreported results, we find that our results are robust to use of REITs property type fixed effects and location fixed effects by relative net book value exposure in their property holdings. In other words, our results are qualitatively the same if we define REITs’ Property Exposure by using net book value of properties instead of their size in square feet, and are available from the authors upon request.
11 This suggests that REIT stockholders do not view land holding per se as a source of value creation. Land does not provide a source for the dividends that REIT stockholders tend to prize.
12 Scatter plot analysis suggests that skewness in variables does not pose a concern. Analysis available from authors upon request.
13 An anonymous reviewer has suggested an alternate explanation for the positive coefficient on holding period, as an artifact of accounting conventions in the Tobin’s-Q metric in which the book value of properties falls farther below their market values the longer the properties are held. Indeed, the holding period variable loses statistical significance in the results we will report in Table 9 where the denominator in the dependent variable is based on estimates of property market value rather than book value.
14 The p-values for the mean difference t-tests and the Wilcoxon-Mann-Whitney rank-sum distributional tests in the matched sample are all largely above the 10% threshold. This suggests that treated and control firms are similar in terms of characteristics and distributional assumptions in the matched samples.
15 Our results are robust if we control for total number of institutional investors or the number of active and passive institutional investors.
16 See Feng and Wu (Citation2021) for using instrument based on the peer firms characteristics.
17 We note that the Holding Period variable changes sign and loses statistical significance with this dependent variable.
18 This is similar to our previously noted point that we don’t particularly care if good REIT management and governance is required for the RED activity to add share value. Naturally, good governance and management would seek to focus the REIT on positive NPV investment strategies.
References
- Abadie, A., & Imbens, G. W. (2006). Large sample properties of matching estimators for average treatment effects. Econometrica, 74(1), 235–267. https://doi.org/10.1111/j.1468-0262.2006.00655.x
- Ambrose, B., & Linneman, P. (2001). REIT organizational structure and operating characteristics. Journal of Real Estate Research, 21(3), 141–162. https://doi.org/10.1080/10835547.2001.12091049
- Ambrose, B. W., Ehrlich, S. R., Hughes, W. T., & Wachter, S. M. (2000). REIT economies of scale: Fact or fiction? The Journal of Real Estate Finance and Economics, 20(2), 211–224. https://doi.org/10.1023/A:1007881422383
- Ambrose, B. W., Highfield, M. J., & Linneman, P. D. (2005). Real estate and economies of scale: The case of REITs. Real Estate Economics, 33(2), 323–350. https://doi.org/10.1111/j.1540-6229.2005.00121.x
- Boudry, W. I. (2011). An examination of REIT dividend payout policy. Real Estate Economics, 39(4), 601–634. https://doi.org/10.1111/j.1540-6229.2011.00305.x
- Brounen, D., & Eichholtz, P. (2004). Development involvement and property share performance: International evidence. The Journal of Real Estate Finance and Economics, 29(1), 79–97. https://doi.org/10.1023/B:REAL.0000027202.57984.21
- Brounen, D., Eichholtz, P. M., & Kanters, P. M. (2000). The effects of property development activities on the performance of REITs. Real Estate Finance, 16, 45–52.
- Buttimer, R., & Ott, S. H. (2007). Commercial real estate valuation, development and occupancy under leasing uncertainty. Real Estate Economics, 35(1), 21–56. https://doi.org/10.1111/j.1540-6229.2007.00181.x
- Buttimer, R. J., Clark, S. P., & Ott, S. H. (2008). Land development: Risk, return and risk management. The Journal of Real Estate Finance and Economics, 36(1), 81–102. https://doi.org/10.1007/s11146-007-9077-z
- Capozza, D., & Korean, S. (1995). Property type, size and REIT value. Journal of Real Estate Research, 10(4), 363–379. https://doi.org/10.1080/10835547.1995.12090794
- Capozza, D. R., & Seguin, P. J. (2003). Inside ownership, risk sharing and Tobin’s Q-ratios: Evidence from REITs. Real Estate Economics, 31(3), 367–404. https://doi.org/10.1111/1540-6229.00070
- Clapp, J. M., Eichholtz, P., & Lindenthal, T. (2013). Real option value over a housing market cycle. Regional Science and Urban Economics, 43(6), 862–874. https://doi.org/10.1016/j.regsciurbeco.2013.07.005
- Clapp, J. M., Jou, J.-B., & Lee, T. (2012). Hedonic models with redevelopment options under uncertainty. Real Estate Economics, 40(2), 197–216. https://doi.org/10.1111/j.1540-6229.2011.00323.x
- Coles, J. L., Lemmon, M. L., & Meschke, J. F. (2012). Structural models and endogeneity in corporate finance: The link between managerial ownership and corporate performance. Journal of Financial Economics, 103(1), 149–168. https://doi.org/10.1016/j.jfineco.2011.04.002
- Demsetz, H., & Lehn, K. (1985). The structure of corporate ownership: Causes and consequences. Journal of Political Economy, 93(6), 1155–1177. https://doi.org/10.1086/261354
- Feng, Z., Pattanapanchai, M., Price, S. M., & Sirmans, C. F. (2021). Geographic diversification in real estate investment trusts. Real Estate Economics, 49(1), 267–286. https://doi.org/10.1111/1540-6229.12308
- Feng, Z., Hardin, W. G., III, & Wang, C. (2021). Rewarding a long-term investment strategy: REITs. Working Paper.
- Feng, Z., & Wu, Z. (2021). Local economy, asset location and REIT firm growth. Journal of Real Estate Finance and Economics. Advance online publication. https://doi.org/10.1007/s11146-021-09822-8
- Geltner, D., Kumar, A., & Van de Minne, A. (2020). Riskiness of real estate development: A perspective from urban economics and option value theory. Real Estate Economics, 48(2), 406–445. https://doi.org/10.1111/1540-6229.12258
- Hartzell, J. C., Sun, L., & Titman, S. (2006). The effect of corporate governance on investment: Evidence from real estate investment trusts. Real Estate Economics, 34(3), 343–376. https://doi.org/10.1111/j.1540-6229.2006.00170.x
- Hartzell, J. C., Sun, L., & Titman, S. (2014). Institutional investors as monitors of corporate diversification decisions: Evidence from real estate investment trusts. Journal of Corporate Finance, 25, 61–72. https://doi.org/10.1016/j.jcorpfin.2013.10.006
- Howe, J. S., & Shilling, J. D. (1988). Capital structure theory and REIT security offerings. The Journal of Finance, 43(4), 983–993. https://doi.org/10.1111/j.1540-6261.1988.tb02616.x
- Humphery-Jenner, M. (2014). Takeover defenses, innovation, and value creation: Evidence from acquisition decisions. Strategic Management Journal, 35(5), 668–690. https://doi.org/10.1002/smj.2121
- Lindenthal, T., Eichholtz, P., & Geltner, D. (2017). Land assembly in Amsterdam, 1832–2015. Regional Science and Urban Economics, 64, 57–67. https://doi.org/10.1016/j.regsciurbeco.2017.01.003
- Merton, R. C. (1973). Theory of rational option pricing. The Bell Journal of Economics and Management Science, 4(1), 141–183. https://doi.org/10.2307/3003143
- Mortensen, D. T. (2011). Markets with search friction and the DMP model. American Economic Review, 101(4), 1073–1091. https://doi.org/10.1257/aer.101.4.1073
- Myers, S. C. (1977). Determinants of corporate borrowing. Journal of Financial Economics, 5(2), 147–175. https://doi.org/10.1016/0304-405X(77)90015-0
- Pavlov, A., Steiner, E., & Wachter, S. (2018). REIT capital structure choices: Preparation matters. Real Estate Economics, 46(1), 160–209. https://doi.org/10.1111/1540-6229.12155
- Van Nieuwerburgh, S. (2019). Why are REITS currently so expensive? Real Estate Economics, 47(1), 18–65. https://doi.org/10.1111/1540-6229.12238
- Villalonga, B., & Amit, R. (2006). How do family ownership, control and management affect firm value? Journal of Financial Economics, 80(2), 385–417. https://doi.org/10.1016/j.jfineco.2004.12.005
- Xu, R-h., & Lai, R. N. (2018). Optimism-driven decisions of real estate developers under demand uncertainty. Journal of Real Estate Research, 40(2), 267–308. https://doi.org/10.1080/10835547.2018.12091500