
 ?Mathematical formulae have been encoded as MathML and are displayed in this HTML version using MathJax in order to improve their display. Uncheck the box to turn MathJax off. This feature requires Javascript. Click on a formula to zoom.
Abstract
In this study, cantharidin(CTD), a bioactive terpenoid in traditional Chinese medicine cantharidin, was selected as a model component to construct novel nano liposome delivery systems for hepatocellular carcinoma therapy. Previous studies have shown that although cantharidin has definite curative effects on primary liver cancer, it is associated with numerous toxic and side effects. Therefore, based on the glycyrrhetinic acid (GA) binding site and the asialoglycoprotein receptor (ASGPR) on the hepatocyte membrane, the surface of CTD liposomes was modified with stearyl alcohol galactoside (SA-Gal) or/and the newly synthesized 3-succinic-30-stearyl deoxyglycyrrhetinic acid (11-DGA-Suc) ligands, and the physicochemical properties, pharmacokinetics, in vivo and in vitro anti-liver tumor activity and its mechanism of modified liposomes were investigated. Compared to CTD-lip, SA-Gal-CTD-lip, and 11-DGA-Suc + SA-Gal-CTD-lip, 11-DGA-Suc-CTD-lip showed stronger cytotoxicity and increased inhibition of HepG2 cell migration had the highest apoptosis rate. The cell cycle results indicated that HepG2 cells was arrested mainly at G0/G1phase and G2/M phase. The results of in vivo pharmacokinetic experiments revealed that the distribution of modified liposomes in the liver was significantly increased compared with that of unmodified liposome. In vivo tumor inhibition experiment showed that 11-DGA-Suc-CTD-lip had excellent tumor inhibition, and the tumor inhibition rates was 80.96%. The 11-DGA-Suc-CTD-lip group also displayed the strongest proliferation inhibition with the lowest proliferation index of 7% in PCNA assay and the highest apoptotic index of 49% in TUNEL assay. Taken together, our findings provide a promising solution for improving the targeting of nano liposomes and further demonstrates the encouraging potential of poor solubility and high toxicity drugs applicable to tumor therapy.
1. Introduction
Primary liver cancer (PLC) is one of the most common malignant tumors in the world (Chen et al. Citation2021). Generally, liver cancer (LC) is divided into three subtypes, namely hepatocellular carcinoma (HCC) (Chapiro et al. Citation2014), cholangiocarcinoma (CC), and mixed hepatocellular carcinoma (Liu et al. Citation2020a). Among them, HCC is the most commonly occurring, accounting for about 70–90% of LC incidences (Schoenberg et al. Citation2018), and ranked third with regard to cancer-related deaths (Zhang et al. Citation2018). The incidence and mortality of liver cancer have been increasing annually (Xie et al. Citation2016, Liu et al. Citation2021), while its short course of disease coupled with the high mortality rate pose a great threat to human health (Liu et al. Citation2020b). Clinical treatment of HCC involves surgery, liver transplantation, radiofrequency ablation, transarterial chemoembolization, and radiotherapy/chemotherapy (Mizuhata et al. Citation2018). However, these have not effectively reduced the associated recurrence and mortality rates (Pires et al. Citation2020). Drug-based systemic chemotherapy remains the main treatment modality for HCC (Wang et al. Citation2017). However, long-term use of the therapy is associated with two major problems. The first is due to limited specificity to liver tumor cells coupled with incidences of toxic effects on normal cells while killing tumor cells (Ruman et al. Citation2020); and the second is that most anti-tumor drugs are highly toxic and poorly water-soluble (AlSawaftah et al. Citation2021), a phenomenon that prevents them from reaching the tumor tissue in a uniform and effective concentration. Therefore, urgent development of new anti-cancer drug preparations that can precisely target liver tumor cells, enhance efficacy, reduce toxicity, and continuously and stably release drugs is imperative to effective treatment of HCC.
The selection of modified materials plays a crucial role in improving the targeting of modified nanoliposomes (Makowski et al. Citation2019, Xing et al. Citation2019). The commonly used targeting-specific materials include polysaccharides and their derivatives (Ehexige et al. Citation2020), polyethylene glycol and its derivatives (Deng et al. Citation2017), ligand binding (Albinali et al. Citation2019), and polypeptides (Zhao et al. Citation2018, Kong et al. Citation2020), among others. Negishi demonstrated that rat hepatocyte membrane fractions contain a large number of glycyrrhetic acid (GA) binding sites (Wang et al. Citation2019), and GA binds to this site with high specificity (Zhu et al. Citation2018). Studies have also shown that glycyrrhetic acidification of liposomes mainly occurs through chemical synthesis of stearyl glycyrrhetinic acid (Zhu et al. Citation2020). By coupling 11-deoxyglycyrrhetinic acid with stearyl alcohol and succinic anhydride, we synthesized a new type of amphiphilic guiding molecule, and then incorporated it into liposomes to achieve liver targeting. However, glycyrrhetic acid has been associated with aldosterone-like side effects. Previous studies have shown that 11-deoxyglycyrrhetinic acid can reduce GA-derived side effects without affecting its anti-inflammatory effect (Farina et al. Citation1998, Maione et al. Citation2019).
Numerous studies have demonstrated that galactose-modified liposomes are mainly recognized and taken up by ASGPR on the liver parenchymal cell membrane in mice (Myrhammar et al. Citation2020, Liu et al. Citation2020c), while galactosylated liposomes can significantly improve the liver-targeting of pharmaceutical preparations (Li et al. Citation2018). Notably, galactosylation of liposomes can be achieved by synthesizing galactosylation ligands, such as stearyl galactoside, and SA-Gal, while the fat-soluble part of stearyl alcohol is inserted into the phospholipid bilayer, the water-soluble part of the galactosyl group is exposed on the surface of the liposome bilayer. Ultimately, galactosylated liposomes can be specifically recognized by ASGPR on the hepatocyte membrane, thereby significantly improving liver targeting.
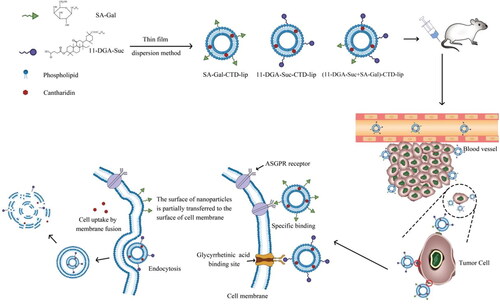
Previous studies have shown that although cantharidin has a definite clinical curative effect on primary liver cancer (Li et al. Citation2012), CTD not only has low solubility in aqueous solution but is also associated with numerous toxic and side effects, which limits its application range (Zhang et al. Citation2017). Therefore, researchers have attempted to modify CTD through preparation technology with a view of improving its liver-targeting ability, making it concentrated in the liver to enhance the curative effect, and reducing CTD concentration in other tissues. In this study, we hypothesized that stearyl alcohol galactoside ligand and 3-succinic-30-stearyl deoxyglycyrrhetinic acid ligand can effectively modify the surface of liposomes. When the binding of the ASGPR receptor on the liver cell membrane to the galactose ligand reaches saturation, the modified liposome can pass through another ligand (11-DGA-Suc), to bind to the GA-binding site on the hepatocyte membrane. Since this dual-ligand-modified ‘dual-target liposome’ can act on two targets on the hepatocyte membrane, we envisage that it should theoretically confer better efficacy than either single-galactose or single-deoxyglycyrrhetinic acid ligand-modified liposomes. Liposomes have strong targeting properties, thus are expected to effectively solve the problem of ‘increasing efficacy and reducing toxicity’ associated with anticancer monomers, such as cantharidin, for the treatment of liver cancer from a formulation perspective (Scheme 1).
Scheme 1. A surface-modified multifunctional nanoplatform provided with stable blood circulation and selective tumoral accumulation, asialoglycoprotein receptor (ASGPR), and glycyrrhetinic acid (GA) binding site mediated endocytosis or membrane fusion, CTD released after entering cells.
2. Materials
11-Deoxyglycyrrhetinic acid was prepared in the laboratory of our research group, Cantharidin was purchased from Xi’an Tongze Biotechnology Co., Ltd. (Xi’an, China), Lecithin was purchased from an imported phospholipid brand (Koln, Germany). Cholesterol was purchased from Sinopharm Chemical Reagent Co., Ltd. (Shanghai, China), RC dialysis bag MwCO 8KD-14KD, MD34mm was purchased from Beijing Solebao Technology Co., Ltd. (Beijing, China). Dextran gel was purchased from General Electric Healthcare (Buckinghamshire, UK), 3-(4,5-Dimethylthiazol-2-yl)-2,5-diphenyltetrazolium bromide (MTT) was obtained from Biosharp (Hefei, China). The cell cycle test kit was purchased from Becton Company (Franklin Lake, USA), Whereas the cell apoptosis test kit was purchased from Dickinson Company (New Jersey, USA). DAPI was purchased from Solarbio (Beijing, China), Antifade Mounting Medium was obtained from SouthernBiotech (Birmingham, Alabama, USA), Tunel apoptosis detection kit was purchased from Roche (Basel, Switzerland), while Proteinase K was acquired from Merck (Germany).
3. Methods
3.1. Synthesis of 11-DGA-Suc
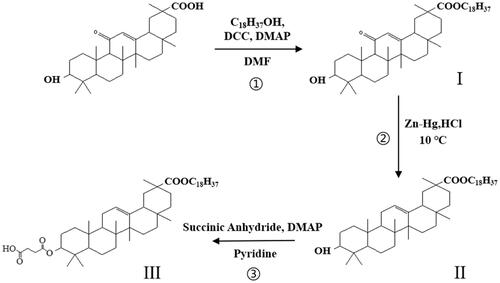
Three-succinic-30-stearyl deoxyglycyrrhetinic acid (11-DGA-Suc) is a novel liver-targeting guide molecule synthesized by ourselves and patented by China. The synthesis of this guide molecule is divided into three steps as follows:
In the first step, glycyrrhetinic acid (0.47 g), stearyl alcohol (0.27 g), DMAP (0.01 g), and DCC (0.21 g) were added to DMF (20 ml) solution. The mixture was stirred at 80 °C for 2 h. The reaction products were monitored by TLC. After the reaction, the reaction solution was poured into 100 ml of distilled water, and when a large amount of white precipitate was produced, it was filtered and dried to obtain stearyl glycyrrhetinate (I).
In the second step, DGA was synthesized by the Clemmensen reaction. The intermediate product (I) (0.72 g), zinc-mercury (0.45 g) was fully dissolved in dioxane solution, dropped into 12 mol/l HCL (1.5 ml) and magnetically stirred at 10 °C for 3 h. After the reaction is completed, pure water is added to precipitate, and the crude product (II) filtered is dried at low temperature. Silica gel column chromatography was used for purification, and the eluent was petroleum ether-ethyl acetate (5:1).
In the third step, DGA (0.7 g), succinic anhydride (2.1 g), and DMAP (0.01 g) were mixed with 20 ml Pyridine with gentle stirring, then incubated at 106 °C in an oil bath for about 12 h, to react. The reaction was monitored using thin-layer chromatography (TLC) in a mixture of ethyl acetate, with petroleum ether as developing solvent at a ratio of 1:1 (v/v). After completion, the solvent was poured into distilled water, and the precipitate was collected by filtration. Finally, the product (III) was purified via silica column chromatography, and chemical structure confirmed by 13 C-NMR (in CDCl3, 600 MHz) (Scheme 2).
Scheme 2. Synthesis of 11-DGA-Suc.
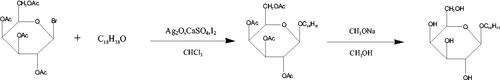
3.2. Synthesis of SA-Gal
Synthesis of Stearyl alcohol galactoside (SA-Gal) was performed according to the methods of the literature, with slight modification (Wancui et al. Citation2006, Shengde et al. Citation2010). Firstly, Acetobromo-α-D-galactose (1.65 g), stearyl alcohol (0.83 g), CaSO4 (4.35 g), I2 (0.20 g), and Ag2O (1.90 g) were dissolved in 25 ml CHCl3 and mixed for 5 h at room temperature with stirring. The reaction was monitored by TLC in a mixture of ethyl acetate, with petroleum ether as the developing solvent at a ratio of 1:5 (v/v). The intermediate product was purified by silica column chromatography. Secondly, the intermediate product was dissolved in a solution of diethyl ether and petroleum ether (ratio 2:1 ration/v). Next, 0.1 mol/l sodium methanol solution was slowly added to the above reaction mix and stirred for 12 h at 10 °C. The obtained solution was placed in a separation funnel, precipitated with distilled water, then collected by filtration. Thereafter, the filtrate was rinsed with distilled water to neutral and dried at 40 °C, and the chemical structure of SA-Gal confirmed by 13 C-NMR (in CDCl3, 600 MHz) (Scheme 3).
Scheme 3. Synthesis of SA-Gal.
3.3. Preparation of liposomes
The liposomes were prepared by the thin-film evaporation method that the research group had established earlier (Zhou et al. Citation2019). Soybean lecithin, cholesterol, and CTD were dissolved in chloroform. Chloroform is removed by reduced pressure rotary evaporation to form a uniform lipid film on the eggplant shaped bottle wall. Add 10 ml of phosphate buffer solution with PH 6.4, and stir at 55 °C for 1 h. Use the probe ultrasonic to ultrasonic the solution for 0.5 h and pass through 0.22 μm pore size of microporous membranes can obtain liposome solution. Modified liposomes were prepared by post-insertion method, namely, 11-DGA-Suc-CTD-lip, SA-Gal-CTD-lip, and (11-DGA-Suc + SA-Gal)-CTD-lip. Briefly, soybean lecithin, cholesterol, CTD, and targeted molecule are dissolved in chloroform, and the remaining steps are the same as above.
3.4. Characterisation of liposomes’ physicochemical properties
The physicochemical properties of liposomes were characterized. The microscopic morphology of liposomes was observed by transmission electron microscope. The particle size, Zeta potential, and polydispersity index(PDI) of several liposomes were measured by Malvern laser particle size analyzer. Liposomes should be diluted with purified water before preparation for measurement. Encapsulation efficiency (EE%) refers to the percentage of the encapsulated CTD (Wliposome) in the total amount of the drug in the liposome suspension (Wtotal). It is an important indicator of liposome quality control, reflecting the extent of CTD encapsulation by carriers. Determination of encapsulation efficiency by gel exclusion chromatography was established earlier by the research group (Zhou et al. Citation2019). Briefly, the determination method of Wtotal: add four times the volume of methanol acetonitrile (1:1) mixture into a certain volume of liposome solution, take samples after overnight storage and use HPLC for detection. Determination method of Wliposome: a certain volume of liposome solution was eluted with Sephadex gel column (Sephadex G-50), and the eluant was collected and concentrated. Add nine times the volume of methanol acetonitrile (1:1) mixture into the concentrated solution, take samples after overnight storage, and use HPLC for detection.
3.5. In vitro CTD release
The release of CTD from several liposomes at 37 °C was determined by the dialysis method. Add a certain volume of liposome solution into the dialysis bag (MwCO 8KD-14KD). Put the dialysis bag into 300 times volume PBS buffer solution (pH 7.4) containing 0.25% Tween-80, and stir it with a stirrer (360 r/min). Then take a certain amount of buffer solution at a predetermined time point, and immediately replenish the buffer solution of equal volume. Under the same experimental conditions, the experiment was repeated three times. Octadecyl methanol solution (7.5 μg/mL) as an internal standard, mixed with the sample solution, and determined the concentration of CTD was measured via GC-MS. The cumulative release of CTD-lip,11-DGA-Suc-CTD-lip,SA-Gal-CTD-lip and (11-DGA-Suc + SA-Gal)-CTD-lip is calculated as follows:
Wt represent CTD release at a certain time point, Wtotal is the total amount of CTD in the liposome.
3.6. Safety evaluation
3.6.1. Preparation of rabbit 2% red blood cell suspension
A total of 50 ml of blood was drawn from a rabbit’s heart, transferred into an Erlenmeyer flask containing about 50 glass beads, and gently shaken for 10 min to remove fibrinogen. Next, the defibrinated blood was pipetted into 5 ml tubes, admixed with 30 ml of physiological saline, and centrifuged for 10 min at 3000 r/min. Thereafter, the supernatant was discarded, and the above steps repeat until a clear and colorless supernatant was obtained. The red blood cells were precipitated at the bottom, dilute to a 2% red blood cell suspension using normal saline, and stored in a refrigerator at 4 °C.
3.6.2. Hemolysis test
To investigate the hemolysis of 11-DGA-Suc-CTD-lip, SA-Gal-CTD-lip and 11-DGA-Suc + SA-Gal-CTD-lip, with CTD-Lip and blank liposomes (without cantharidin) as a control, observe the effects of liposome carrier, cantharidin, 11-DGA-Suc and SA-Gal on hemolysis of red blood cells. Divide 10 ml EP tubes into five groups, 10 tubes/group, numbered 1–10, of which No. 1–7 are test tubes, and the added amount of test product (cantharidin concentration is 0.6 mg/mL) is 0.1, 0.2, 0.3, 0.4, 0.5, 0.6, and 0.7 ml. The 8th, 9th, and 10th tubes were taken as negative, positive, and test substance controls, respectively. The specific amounts added are outlined in .
Table 1. Hemolysis protocol.
3.7. In vitro cytotoxicity assay
HepG2 and liver cells (L-02) were cultured in DMEM and RPMI-1640 media, respectively. MTT colorimetry was used to investigate the effects of several liposomes on the proliferation of two kinds of cells. The cells were inoculated into 96 well plates. After the cells adhered to the wall, the medium was added. The medium contained 11-DGA-Suc-CTD-lip, SA-Gal-CTD-lip, and (11-DGA-Suc + SA-Gal)-CTD-lip with different concentrations of CTD (0.05, 0.15, 0.25, 0.5, 1, 2, 3, 4 and 5 μg/mL). After a certain period of incubation, add MTT solution (0.5 mg/mL) to each well, incubate in a dark environment for 4 h, and finally add a certain amount of DMSO solution. The absorbance at 492 nm is measured with an automatic microplate reader, and the inhibition rate (IR) of cellular proliferation is calculated using the following formula:
3.8. Cell migration assay
The effect of CTD-lip, 11-DGA-Suc-CTD-lip, SA-Gal-CTD-lip, and (11-DGA-Suc + SA-Gal)-CTD-lip on cell migration was assessed via the transwell assay. Add the medium containing serum in the lower culture chamber of the transwell chamber. Dilute cells with serum-free medium and adjust cell concentration to 1 × 10⁴ cells/mL. Set 100 μL cell suspension is added to the inner chamber of the transwell chamber. After incubation for 1–1.5 h, add different concentrations of liposome solution into the inner chamber and continue incubation for 24 h. After being fixed in 4% paraformaldehyde solution and stained with 0.5% crystal violet, five visual fields were randomly selected to take pictures under the microscope. The influence of liposomes on cell migration is evaluated by calculating the migration rate. The calculation formula is as follows:
3.9. Effect of liposomes on the cell cycle and apoptosis
The concentrations of CTD-lip, 11-DGA-Suc-CTD-lip, SA-Gal-CTD-lip, and (11-DGA-Suc + SA-Gal)-CTD-lip diluted to CTD by medium were IC50 and 1/2IC50, respectively. The liposome containing medium was incubated with the cells for 48 h. After the cells were digested by trypsin, the cells were collected into a suitable centrifuge tube. Resuspend cells in 200 μL Binding Buffer, add 10 μL AnnexinV-FITC and 10 μL PI, and mix gently. After 30 min incubation at 4 °C in dark, flow cytometry was used to detect apoptosis.
The liposome containing medium was incubated with the cells for 48 h. Add absolute ethanol and place the cells in a refrigerator at −20 °C for 24 h. The fixed samples were taken out and the cells were precipitated after centrifugation and suspended with 1 mg/ml RNaseA solution.
Add propidium iodide (50 μg/ml), and then put it in a dark place for 10 min. The content of DNA in cells was measured by flow cytometry to determine the proportion of each cell cycle.
3.10. Pharmacokinetic studies
Pharmacokinetic properties of liposomes were evaluated by determining the CTD content in rat plasma. Thirty-six SD rats were randomly divided into five groups, namely CTD-lip, 11-DGA-Suc-CTD-lip, SA-Gal-CTD-lip, (11-DGA-Suc + SA-Gal)-CTD-lip and saline groups, and rats in each group injected with 3 mg/kg of the agent via the tail vein. At the pre-designed time point, 0.3 ml blood sample was collected from the posterior orbital plexus. The treatment method of blood sample: The centrifuged plasma sample was mixed with three times the volume of methanol, and centrifuged again after vortex. Octadecane (0.5 μg/mL) was added to the supernatant as an internal standard. The content of CTD in the supernatant was analyzed by GC-MS, and the pharmacokinetic data were analyzed by DPSv17.10.
3.11. Analysis of tissue distribution
Two hundred and eighty-eight SD rats were randomly divided into five groups, namely CTD-lip, 11-DGA-Suc-CTD-lip, SA-Gal-CTD-lip, (11-DGA-Suc + SA-Gal)-CTD-lip and saline groups, and rats in each group injected with 3 mg/kg of the agent via the tail vein. After the injection, the rats were euthanized at a pre-designed time point. At the same time, the viscera of rats were collected. The treatment method of rat viscera: After the normal saline is washed, it is weighed and homogenized in the same volume of normal saline. The homogenate was mixed with 6 times the volume of methanol and centrifuged after vortex. Octadecane (0.5 μg/mL) is added to the supernatant as the internal standard. Finally, the supernatant was analyzed via GC-MS, and the parameters were measured by a non-compartmental analysis using DPSv17.10. According to the data of AUC and Cmax, calculate the targeting parameters Te, RTe, Re, and Ce. The calculation formula is as follows:
3.12. Determination of in vivo anti-tumor effect of liposomes
BALB/c nude mice aged 4–8 weeks, were housed in an SPF barrier environment. HepG2 cells at logarithmic growth phase were digested with trypsin, and 10 ml of the cells were taken and centrifuged at 1000 rpm for 3 min. Next, the supernatant was discarded, and the cell pellets were resuspended in PBS. Thereafter, 100 μL of HepG2 cell suspension was subcutaneously injected into the armpit of nude mice (with ∼106 cells/mouse) to initiate tumor development. When the tumors had reached 80 mm3, mice were randomly divided into six treatment groups (n = 5), namely saline, Cisplatin, CTD-lip, 11-DGA-Suc-CTD-lip, SA-Gal-CTD-lip, and 11-DGA-Suc + SA-Gal-CTD-lip. Mice in each group were treated with 2 mg/kg CTD every 2 days. Tumor size and body weight were recorded every 2 days for one time, and tumor volume (V) was calculated as V = (length × width2)/2. Tumors were removed and weighed on the second day, following the final administration. Thereafter, the livers, hearts, spleens, lungs, and kidneys were also removed. Tumour tissues were fixed with 4% paraformaldehyde for 48 h, embedded in paraffin, sectioned, and subjected to H&E, PCNA, and TUNEL staining. The sections were observed under an optical microscope (Eclipse E100, Nikon, Japan).
3.13. Statistical analysis
All data were generated in triplicates and expressed as means ± standard deviations (SD). Comparisons between two and multiple groups were performed using the student’s t-test and one-way analysis of variance (ANOVA), respectively. All statistical analyses were performed using SPSS 21.0, and a p-value of <0.05 was considered statistically significant.
4. Results
4.1. Synthesis of 11-DGA-Suc
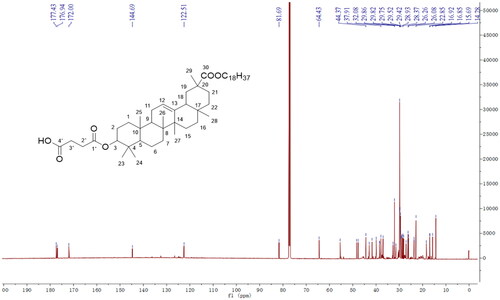
We successfully synthesized 11-DGA-Suc by esterification reaction in organic media. Both synthesis steps were monitored via TLC to ensure a complete reaction. The molecular weight was 845.63 [M + Na]+ in the positive-ion mode, suggesting that the obtained product was identical to 11-DGA-Suc (molecular weight = 822.63). Next, we used mass spectrometry (MS) and NMR () spectroscopy to determine purity of the generated 11-DGA-Suc and found the following: 11-DGA-Suc ESI-MS m/z: 845.63 [M + Na]+; δH values of 1H-NMR (600 MHz, CDCl3): 5.26 (1H, t, J = 3.0 Hz, H-12), 4.54 (1H, m, H-3), 4.10 (1H, m, H-1″a), 4.05 (1H, m, H-1″b), 2.69 (2H, m, H-2′), 2.63 (2H, m, H-3′), 1.14, 1.12, 0.96, 0.87, 0.86, 0.78 (3H each, s), 0.89 (3H, t, J = 6.0 Hz, H-18″); δC values of 13 C-NMR (150 MHz, CDCl3): 177.4 (C-30), 176.9 (C-1′), 172.0 (C-4′), 144.7 (C-13), 122.5 (C-12), 81.7 (C-3), 64.4 (C-1″), 55.4 (C-5), 48.3 (C-9), 47.7 (C-18), 44.4 (C-20), 43.0 (C-14), 41.7 (C-19), 39.9 (C-8), 38.5 (C-4), 38.3 (C-1), 37.9 (C-10), 37.0 (C-22), 32.7 (C-7), 31.5 (C-17), 29.8 (C-21), 29.8 (C-28), 29.4 (C-23), 28.9 (C-2), 28.4 (C-27), 28.1 (C-11), 23.7 (C-2′), 23.7 (C-3′), 18.4 (C-29), 16.9 (C-6), 16.9 (C-25), 15.7 (C-26), 14.3 (C-24).
Figure 1. Structure and 13 C-nuclear magnetic resonance (NMR) spectra of 11-DGA-Suc.
4.2. Synthesis of SA-Gal
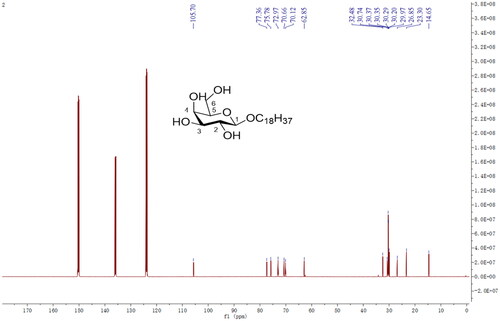
Taking stearyl alcohol as the basic skeleton of the guiding molecule, and the guiding molecule-stearyl galactoside (SA-Gal) was synthesized by a series of chemical reactions with bromoacetyl galactoside. The molecular weight was 455.33 [M + Na]+ in the positive-ion mode, suggesting that the obtained product was identical to SA-Gal (molecular weight = 432.33). Mass spectrometry (MS) and NMR spectroscopy () were used to determine the purity of the generated SA-Gal and found the following: ESI-MS m/z: 455.33 [M + Na]+; δH values of 1H NMR (600 MHz, C5D5N): 4.98 (1H, m, H-1), 4.80 (1H, m, H-1′a), 4.60 (1H, m, H-6a), 4.49 (2H, m, H-1′b, and H-6b), 4.20–4.09 (3H, m, H-2, H-3, and H-5), 3.70 (1H, m, H-4), 1.68 (2H, m, H-2′), 1.21–1.36 (m, 30H, 15 × CH2, H-3′ to H-17′), 0.88 (3H, t, J = 6.6 Hz, H-18′); δC values of 13 C NMR (150 MHz, C5D5N): 105.7 (C-1), 77.4 (C-5), 75.8 (C-3), 73.0 (C-2), 70.7 (C-4), 70.1 (C-1′), 62.9 (C-6), 32.5 (C-16′), 30.7–30.0 (C-2′, C-4′ to C-15′), 26.9 (C-3′), 23.3 (C-17′), 14.7 (H-18′).
Figure 2. Structure and 13 C-nuclear magnetic resonance (NMR) spectra of SA-Gal.
4.3. Characterization of liposomes
The characterization data of the four liposomes are shown in . It can be seen from the data in the table that the particle size of all liposomes is small and uniformly dispersed. The encapsulation efficiency of CTD is relatively high. The morphology of liposomes under a transmission electron microscope is shown in . The liposomes in the figure are round, and the phospholipid bilayer is clearly visible. Next, we designed a single factor test based on the appearance, particle size, and encapsulation efficiency of liposomes to investigate the effects of different proportions of phospholipid targeted molecules on the liposome solution. The results showed that the turbidity and particle size of liposome solution increased with the increase of the amount of targeted molecules. When the ratio of phospholipid to target molecule is 10:1, the liposome solution appeared clear and transparent with light blue opalescence, the particle size is stable, and the entrapment efficiency of CTD is >88%. It should be noted that after the addition of targeted molecules (11-DGA-Suc and SA-Gal), the liposome solution did not show any significant changes in characteristics, and remained stable in particle size, potential, and encapsulation efficiency.
Figure 3. Transmission electron photomicrographs of CTD liposomes. (A) CTD-lip; (B) SA-Gal-CTD-lip; (C) 11-DGA-Suc-CTD-lip; (D) (11-DGA-Suc + SA-Gal)-CTD-lip.
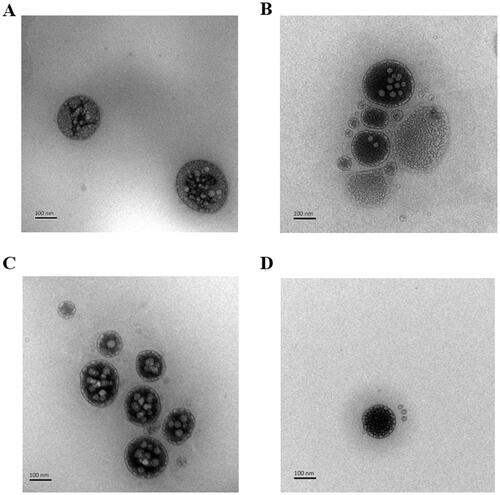
Table 2. Sizes, zeta potential, and encapsulation efficiency of different types of liposomes (n = 3).
4.4. In vitro CTD release
We evaluated in vitro CTD release from CTD-lip, 11-DGA-Suc-CTD-lip, SA-Gal-CTD-lip, 11-DGA-3-O-Gal-CTD-lip, and (11-DGA-Suc + SA-Gal)-CTD-lip at PBS (pH = 7.4) with 0.25% Tween-80. Results indicated that CTD was released from CTD-lip at a slightly faster rate than 11-DGA-Suc-CTD-lip, SA-Gal-CTD-lip, and (11-DGA-Suc + SA-Gal)-CTD-lip at 37 ± 0.5 °C (). The release curve of liposome conforms to Weibull equation (). It is worth noting that compared with CTD lip, the presence of targeted molecules does not affect the release of CTD, and the cumulative release of each CTD liposome is close to 100% at 24 h.
Figure 4. Profiles of in vitro CTD release from liposomes at PBS (pH = 7.4, 0.25% Tween-80). Data presented are means ± SD (n = 3).
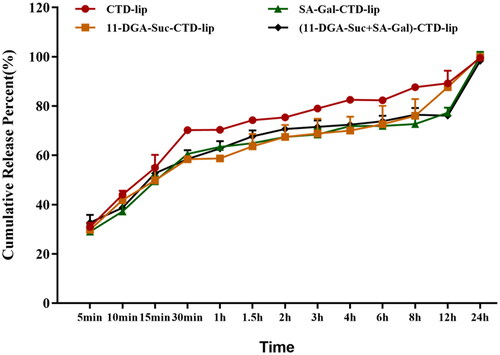
Table 3. Fitting of each CTD liposome to in vitro release profiles.
4.5. Hemolysis test results
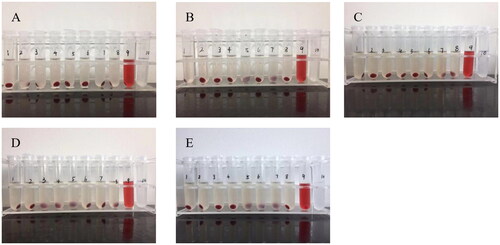
The hemolysis of SA-Gal-CTD-lip, 11-DGA-Suc-CTD-lip, and (11-DGA-Suc + SA-Gal)-CTD-lip was investigated with CTD-Lip and blank liposome as controls. After the samples were added into test tubes No. 1–7, the supernatants were colorless and transparent, and the red blood cell precipitates at the bottom were almost the same as that of the negative control (tube No. 8), and no sign of hemolysis was observed by naked eyes. Next, the hemolysis rate was measured by ultraviolet spectrophotometer, and it was found that all the hemolysis rates of Nos. 1–7 tubes were <5%, which met the requirements of intravenous injection. On the other hand, the hemolysis rate of blank liposome was <2%, and there was no obvious change in the hemolysis rate even after the addition of cantharidin, indicating that cantharidin would not cause hemolysis. Further analysis showed that the hemolysis rates of liposomes modified by targeted molecules were slightly increased but not more than 4%, which could meet the requirements of injection ().
Figure 5. Profiles of the rate of hemolysis across treatments. (A) Blank liposome; (B) CTD-lip; (C) SA-Gal-CTD-lip; (D) 11-DGA-Suc-CTD-lip; (E) (11-DGA-Suc + SA-Gal)-CTD-lip. Nos. 1–7: Test tubes, the added amount of test product (cantharidin concentration is 0.6 mg/mL) is 0.1, 0.2, 0.3, 0.4, 0.5, 0.6, and 0.7 mL; No. 8: Negative control tube without liposomes; No.9: Positive control tube without liposomes and normal saline; No. 10: Test substance control tube without red blood cell suspension.
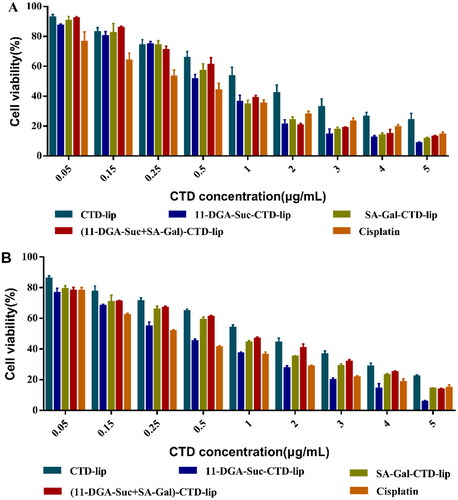
4.6. Cytotoxicity of liposomes in vitro
The cytotoxic effects of various liposomal formulations on HepG2 and L-02 cells are shown in . Summarily, both CTD-lip and modified-CTD-lips effectively inhibited the proliferation of HepG2 and L-02 cells, and their inhibitory effect on L-02 cells was stronger than that on HepG2 cells. Under similar experimental conditions, the IC50 values of SA-Gal-CTD-lip,11-DGA-Suc-CTD-lip, and (11-DGA-Suc + SA-Gal)-CTD-lip on HepG2 cells were 0.640 ± 0.048, 0.547 ± 0.040, and 0.686 ± 0.025 μg/mL, respectively. Compared with CTD-lip, the inhibitory effect of SA-Gal-CTD-lip,11-DGA-Suc-CTD-lip, and (11-DGA-Suc + SA-Gal)-CTD-lip on HepG2 cell proliferation was increased by 1.98, 2.32, and 1.85 times, respectively.
Figure 6. Profiles of cytotoxic effects of various liposomal formulations on (A) HepG-2 cells and (B) L-02 cells. Data presented are means ± SD (n = 6).
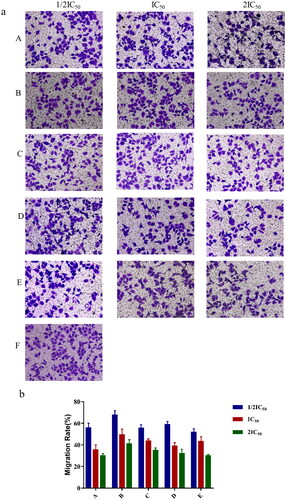
4.7. Effect of liposome formulations on cell migration
Transwell chemotactic assay was used to determine whether liposomal formulations affected the migration abilities of HepG-2 cells. The results showed that 11-DGA-Suc-CTD-lip, SA-Gal-CTD-lip, and (11-DGA-Suc + SA-Gal)-CTD-lip significantly inhibited the migration of HepG2 cells compared to CTD-lip, and the higher their concentration (1/2IC50, IC50, 2IC50), the stronger the inhibition ().
Figure 7. The effect of liposomes on HepG2 cells migration via transwell assays. Cells were stained by crystal violet and counted by microscope after being treated with CTD-lip, 11-DGA-Suc-CTD-lip, SA-Gal-CTD-lip, (11-DGA-Suc + SA-Gal)-CTD-lip, respectively (a). Three concentrations (1/2IC50, IC50, 2IC50) were set to evaluate the cells migration. The number of cells traversed through the filter was displayed in bar chart (b). (A) Cisplatin; (B) CTD-lip; (C) 11-DGA-Suc-CTD-lip; (D) SA-Gal-CTD-lip; (E) (11-DGA-Suc + SA-Gal)-CTD-lip; (F) Control.
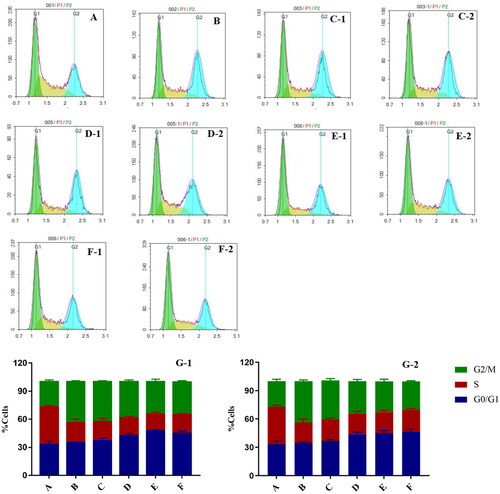
4.8. Effect of liposome formulations on the cell cycle
The effects of liposomes on the cell cycle were investigated using flow cytometry, as shown in . At IC50 and 1/2 IC50, compared to the blank control, the number of cells in the G0/G1 and G2/M phase was significantly higher in 11-DGA-Suc-CTD-lip, SA-Gal-CTD-lip, and (11-DGA-Suc + SA-Gal)-CTD-lip groups, indicating that modified liposome arrested the cell cycle mainly in G0/G1 phases. While the proportion of G2/M phase cells in the CTD-lip group and cisplatin group was significantly higher than that in the blank control group, indicating that they arrested the cell cycle mainly in G2/M phase.
Figure 8. Flow cytometry results show the effects of liposomes on the cell cycle. HepG2 cells were treated with two concentrations (IC50 and 1/2IC50) of CTD-lip, SA-Gal-CTD-lip, 11-DGA-Suc-CTD-lip, (11-DGA-Suc + SA-Gal)-CTD-lip. (A) Control; (B) Cisplatin; (C) CTD-lip; (D) SA-Gal-CTD-lip; (E) 11-DGA-Suc-CTD-lip; (F) (11-DGA-Suc + SA-Gal)-CTD-lip; (G) Statistical bar chart; (1) High-dose group (IC50); (2) Low-dose group (1/2IC50).
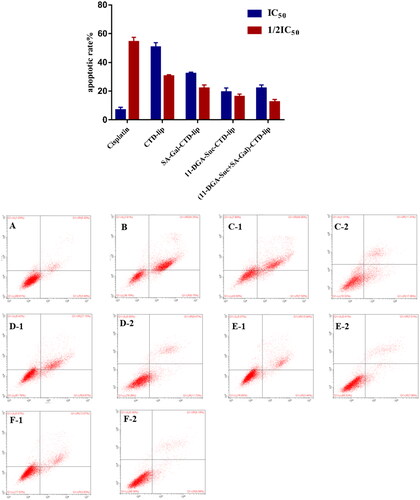
4.9. Effects of liposomes on apoptosis
Flow cytometry results revealed that a large number of living cells were dominant in the blank control group after 48 h of treatment, with an apoptotic rate (early and late apoptosis) of 9.43 ± 1.86%. In the cisplatin positive control group, the apoptotic cells in the early and late stage were obviously increased, and the apoptotic rate was 61.62 ± 2.53%. Moreover, compared with blank control group, the proportion of early and late apoptotic cells in the cantharidin-containing liposome groups was significantly increased, and the difference in apoptotic rate between different concentrations was statistically significant (p < 0.01) (). In addition, there was no significant increase in apoptosis rate between liposomes modified by targeting molecules and those in the CTD-lip group.
Figure 9. Effect of liposome treatment on apoptosis of HepG2 cells. HepG2 cells were treated with liposomes at 2 concentrations (IC50, 1/2IC50), respectively. (A) Control; (B) Cisplatin; (C) CTD-lip; (D) SA-Gal-CTD-lip; (E) 11-DGA-Suc-CTD-lip; (F) (11-DGA-Suc + SA-Gal)-CTD-lip; (1) High-dose group (IC50); (2) Low-dose group (1/2IC50).
4.10. Liposome pharmacokinetic properties
Using GC/MS to detect the concentration of CTD in rat plasma, we tried to understand the metabolic characteristics of several liposomes in vivo. The results in suggest that the average plasma concentration curves of the four liposomes in vivo are very similar. It is worth noting that CTD was rapidly eliminated in the first hour. We speculate that it may be caused by the rapid metabolism of free CTD in liposome solution in liver and kidney, and the rupture of some liposomes. After 1 h, the rate of CTD clearance slowed down. A non-compartment model was used to evaluate the plasma concentration curve of liposomes. It can be concluded from the results in that compared with CTD lip, the elimination half-life (T1/2β) of the other three targeted liposomes decreased to varying degrees, indicating that the targeted liposomes can be rapidly distributed from blood to tissue. This may be related to the recognition and binding of the receptor on the liver cell membrane to the target molecule that modifies the surface of the liposome. Meanwhile, the mean plasma clearance (CL) of the three modified liposomes was higher than that of CTD-lip (0.57 ± 0.10 L/h kg), but the mean residence time (MRT) was less than that of CTD-lip (5.14 ± 1.16 h). The results suggested that the targeted molecule modified liposomes were cleared more quickly in the circulatory system. In addition, the data of the central chamber distribution volume (Vc) proved that the three modified liposomes were more easily distributed in rat tissues than unmodified liposomes. SA-Gal-CTD-lip, 11-DGA-Suc-CTD-lip, and (11-DGA-Suc + SA-Gal)-CTD-lip were about 1.19, 1.09, and 1.03 times less than that of CTD-lip (756.38 ± 15.12 μg/L·h). Notably, The AUC values of the three modified liposomes decreased with the increase of CL value. It was speculated that the presence of targeted molecules would lead to the rapid removal of CTD from plasma. Taken together, SA-Gal or11-DGA-Suc modified CTD-lip has significantly different pharmacokinetic properties from unmodified CTD-lip.
Figure 10. Mean plasma concentration of CTD in rats after intravenous administration (mean ± SD, n = 6).
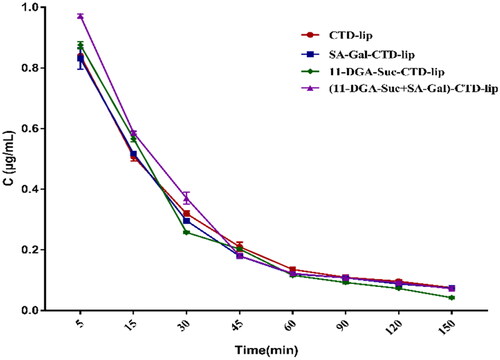
Table 4. Pharmacokinetic parameters in rat plasma after intravenous administration of CTD-lip SA-Gal-CTD-lip, 11-DGA-Suc-CTD-lip, and (11-DGA-Suc + SA-Gal)-CTD-lip.
4.11. Effect of liposome formulations on tissue distribution
CTD-lip, SA-Gal-CTD-lip, 11-DGA-Suc-CTD-lip, and (11-DGA-Suc + SA-Gal)-CTD-lip were injected into rats through the tail vein, and the CTD concentrations in the heart, liver, spleen, lung, and kidney of the rats at different time points were analyzed, as shown in . The comparison of CTD content per gram tissue in each organ of rats showed that for the CTD liposomes modified by each targeted molecule, the contents of cantharidin in the liver per unit weight were higher at different times, which were generally significantly higher than those in other organs. At 5–60 min after administration, the concentration of cantharidin in liver in each group, and the concentration of cantharidin in liver reached the highest level at 30 min.
Figure 11. Concentration of CTD in various rat tissues after intravenous administration. (A) CTD-lip; (B) SA-Gal-CTD-lip; (C) 11-DGA-Suc-CTD-lip; (D) (11-DGA-Suc + SA-Gal)-CTD-lip; (E) distribution of the CTD content in the liver with different modified liposomes. Data presented are means ± SD (n = 6).
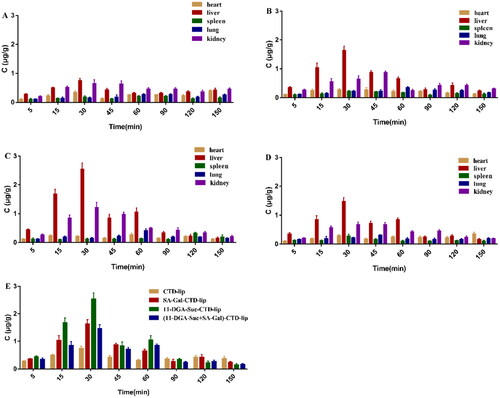
Comparison of CTD distribution of each modified liposome in the rat liver revealed that CTD content of 11-DGA-Suc-CTD-lip group was significantly higher than those of the other liposome groups, and the CTD content in rat livers of each modified liposome group was significantly different from that of the CTD-lip group (p < 0.05). These results suggest that liposomes modified by targeting molecules increase the content of CTD acting on the liver. To study the liver targeting ability of liposomes, we analyzed the concentration-time data. AUC0–t and Cmax were used to calculate and evaluate various parameters of liposome targeting ability, and the results were shown in and . The numerical value of targeting efficiency (Te) reflects the selectivity of different liposomes to target organs. In this experiment, the Te value of the three modified liposomes in the liver is greater than CTD lip(26.93 ± 2.65%). It suggests that the selectivity of unmodified liposomes to liver is worse. And there is no statistical difference between the Te values of CTD lip in liver and kidney.
Table 5. Pharmacokinetic parameters of CTD-lip, SA-Gal-CTD-lip, 11-DGA-Suc-CTD-lip, and (11-DGA-Suc + SA-Gal)-CTD-lip in rat tissues.
Table 6. Targeting parameters of CTD-lip, SA-Gal-CTD-lip, 11-DGA-Suc-CTD-lip, and (11-DGA-Suc + SA-Gal)-CTD-lip in rat tissues.
While the Te values of SA-Gal-CTD-lip, 11-DGA-Suc-CTD-lip, and (11-DGA-Suc + SA-Gal)-CTD-lip in the liver were 37.57 ± 4.52, 41.57 ± 2.32, and 36.45 ± 3.87%, respectively, which were all higher than that of CTD-lip. These results indicated that SA-Gal and 11-DGA-Suc had stronger liver targeting than CTD-lip, which might be related to their specific recognition by corresponding receptors. Relative targeting efficiency (RTe) strictly refers to a comparison between targeted and non-targeted preparations. Because cantharidin is very toxic and difficult to dissolve in water, the non-targeted preparation group (cantharidin solution group) did not be designed. Therefore, RTe was defined as a comparison between liposomes modified by targeting molecules and CTD-lips in this study, which could reflect the improvement of the liposomes’ targeting ability to organs after modification by targeting molecules. The results of this study showed that the liver targeting efficiency of SA-Gal-CTD-lip, 11-DGA-Suc-CTD-lip, (11-DGA-Suc + SA-Gal)-CTD-lip was 1.40, 1.54, and 1.35 times, higher than that of CTD-lip, respectively, suggesting that they had significant liver targeting. The relative uptake rate (Re) refers to the comparison of the tissue AUC between the targeting molecule modificated liposomes and CTD-lip. Re value >1 implies that the liposome modified by the targeting molecule has a stronger targeting ability to the organ or tissue than the CTD-lip. In this study, the relative uptake rates of SA-Gal-CTD-lip, 11-DGA-Suc-CTD-lip, and (11-DGA-Suc + SA-Gal)-CTD-lip in the liver were 1.49, 1.89, and 1.32, respectively. Finally, the peak concentration ratio (Ce) indicates the effect of liposome formulation on changing the CTD distribution. The larger the Ce value, the more obvious the influence on the CTD distribution. Here, 11-DGA-Suc-CTD-lip had the largest Ce value in the liver (3.39), which further confirmed that it had high liver-targeting efficiency. Therefore, it was evident that the addition of targeting molecules improved the selectivity of the liposomes to the liver and made them exhibited active liver targeting in comparison with CTD-lip.
4.12. In vivo anti-tumor efficacy
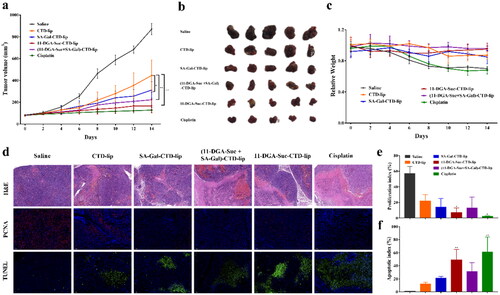
The in vivo anti-tumor effects of liposomes were investigated in the HepG2 hepatic neoplasm model, as shown in . Compared with CTD-lip group, the tumor volume growth rate of each modified liposome group was lower (p < 0.05). Among them, 11-DGA-Suc-CTD-lip showed the best antitumor effect, with a tumor inhibition rate of up to 80.96%. The dominant tumor suppression of 11-DGA-Suc-CTD-lip was further confirmed by significant cancer cell depletion in H&E histological analysis. Moreover, the strongest inhibitory effect on cell proliferation was observed in the 11-DGA-Suc-CTD-lip group, with the lowest proliferation index of 7% in PCNA assay and the highest apoptotic index of 49% in TUNEL assay. Finally, no significant changes in body weight were observed in mice treated with modified liposomes, indicating that they were well-tolerated at the tested dose level.
Figure 12. (a) Primary tumor growth profile in HepG2 hepatic neoplasm model upon treatment with different formulations every 2 days at a CTD dose of 2 mg/kg. (b) Tumors collected in day 15. (c) Body weight of HepG2 tumor bearing mice during the whole treatment. (d) H&E, PCNA, and TUNEL staining of tumor sections. (e) Quantitative analysis of proliferation indices expressed as the percentage of PCNA-positive cells in total tumor cells at five randomly selected microscopic fields by Image J. (f) Quantitative analysis of apoptotic indices expressed as the percentage of TUNEL-positive cells in total tumor cells at five randomly selected microscopic fields by Image J. Data are represented as mean ± SD (n = 5). *p < 0.05; **p < 0.01; vs. CTD-lip.
5. Conclusion
Cantharidin has low solubility, which not only makes its adsorption difficult but also results in low bioavailability. At present, researchers have employed the nanoliposome technology to effectively solve this problem. In this study, we successfully constructed an active targeting liposome for tumor penetration delivery of cantharidin to achieve efficient suppression of hepatocellular carcinoma. This novel system was therapeutically efficacious both in vitro and in vivo. Specifically, the liposomes modified by 11-DGA-Suc or SA-Gal showed excellent in vivo and in vitro targeting properties relative to CTD-lip, significantly improving the inhibitory effect on the growth of tumor cells, inducing apoptosis of tumor cells, and prolonging survival times of tumor-bearing mice.
We also employed NMR to confirm the chemical structure of 11-DGA-Suc and SA-Gal, then successfully prepared cantharidin liposomes via the thin-film evaporation method. The modified liposomes had an encapsulation efficiency of above 85%, with a particle size of about 110–130 nm and oxidation product values that met the requirements. Next, we determined their in vitro release via dialysis, and selected PBS7.4 containing 0.25% Tween-80 as the release medium. The CTD release rule conformed to the Weibull release equation, which belongs to the typical burst-sustained release model. In this study, we encapsulated the insoluble antitumor monomer cantharidin in liposomes to increase their concentration in an aqueous solution, which laid the foundation for its efficacy.
In vitro, the modified liposomes displayed higher cytotoxicity and inhibitory effects on the migration of HepG2 cells, relative to CTD-lip. However, they did not increase the apoptotic rate of cells. The results from in vivo pharmacokinetics showed that the cantharidin liposomes were rapidly distributed to various organs after modification by 11-DGA-Suc or SA-Gal. Furthermore, the modification of targeting molecules improved the selectivity of liposomes and conferred them with an active targeting effect on the liver, relative to CTD-lip. Analysis of tissue distribution indicated that 11-DGA-Suc-CTD-lip had better liver-targeting ability than the other molecule-modified liposomes. This efficient liver targeting property contributed to increased CTD effective concentration at intracellular targets for tumor growth in vivo. The dual-target liposome (11-DGA-Suc + SA-Gal)-CTD-lip did not show better targeting and anti-tumor effects than the single-target liposome. We speculate that it may be due to the larger molecular structure of the two ligands, which increases the spatial site resistance and hinders the binding of the receptor to the ligands to some extent.
Taken together, the 11-DGA-Suc-CTD-lip is a promising and potential drug delivery system for hepatocellular carcinoma treatments, although its stability under storage conditions requires further research exploration. This designed injectable active targeting nanoliposome may not only allow a much lower dosage regimen without loss of therapeutic effect but also solve the limitations associated with the application of insoluble monomers in HCC treatment. In the future, it could be potentially combined with other therapies for HCC treatment.
Author contributions
Manshu Zou designed the study, carried out the experiments, and drafted the manuscript. Yilin Xu and Peng Lin conducted the experiments. Lili Zhou and Xinhua Xia designed the study and managed this project. The manuscript was written through the contributions of all authors. All authors have approved the final version of the manuscript.
Additional information
Funding
References
- Albinali, K.E., et al., 2019. A perspective on magnetic core-shell carriers for responsive and targeted drug delivery systems. International journal of nanomedicine, 14, 1707–1723.
- AlSawaftah, N.M., et al., 2021. Transferrin-modified liposomes triggered with ultrasound to treat HeLa cells. Scientific reports, 11 (1), 11589.
- Chapiro, J., et al., 2014. Radiologic-pathologic analysis of contrast-enhanced and diffusion-weighted MR imaging in patients with HCC after TACE: diagnostic accuracy of 3D quantitative image analysis. Radiology, 273 (3), 746–758.
- Chen, W., et al., 2021. Exosome in hepatocellular carcinoma: an update. Journal of cancer, 12 (9), 2526–2536.
- Deng, L., et al., 2017. A laser-activated biocompatible theranostic nanoagent for targeted multimodal imaging and photothermal therapy. Theranostics, 7 (18), 4410–4423.
- Ehexige, E., et al., 2020. Silencing of STAT3 via peptidomimetic LNP-mediated systemic delivery of RNAi downregulates PD-L1 and inhibits melanoma growth. Biomolecules, 10 (2), 285.
- Farina, C., Pinza, M., and Pifferi, G., 1998. Synthesis and anti-ulcer activity of new derivatives of glycyrrhetic, oleanolic and ursolic acids. Farmaco, 53 (1), 22–32.
- Kong, L., et al., 2020. Transferrin-modified Osthole PEGylated liposomes travel the blood-brain barrier and mitigate Alzheimer’s disease-related pathology in APP/PS-1 mice. International journal of nanomedicine, 15, 2841–2858.
- Li, W., et al., 2012. Development of a gene therapy strategy to target hepatocellular carcinoma based inhibition of protein phosphatase 2A using the α-fetoprotein promoter enhancer and pgk promoter: an in vitro and in vivo study. BMC Cancer, 12, 547.
- Li, W.J., et al., 2018. Liver-targeted delivery of liposome-encapsulated curcumol using galactosylated-stearate. Experimental and therapeutic medicine, 16 (2), 925–930.
- Liu, G., et al., 2020b. Increased oxidative phosphorylation is required for stemness maintenance in liver cancer stem cells from hepatocellular carcinoma cell line HCCLM3 cells. International journal of molecular sciences, 21 (15), 5276.
- Liu, K., et al., 2020a. Construction and validation of a nomogram for predicting cancer-specific survival in hepatocellular carcinoma patients. Scientific reports, 10 (1), 21376.
- Liu, X., et al., 2021. Higher intake of whole grains and dietary fiber are associated with lower risk of liver cancer and chronic liver disease mortality. Nature communications, 12 (1), 6388.
- Liu, Y., et al., 2020c. Targeted gene silencing BRAF synergized photothermal effect inhibits hepatoma cell growth using new GAL-GNR-siBRAF nanosystem. Nanoscale Research Letters, 15 (1), 116.
- Maione, F., et al., 2019. Long-lasting anti-inflammatory and antinociceptive effects of acute ammonium glycyrrhizinate administration: pharmacological, biochemical, and docking studies. Molecules, 24 (13), 2453.
- Makowski, M., et al., 2019. Advances in lipid and metal nanoparticles for antimicrobial peptide delivery. Pharmaceutics, 11 (11), 588.
- Mizuhata, M., et al., 2018. Respiratory-gated proton beam therapy for hepatocellular carcinoma adjacent to the gastrointestinal tract without fiducial markers. Cancers, 10 (2), 58.
- Myrhammar, A., et al., 2020. Evaluation of an antibody-PNA conjugate as a clearing agent for antibody-based PNA-mediated radionuclide pretargeting. Scientific reports, 10 (1), 20777.
- Pires, L., et al., 2020. Dual-agent photodynamic therapy with optical clearing eradicates pigmented melanoma in preclinical tumor models. Cancers, 12 (7), 1956.
- Ruman, U., et al., 2020. Nanocarrier-based therapeutics and theranostics drug delivery systems for next generation of liver cancer nanodrug modalities. International journal of nanomedicine, 15, 1437–1456.
- Schoenberg, M.B., et al., 2018. Perivascular tumor-infiltrating leukocyte scoring for prognosis of resected hepatocellular carcinoma patients. Cancers, 10 (10), 389.
- Shengde, S., et al., 2010. A new synthetic method of L-menthyl-β-D-galactoside. Guangzhou chemistry, 9 (15), 113–119.
- Wancui, J., et al., 2006. Synthesis, purification and characterization of menthol glycosides. Journal of food and biotechnology, 9 (30), 115–119.
- Wang, Q.S., et al., 2019. Co-delivery of glycyrrhizin and doxorubicin by alginate nanogel particles attenuates the activation of macrophage and enhances the therapeutic efficacy for hepatocellular carcinoma. Theranostics, 9 (21), 6239–6255.
- Wang, Y., et al., 2017. XWL-1-48 exerts antitumor activity via targeting topoisomerase II and enhancing degradation of Mdm2 in human hepatocellular carcinoma. Scientific reports, 7 (1), 9989.
- Xie, Q.L., Liu, Y., and Zhu, Y., 2016. Chromosome region maintenance 1 expression and its association with clinical pathological features in primary carcinoma of the liver. Experimental and therapeutic medicine, 12 (1), 59–68.
- Xing, J., et al., 2019. Novel lipophilic SN38 prodrug forming stable liposomes for colorectal carcinoma therapy. International journal of nanomedicine, 14, 5201–5213.
- Zhang, J., et al., 2018. A distinctively expressed long noncoding RNA, RP11-466I1.1, may serve as a prognostic biomarker in hepatocellular carcinoma. Cancer medicine, 7 (7), 2960–2968.
- Zhang, X., et al., 2017. Augmented anticancer effects of cantharidin with liposomal encapsulation: in vitro and in vivo evaluation. Molecules, 22 (7), 1052.
- Zhao, M., et al., 2018. Targeted therapy of intracranial glioma model mice with curcumin nanoliposomes. International journal of nanomedicine, 13, 1601–1610.
- Zhou, L., et al., 2019. Development of 11-DGA-3-O-Gal-modified cantharidin liposomes for treatment of hepatocellular carcinoma. Molecules, 24 (17), 3080.
- Zhu, J., et al., 2018. Preparation and characterization of norcantharidin liposomes modified with stearyl glycyrrhetinate. Experimental and therapeutic medicine, 16 (3), 1639–1646.
- Zhu, K., et al., 2020. 18-GA-Suc modified liposome loading cantharidin for augmenting hepatic specificity: preparation, characterization, antitumor effects, and liver-targeting efficiency. Journal of pharmaceutical sciences, 109 (6), 2038–2047.