
 ?Mathematical formulae have been encoded as MathML and are displayed in this HTML version using MathJax in order to improve their display. Uncheck the box to turn MathJax off. This feature requires Javascript. Click on a formula to zoom.
Abstract
The modern civil aircraft engine is a type of highly complex engineering system in design, manufacturing, and life-cycle management. They are constantly operated under extreme and critical conditions, and yet, high reliability and safety are top priorities in the civil aviation industry. To ensure top performance and efficiency in operations, engines follow a modular design. This article intends to apply the data-driven cluster analysis to real-life operation data for aircraft engine fleets, which provides a module maintenance priority recommendation solution to increase the efficiency of operations and best use of the engine values.
1. Introduction
The interest in the topic of fleet management has been increasing in recent years, especially on major transportation formats, including airplanes (Burke et al. Citation2010), trains (Lu and Schnieder Citation2014), and automobiles (Nair and Miller-Hooks Citation2011).
The researches being carried out intend to solve problems based on the functions of these transportation formats, as well as the efficiency and safety of the assets within each managed fleet. One significant improvement for fleet management comparing to considering each fleet member independently is the increase of efficiency in task planning (Sohoni, Lee, and Klabjan Citation2011), as well as saving costs on the fleet life-cycle. This is particularly beneficial in fleet maintenance planning (Sheng and Prescott Citation2016), spare parts procurement (Horenbeek et al. Citation2013), and warehouse management (Accorsi et al. Citation2017). In order to perform successful and effective fleet management, the identification of similarities in performance characteristics for member assets within fleets is vital. The identification enables the concept of threating members in the fleet as clusters.
A challenging problem that arises in this domain is the evaluation of performances. Two popular approaches on the evaluation of performance are: (1) Probability of Failure (PoF) at a system level based on time (Zhou, Lopes Genez, et al. Citation2022; Zhou, Li, et al. Citation2022). (2) Remaining Useful Life (RUL) of the system where life is measured by time (Zhou, McGinty, and Parlikad Citation2020). The research focus of this article, complex systems in the aviation industry, is unique in the measurement of life. Each aviation system in our data collection is recorded for its life in a dual-time-scale measurement, one being “hour” in time, the other one being “cycle” in time (one cycle meaning one take-off and one landing of an airplane). With the dual-time-scale, by conventional system performance evaluation, isolating and only considering either one of the two time scales is not comprehensive to evaluate the aviation systems. Also, to our knowledge, few studies have yielded the evaluation of aviation systems by combining both time scales. In this article, we propose a novel performance profile index (PPI) for aviation systems by jointly combining the dual-time-scale evaluation.
Another primary problem in the aviation industry is the standard of performance evaluation, which fundamentally leads to the datasets being collected. Due to the complexity of the aviation systems, traditional sensor data evaluation (Yedavalli and Belapurkar Citation2011) is well performed on each single system independently. But, due to the nature of large datasets, it is highly difficult to assemble identical datasets for all members of systems within a fleet; therefore, it is difficult to establish a universal evaluation standard for fleet management with identification of performance clusters. In this article, we propose an effective framework by utilizing the minimum collection of data. This framework has significant benefits in terms of high data quality, simplicity in dataset assembling for industrial organizations, and the analysis results being highly trustworthy, highly explainable and highly applicable.
There is a further problem with clustering for fleet management, which is the most reasonable number of clusters without pre-defined knowledge. Although studies have provided statistical approaches for major clustering algorithms, the reality of clustering results is on case-by-case based varieties. There has been less previous evidence for the clustering number determination for aviation systems; therefore, a new approach is needed for the determination of applicable number of clusters for performance evaluation of the systems. The objective of this article is thus to provide the solution of the clustering algorithm and to demonstrate the feasibility of it. The feasibility is tested by qualitative semantic concordance analysis utilizing the natural language processing (NLP) skills for maintenance and diagnostics logbook within the collected dataset.
This article is organized as follows. In Section 2, a literature review is provided on works related to fleet management, as well as the existing clustering methods applied in different industrial backgrounds. Section 3 provides the general data analysis workflow and explained in details of each step. Section 4 is the case study that focuses on the application of the methodologies, especially the clustering methods to the processed data, in order to determine the most reasonable number of clusters and, therefore, perform the clustering algorithm to obtain results. Section 5 provides a further application of this research in the aviation industry. Finally, the conclusion and future work is provided in Section 6.
2. Literature review
This literature review contains two major backgrounds of this article, being the development in fleet management and the clustering methods being applied in a variety of research backgrounds.
2.1. Fleet management
Fleet management is the management of transportation assets including aviation machinery, rails, commercial motor vehicles, or other non-powered engineering assets including power generators and oil rigs. The fleet management is beneficial in multiple ways. Papadakos Papadakos (Citation2009) applied the accelerated Benders’ decomposition in the sequential optimization approach for airline fleet scheduling which proves its value in significantly saving costs for the airlines. Cacchiani and Salazar-González (Citation2017) integrated fleet assignment, aircraft routing, crew pairing, and aircraft maintenance into solutions for real-world dataset, and proves that the proposed arc-path method performs well in fast achieving the optimal solutions.
Apart from scheduling of transportation, which is a common problem fleet management approaches aim to tackle, another aspect is on the planning of maintenance. Vujanović et al. (Citation2012) evaluated the Decision Making Trial and Evaluation Laboratory (DEMATEL) as well as the Analytic Network Process (ANP) on fleet maintenance management of vehicles. Feng et al. (Feng et al. Citation2017) proposed a heuristic hybrid game method on the condition-based fleet maintenance planning. The consideration on planning maintenance as a fleet also leads to the fleet consideration on spare parts procurement. Yongquan et al. (Citation2016) assumed a two-sample prediction for first failure time based on a Weibull distribution and a Weibull process, thus proposed ordering spare parts framework for a new fleet of aircrafts, however the authors assumed a simple Weibull process in predicting the failure time, which is based on the hours of operation of aircrafts. As previously introduced in this article from the introduction, it is not comprehensive to predict failures of aviation systems by only considering the hours of operation. Similar evaluation in aircraft performances exists in (Sheng and Prescott Citation2016), which only considers one time scale in measuring the aviation systems’ lives.
2.2. Clustering methods
Clustering method is widely applied in many research backgrounds and is considered as an important tool and a fundamental initial data processing step to reveal the structures and similarities within targeted groups. Sohn et al. Sohn, Kim, and Harries (Citation2008) applied the concept of clustering in analyzing the damage of the fiber-reinforced polymer (FRP) composite materials which is a new and important new material in civil engineering and construction. da Silva et al. da Silva et al. (Citation2008) examined the fuzzy clustering methods and applied on structural health monitoring for damage detection. Clustering is also widely applied in for example, the healthcare system analysis (Wendt Citation2009), financial services and banking (Tola et al. Citation2008), medical research (Soler et al. Citation2016; Fava et al. Citation2012). These initial clustering all leads to detection of similarities within each research background and established novel analytical results by further studies on inner cluster phenomenon. The literature review briefly described the advantage of considering engineering systems as a fleet and development management approaches based on clustered similarities within members of clusters belonging to fleets. By observation, it is highly beneficial to introduce the clustering approaches into fleet management. The similarities provided by clustering analysis provide deeper insights and understandings for the entire fleet. This research is a continuous study of the initial concept first introduced by Zhou et al. (Zhou, Brintrup, and Parlikad Citation2021), while the case study dataset was also provided in the existing literature (Zhou, Lopes Genez, et al. Citation2022; Zhou et al. Forthcoming).
3. Methodology
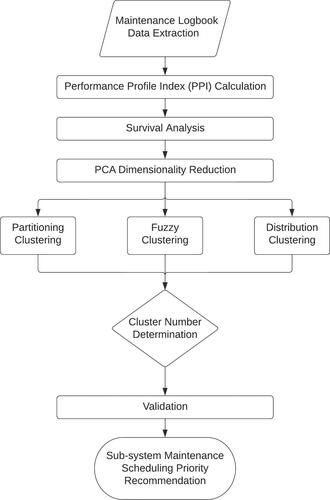
In this section, the procedure of the data analysis is introduced. The procedure follows the flowchart provided in . In this section, the detailed explanation of each step is provided.
Figure 1. Procedure of maintenance priority recommendation by maintenance logbook data analysis.
3.1. Defining dual-time scale measurement performance profile index
One concept this article proposes is the performance profile of a complex aviation system under dual time-scale measurement. Due to the operation track-record of each individual system, the final symptoms being diagnosed from the system that enables an overhaul are either contributed more by the hour-measurement or more by the cycle-measurement, a representing failure mechanism toward hour-measurement is the physical degradation of creep for components operating under extreme high temperature, a general power law description of the steady-state creep rate on pure metal and alloy (Kassner and Pérez-Prado Citation2000) is
(1)
(1)
Here, A0 is a constant, k is Boltzmann’s constant, E is Young’s modulus, T is the temperature, σss is the stress, ϵss is the strain, and Qc is the activation energy for creep, and n is an exponent constant dependent on the creep mechanism. Under normal operation, metal and alloy components within airplanes operated under extreme high temperature suffer from potential failures of materials due to operational time measured in hours.
A representing failure mechanism toward cycle-measurement is corrosion fatigue where components are vulnerable with each take-off-landing cycle due to cyclic loadings. A typical corrosion fatigue process for aviation components starts by particles striking the surface of the metal material, scratching the anti-corrosive coatings and imitate pits on the material surface. The pit initiation is followed by crack propagation due to fatigue (Zhou et al. Citation2017; Zhou et al. Citation2018), for which the crack propagation rate is widely described by the Paris’ law (Schütz Citation1996):
(2)
(2)
where a is the crack length,
is the stress intensity factor, which is related to the geometry shape of the crack, and C and m are the constants related to material properties. The crack growth rate
after pit initiation is related to the loading cycles N.
With the above failure mechanism as potential overhaul causes, and the operation of flight routes with different hour/cycle ratio, the diagnosed symptoms for a system to go through an overhaul in this article is evaluated by the contribution of hour-related or cycle related degradation failure mechanisms. Hence, the definition of dual-time scale measurement performance profile. In order to determine the contribution of the dual-time scale measurement, both the data collected for Service Time Before Overhaul (hour) and Service Time Before Overhaul (cycle) are normalized, taking the largest value in the dataset as the upper boundary and 0 as the lower boundary. Assume there are n individual systems within the dataset of a system family, and each of the individual system going through an overhaul with a measurement of hour hi and a measurement of cycle ci, where Among all the measurements, the maximum service time measurement by hour is hmax and the maximum service time measurement by cycle is cmax. Therefore, we have
(3)
(3)
For each individual system with a performance dual measurement the normalized dual measurement is
(4)
(4)
Each system, with the normalized values, is considered as a vector within the 2-dimentional coordinate surface. This means each overhaul record contains a direction and a magnitude referring to the original point of O(0, 0), which is the system’s start of service. The vector is represented as:
The Performance Profile Index (PPI) of an individual system within a family is thus defined as the magnitude of the vector
(5)
(5)
3.2. Survival analysis
The Kaplan–Meier estimator (Kaplan and Meier Citation1958) is applied for the survival analysis of a family of systems:
(6)
(6)
Here, di represents the total overhaul cases recorded at vector end point, within the area controlled by the radius of
And si is the number of survival systems (systems that have not yet going through overhaul) at PPi – in other words, the remaining healthy systems at performance profile
Sorting the data points within the dataset according to its survival analysis, each data point contains three types of information: the normalized hour value, the normalized cycle value, and the fleet survival rate value. These are represented as
(7)
(7)
With this calculation step, the dataset for the overhaul data with performance profile calculation and survival analysis of the entire fleet is expressed as
(8)
(8)
Here, in EquationEq. (8)(8)
(8) , the matrix
is a
dimensional matrix and x represents any system family of the civil aircraft engine fleets being studied.
3.3. Principal Component Analysis (PCA)
In order to perform the clustering analysis, the three-dimensional dataset of is in need of a dimensional reduction. One of the common dimensionality reduction methods is the principal component analysis (PCA). The purpose of performing PCA in the dataset is that the clustering algorithm performs better while the dataset maintains the most information and the topological relationships among all the data points. The data values are transferred into another two-dimensional coordinate. This is specifically a 3-dimensional to 2-dimensional transferring problem, taking the following steps:
Step 1: Select the center of all the three-dimensional data points from the dataset of
each value in tuple
Step 2: Each value of the matrix
Step 3: Calculate covariance matrix
Step 4: Calculate the eigenvalue and eigenvector of matrix
Step 5: Sort eigenvalue from large to small, form the eigenvectors into transforming matrix
Step 6:
3.4. Clustering methods
In order to reasonably cluster the processed overhaul data from aviation systems into sub-groups, three major clustering methods are explored and then evaluated for the clustering results.
3.4.1. Partitioning clustering
3.4.1.1. Clustering algorithm
K-means: The first clustering algorithm being examined in this research is the K-means algorithm. K-means is a hard-clustering method where each data point is allocated to one sub-group and one only. K-means classifies each data point with its nearest cluster centroid by calculating the distances among them. The distance metrics being used the most frequently are the Euclidean Distance (ED) and the Manhattan Distance (MD). The two definitions of the distance metrics are given in EquationEqs. (10)(10)
(10) and (30) for ED and EquationEqs. (11)
(11)
(11) and (31) for MD, assuming ai and bi are each an n-dimensional vector.
(10)
(10)
(11)
(11)
K-means requires a pre-defined number of clusters, with random initiated centroids of clusters. This is followed by optimizing the objective function of (Liao Citation2005):
(12)
(12)
where
are the observations in the dataset, and
are the centroids of the pre-defined number of clusters, and l is the distance function in EquationEqs. (10)
(10)
(10) and Equation(11)
(11)
(11) .
3.4.1.2. Determination of cluster number
In order to obtain the most reasonable number of clusters without pre-defined knowledge, it is important to evaluate the effects of the number of clusters in a mathematical and statistical approach. For K-means partitioning clustering method, the popular determination of cluster number is the “elbow” method, and the silhouette statistic index.
The “elbow” method aims to calculate the Within-Cluster-Sum of Squared Errors (WSS) for all the potential values of the number of clusters, and choose the value of the number when the WSS first start to converge (Green, Staffell, and Vasilakos Citation2014).
The silhouette statistic index aims to measure the similarity for a data point among its own cluster and all the other clusters. Assume the number of data points in the cluster Ci in which the data points originally belong to is the number of data points in the cluster the data point does not belong
as
where
and can be described as (Xu, Xu, and Wunsch Citation2012)
(13)
(13)
Here, is the measurement of the fitness that the data point belongs to its original cluster,
is the data point’s closest neighbor cluster, and is the data point’s next best fit cluster,
is the silhouette which measures the wellness this data point is classified. From the definition,
And the closer
is to 1 the better clustered result has been achieved.
3.4.2. Fuzzy clustering
3.4.2.1. Clustering algorithm
Fuzzy C-means: The fuzzy C-means clustering method is an extension of the hard-clustering method of K-means. The major difference is the inclusion of the fuzzy-partition matrix. Hence, the objective is to optimize the function suggested by Liao (Citation2005):
(14)
(14)
The introduction of fuzzy-partition matrix wij enables the evaluation of the likelihood that a data point belongs to each cluster, called the membership value. While the larger the fuzziness of k, the smaller the membership value is. wij is defined as (Liao Citation2005)
(15)
(15)
where ch is the centroids of clusters that are not cluster cj, and
The centroid calculated by the fuzzy C-means algorithm is (Liao Citation2005)
(16)
(16)
3.4.2.2. Determination of cluster number
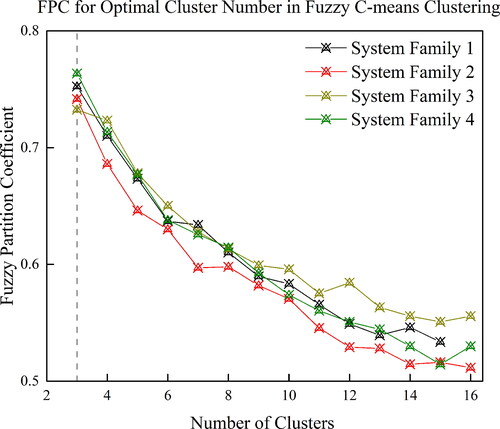
One of the popular methods of determining the optimized number of clusters without pre-defined knowledge by applying the fuzzy c-means clustering algorithm is the fuzzy partition coefficient (FPC). This is defined (Trauwaert Citation1988) as:
(17)
(17)
where W is the fuzzy membership matrix. The definition determines the upper and lower boundaries of the coefficient as
The higher the FPC, the more cleanly the data is described by the clustering model.
3.4.3. Distribution Clustering
3.4.3.1. Clustering algorithm
The Gaussian Mixture Model (GMM) allocates each observation in the dataset to the distributions that are most likely to be the same. With a set of observations, and a weighted sum of m clusters. The Gaussian mixture density is defined as (Hedelin and Skoglund Citation2000)
(18)
(18)
where wi is the weight of each observation and the observation densities are
(19)
(19)
Here, represents mean vectors and Σi represents the covariance matrices. The purpose of the GMM clustering is to obtain the parameters of clustered Gaussian distribution parameters:
(20)
(20)
In order to obtain the optimized values for the parameters in the GMM, the purpose is to the maximize the log-likelihood function given N independent samples from the identically distributed samples of x observations (Hedelin and Skoglund Citation2000).
(21)
(21)
where the expectation-maximization (EM) algorithm (Hedelin and Skoglund Citation2000; Dempster, Laird, and Rubin Citation1977; Yang, Lai, and Lin Citation2012) is applied. The EM algorithm can be described as two iteration steps:
Step 1 – Expectation step: Initiate the centroids of the Gaussian distribution, calculate the log-likelihood function value under the current set of Gaussian distribution parameters at the rth iteration (Hedelin and Skoglund Citation2000)
Step 2 – Maximization step: Obtain the parameter set that enables the maximum value of the following definition (Yang, Lai, and Lin Citation2012):
3.4.3.2. Determination of cluster number
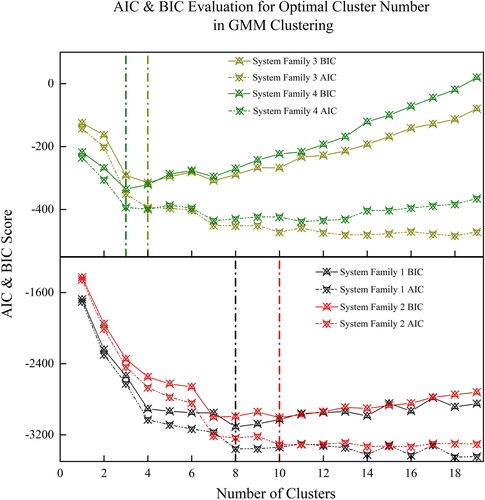
The components of the clustering are determined by both the Bayesian Information Criterion (BIC) and the Akaike Information Criterion (AIC). This step is to determine the most reasonable number of clusters within the pre-set limit of number of clusters that best describe the pattern of the dataset. This is to avoid overfitting of the model, so that the model is applicable for prediction.
(24)
(24)
Here, is the maximized value of the likelihood function of the GMM model where
M is the number of clusters in the GMM model and
is are the parameter values that maximize the likelihood function. The minimum value of the BIC and the AIC determines the component number within the GMM model that describes the data set best and also provides the best fit of the model for prediction purposes. After the loop, the minimum values of the BIC and AIC are determined, and thus the best model of the GMM is determined. This is then applied to the processed dataset to form the clusters.
3.4.4. Fuzzy logic cluster number updating
However, a shortfall exists with the conventional cluster number determination method—the initial cluster number determination reflected the challenges in the current general clustering algorithm approaches: without pre-defined knowledge and especially when the dataset contains high-complexity information, the conventional clustering number determination can be ineffective (de Amorim and Hennig Citation2015). The optimal number of clusters is at the same time dependent on the background of the problem and has to be determined on a case-by-case basis. To resolve the ineffectiveness of the conventional determination methods, a technique is provided in this research for clustering (particularly for the data collected from the aviation industry). It starts by evaluating the sum of intracluster distances for which the minimum value of intracluster distances determines the most optimal number of clusters for each of the clustering methods mentioned above. This concept intends to combine similar clusters by evaluating the characteristic similarities of the clusters, for example, by the mean and standard deviations. If it is determined that two or more clusters have the similar characteristics, then the centroids are grouped together to form the new cluster (Lai et al. Citation2017). By introducing an unweighted fuzzy logic decision making approach (Agrawal, Panigrahi, and Tiwari Citation2008), the number of clusters for each clustering algorithm is further updated. The fuzzy logic membership function is defined as follows (Agrawal, Panigrahi, and Tiwari Citation2008):
(25)
(25)
Here, μi is the fuzzy logic membership value of the ith objective function In this study, as the purpose is to make a decision based on the balancing of simple model with minimum number of clusters as well as maintaining the low value in square intracluster distances, the number of objective functions is 2. The number of clusters is set to be within 14 clusters from the initial cluster number determination section, which leads to the number of nondominated solutions to be 14. Hence, the normalized membership function for each nondominated solution is written as (Agrawal, Panigrahi, and Tiwari Citation2008)
(26)
(26)
4. Case study
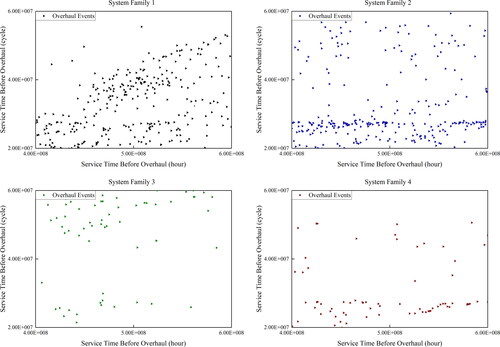
The data for evaluating the civil aviation system performance profile are collected from the global overhaul network locations. The aviation systems being studied are labeled as system families. These systems serve the same purpose but with different models being designed and manufactured, providing the various ranges of flights in the civil aviation industry. The dataset collected contains the following information for each individual system, following the European Union Aviation Safety Agency (EASA) guidance: the model and identification code of each individual system, the total safe service time before an overhaul measured in hours, and the total safe service time before an overhaul measured in cycles. Due to the differences in design and service purpose of these systems, within each system family, the overhaul records are markedly different. For observation purposes, a sample of overhaul records data collected is provided for 4 different systems within the same hour and cycle time frame shown in . For Systems 1, 2, 3 and 4, the collected dataset contains 1429, 1277, 236, and 222 overhaul records independently. It is worth noticing that although the data being collected are real-life data, they are factorized up for confidential reasons.
Figure 2. Comparison of overhaul data collected from 4 families of systems.
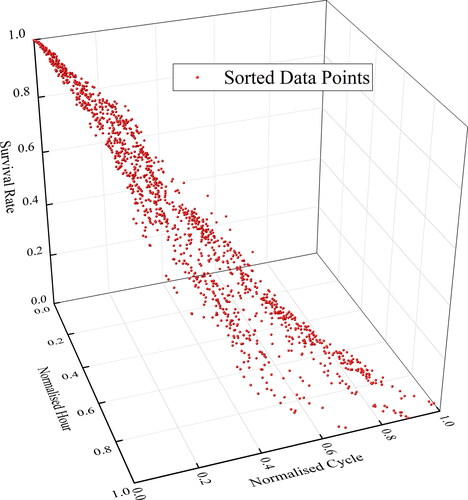
The data processing at this stage creates a 3-dimentional dataset with fleet performance profile measurement as well as the population survival analysis result. This leads to the “Waterfall Model” shown in for System Family 1.
Figure 3. Sorted overhaul performance profile with survival analysis for System Family 1.
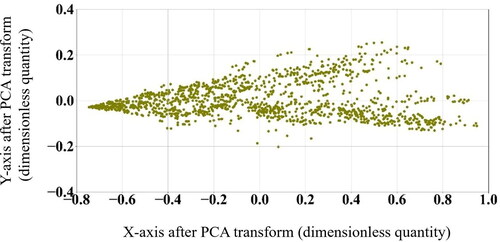
Performing the PCA transform on the PPI calculation results shown in , the result is shown in for System Family 1.
Figure 4. Performance profile with survival analysis for System Family 1 after PCA transformation.
The cluster analysis is done on 4 fleets of aviation systems for feasibility studies and for the purpose of comparison in order to determine the most reasonable clustering algorithm. Therefore determine the most optimized clusters for industrial applications.
4.1. Numerical initial cluster number determination
4.1.1. K-Means cluster number
In order to obtain the most reasonable number of clusters, as stated in Section 3, both the “elbow” method and the silhouette statistic index are applied. The “elbow” estimation result on WSS is shown in . And the silhouette statistic index provides the results shown in . The dashed grey lines in and marks the potential cluster numbers determined by the ’Elbow’ method and the Silhouette Statistic Index method. The numbers are determined at the cutoff point along the plot, where the increasing cluster numbers do not significantly improve the performance evaluation by percentage. This is on the purpose to balance the returns and the additional cost of mathematical modeling (Ketchen and Shook Citation1996).
Figure 5. “Elbow” method for optimal K number of clusters.
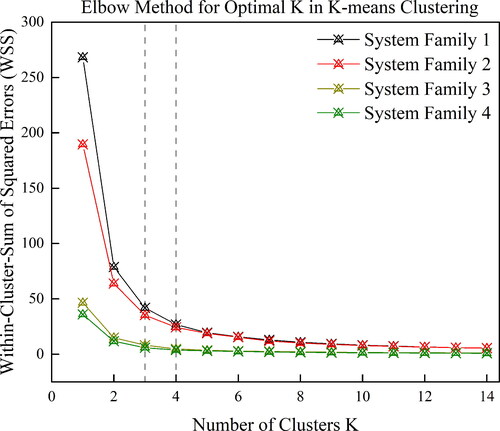
Figure 6. Silhouette statistic index method for optimal K number of clusters.
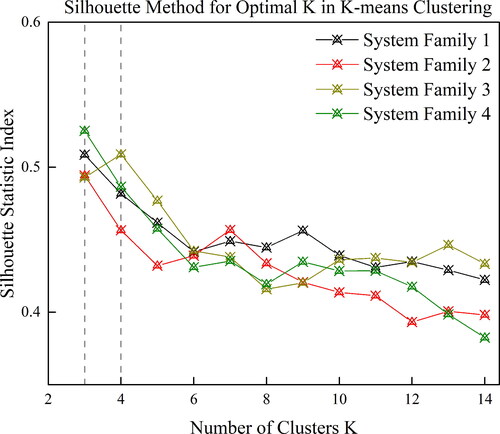
The numerical approach here is that for a fleet of aviation systems, it is generally not reasonable to cluster the overhaul records into 1 group or simply 2 groups. From both the “Elbow” method and Silhouette Statistic Index method, the hard-clustering K-means algorithm does not tend to complicate the number of clusters and the cluster model. For System Families 1, 2, and 4, the optimal value K is 3, while for System Family 3, the optimal value K can be considered as 3 or 4.
4.1.2. Fuzzy C-means cluster number
The initial determination of cluster number by the fuzzy C-means clustering algorithm applies the FPC as stated in Section 3. The higher value of the FPC means a clean description of the cluster number, as shown in . From the conventional calculation of the FPC, where by the data-driven method of fuzzy clustering, the most reasonable number of clusters is determined when the FPC value is at the maximum. This determination of cluster number is marked in by grey dashed line. It can be observed that the algorithm tends to choose the smallest number of cluster possible—for all the System Families this tends to be 3 clusters. Confirming that for the distance measuring based clustering methods, K-means and its extension of fuzzy C-means clustering both tend to simplify the cluster numbers within the mathematical models.
Figure 7. FPC determination of the optimal cluster number by the fuzzy C-means algorithm.
4.1.3. Distribution Cluster number
The values of BIC and AIC are applied to initially determine the number of clusters on the distribution-based clustering method. The properties of the BIC and AIC value determines that the extreme minimum value of both values provides a foundation for the most reasonable number of clusters, to best describe the current dataset as well as keeping the model away from overfitting so that the results can be applied to other cases.
The optimal values of cluster number for the 4 System Families are shown in . Compared to the distance measuring based model, the distribution-based clustering method is sensitive to the amount of data observations within the dataset. At the same time, due to the data properties for the aviation system observations, the AIC values for four systems are monotonically decreasing, which leads to no determinisation of the most optimal cluster number by the AIC evaluation. The BIC evaluation, however, provides the initial clustering numbers of 8, 10, 3, 4 to the 4 System Families respectively. Here, in , the green dashed line is drawn to show the number of clusters for System Family 4, the brown dashed line shows the number of clusters for System Family 3, the black dashed line shows the number of clusters for System Family 1, and the red dashed line shows the number of clusters for System Family 2.
Figure 8. AIC & BIC method for GMM cluster number determination.
4.2. Fuzzy logic decision on cluster number updating
By definition, the optimal number of clusters refers to the minimum normalized fuzzy membership value (Agrawal, Panigrahi, and Tiwari Citation2008). The squared intracluster distances for the four system families based on three mentioned clustering algorithms are shown in . The associated normalized fuzzy membership values are shown in .
Figure 9. Squared intracluster distance for four system families.
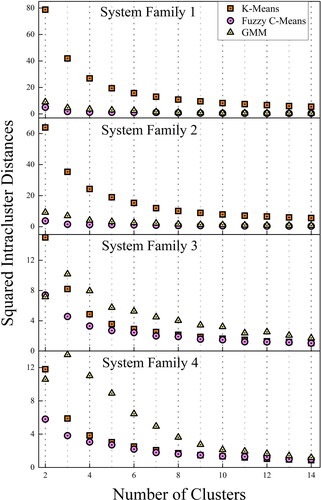
Figure 10. Normalized fuzzy membership values for four system families.
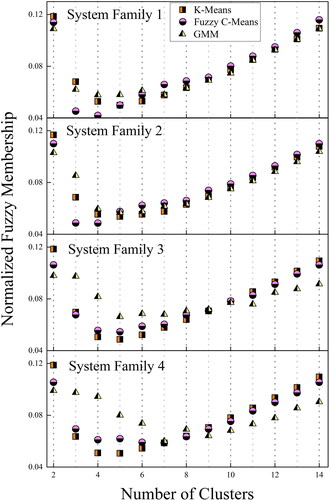
It can be observed that the intracluster distances follows the same trend for all three clustering methods—the more cluster there are, the less the combined intracluster distances are. Based on the calculated normalized fuzzy membership values shown in , the cluster number is given a ‘±1’ confidence interval, as shown in .
Table 1. Summarized optimal cluster number.
The fuzzy logic decision solved two difficulties the conventional determination methods face. First, the cluster performances tend to unify with different clustering method: even though the approaches are fundamentally different, they all reach a certain agreement of the most optimal cluster for a data being collected from each aviation system family. Second, the distribution based clustering algorithm, the GMM, by the conventional method, is sensitive with the size of the dataset. With the fuzzy logic technique, the GMM clustering provides a stable performance, which allows a stable decision making in industry by applying the GMM in system performance profile index clustering. Among the three clustering approaches, the distribution-based clustering is particularly suitable for partitioning the evaluations of aviation system performance. It provides the information that each data point has a hierarchy of probabilities to be contained in a number of clusters. This property of the GMM clustering approach is particularly an advantage considering the complexity of the aviation system, that when an overhaul is carried out, even though it is majorly due to one diagnosed symptom of the system, the potential failure mechanisms causing the diagnosed symptom varies. The information concluded by GMM clustering is important in the further determination of maintenance policies and the supply-chain batch procurement of spare parts. The GMM clustering method for four system families is shown in .
Figure 11. GMM clustering on four system families with the optimal number of determined clusters.
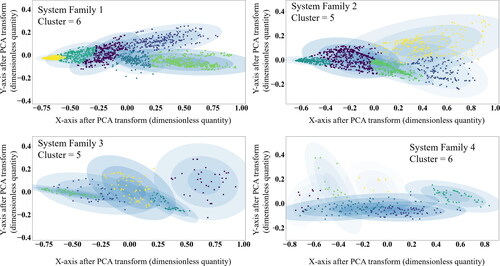
In , each multiderivative Gaussian distribution is plotted in ellipse with first, second and third standard deviation area in light blue color. The data points in each clustered are obtained with their original data label, in order to allocate each individual aviation system into its associated PPI cluster.
4.3. Validation & maintenance priority recommendations
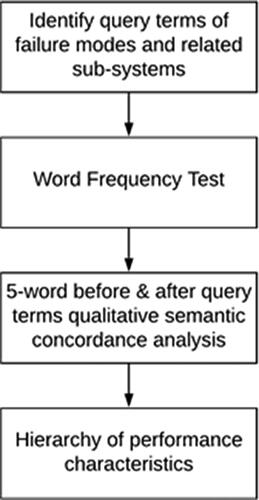
In order to validate the clustering results proposed in Section 5. It is important to identify the actual obvious characteristics within each determined cluster. Within the collected datasets, we are able to achieve maintenance logbooks information, the primary diagnostic symptoms and the root causes of each overhaul event being collected for these systems. However, these are all described in human language, without obvious formats or language structures. In order to identify the key performance characteristics, the step of concordance analysis, essentially a qualitative semantic analysis, on logbook natural language processing is performed (Anthony Citation2019). Analyzing words and their patterns in context through a concordance—a tabular display with the search word in the middle—is a basic method of corpus linguistics; for example, see Wiegand (Citation2019). The approach being taken here follows the flowchart in .
Figure 12. Qualitative semantic analysis on overhaul records in natural language.
The results for the system family 1 are presented in this article as an evidence to support the clustering results. There are in total 10 key sub-systems being identified as top priority overhaul root causes within the entire collected dataset. The sub-systems associated with Sub 1 to Sub 10 are provided in Appendix A. In , the primary root causes that determine the characteristics of each cluster as well as the additional minor causes within each cluster are shown in both pie charts and frequency diagram side by side for each cluster. It can be observed from that each of the clusters has one primary root cause of the overhaul reason. This leads to the identification of the primary characteristics for each specified cluster.
Figure 13. Primary root cause and additional cause of overhaul reasons within each cluster.
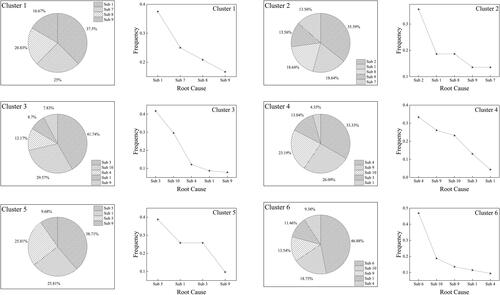
Furthermore, it is obvious that within each identified cluster, apart from the primary root causes for overhauls, there are a few more non-primary root causes exist. This further proves the choice of distribution-based clustering algorithm is reasonable for high complexity aviation systems.
At any period, the primary cause of the overhaul determines the cluster each member of the fleet belongs to, while there are still possibilities that other symptoms exist that contributes to the primary causes. This is because within a complex system, the failure mechanisms are largely connected, and the primary cause by observation is a combination of probability of failure by the cooperation of multiple sub-systems.
The qualitative semantic concordance analysis results presented in also proves the clustering method proposed in this article is highly valid and reasonable. Each of the cluster is led by one primary root cause, which clearly identified the similarities of each member within one cluster.
5. An example of industrial application
The clustering results are a comprehensive input for organizations managing the fleet of aviation assets. One application rationale the clustering results provide is the estimation of overhaul time schedules and the targeted sub-systems on which the maintenance is most likely to be carried out. The targeted sub-systems at the same time, also determines the demands of spare parts related to each overhaul event. Shown in is a description of such rationale.
Figure 14. Cluster results for estimation of overhaul time schedule and spare parts arrival deadlines.
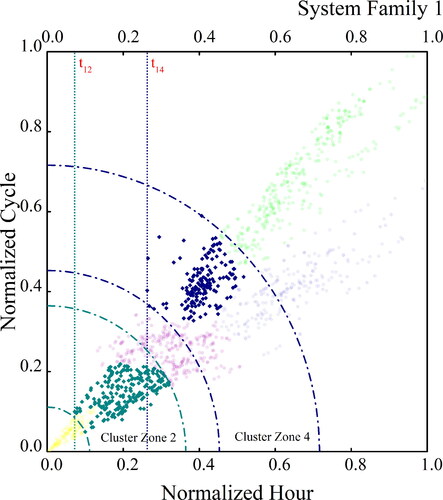
In , results of System Family 1 are provided as an example. Based on the clustering results, six cluster zones are obtained, cluster zone 2 and cluster zone 4 are plotted in . Here, in , t12 is the projection of the first fleet shop visit overhaul data point within Cluster 2 on the X-axis, which is the Normalized Hour, as the green dashed line has shown its projection value on X-axis as t12. And t14 is the projection of the first fleet shop visit overhaul data point within Cluster 4 on the X-axis, as the blue dashed line has shown its projection value on X-axis as t14. With the boundaries determined by the data points closest and furthest from the original point. Assume one system model mu is classified into cluster 2, and since the last overhaul toward mu, following its operational pattern, it has consumed hu hours and cu cycles of its asset life. The system provider, based on the knowledge of clustering results, shall decide that at time the spare parts for overhaul service toward mu shall be ready at the overhaul facility. The recommended spare parts to be ordered in advance considering the lead time should focus on the sub-systems of: Sub 2, Sub 1, Sub 8, Sub 9 and Sub 7, as priorities.
The advantage of determining maintenance schedules with clustering results is that it significantly shortened the range of “carry-on” time of spare parts storage with uncertainties. The results also provided targeted failure modes on a smaller selection of “high failure-potential” sub-systems, which significantly increased the efficiency on identification of high demand parts at a sub-system level related to the performance profile of each individual civil aviation system.
6. Conclusion and future work
In this article, we proposed a novel framework to combine the dual-time-scale measurements for aviation systems, for a joint evaluation of the systems’ performances. This significantly extended the comprehensiveness of asset management in the aviation industry, which enables a more close-to-reality consideration when planning maintenance activities and ordering spare parts for maintenance activities.
We also enabled the possibility of evaluating the systems with minimum requirement of data collection. The advantage of the simplicity in data assembling for organizations is highly valuable. The reliability of simpler dataset, as well as the exploitability of the results developed from these datasets, enables high applicability of this framework for industrial end users.
The clustering results are, furthermore, a highly valuable insight for organizations in the aviation industry. The similarities in performance characteristics enable multiple further developments which the authors will consider in future work. These include the spare parts demand predictions based on cluster results, the optimization of vendor selection in a geographical zone, etc.
One defect in the current research is the identification of specific spare parts, for those which appear to be the most vulnerable in each of the clustered performance characteristics. The current identification is on a sub-system level. To enable the realization of spare parts demand prediction, especially to reach an accuracy that is applicable in the industry, it is important to gather sufficient data at a component level. The further data collection and the prediction algorithm will also be further carried out by the authors.
Acknowledgment
The first author would like to thank Dr. Viola Wiegand for recommending the corpus linguistic approach of concordance analysis to identify patterns in the natural language overhaul records. The first author would also like to thank St Edmund’s College, University of Cambridge, for the fellowship, which provided support throughout the work of this research.
Additional information
Funding
Notes on contributors
Hang Zhou
Hang Zhou holds a PhD degree in Mathematical Modelling and Mechanics of Materials. He is currently a Lecturer in Electrically Powered Aircraft and Operations, at the James Watt School of Engineering, University of Glasgow. His research interests include safety, quality & reliability engineering, industrial recommender system, engineering asset management, and electric propulsion. He teaches aircraft propulsion systems, aircraft structural analysis & design, and glider design. His research has close ties with the industries, from the sectors of aerospace, transportation, energy, and infrastructure.
Ajith Kumar Parlikad
Ajith Kumar Parlikad is Professor in Asset Management at Cambridge University Engineering Department. He is based at the Institute for Manufacturing, where he is the Head of the Asset Management research group. He is a Fellow and Tutor at Hughes Hall. Ajith joined Cambridge University to read for his PhD degree, which he successfully completed in August 2006. Ajith’s current research focusses on the development and exploitation of digital twins of complex asset systems bringing together data from disparate sources to improve asset management.
Alexandra Brintrup
Alexandra Brintrup received the Ph.D. degree from Cranfield University, Cranfield, U.K. She is currently a Lecturer in digital manufacturing with the University of Cambridge, Cambridge, U.K. She develops intelligent systems to help organizations navigate through complexity. Her main work in this area includes system development for digitized product lifecycle management. She uses artificial intelligence paradigms, particularly for data analytics and automated decision making. She has a postdoctoral and a fellowship appointment with the University of Cambridge and the University of Oxford. She teaches operations management and decision engineering. Her research interests include modelling, analysis, and control of dynamical and functional properties of emergent manufacturing networks.
References
- Accorsi, R., M. Bortolini, M. Gamberi, R. Manzini, and F. Pilati. 2017. Multi-objective warehouse building design to optimize the cycle time, total cost, and carbon footprint. The International Journal of Advanced Manufacturing Technology 92 (1–4):839–54. doi:10.1007/s00170-017-0157-9.
- Agrawal, S., B. K. Panigrahi, and M. K. Tiwari. 2008. Multiobjective particle swarm algorithm with fuzzy clustering for electrical power dispatch. IEEE Transactions on Evolutionary Computation 12 (5):529–41. doi:10.1109/TEVC.2007.913121.
- Anthony, L. 2019. Antconc (version 3.5.8), Computer Program.
- Burke, E. K., P. De Causmaecker, G. De Maere, J. Mulder, M. Paelinck, and G. Vanden Berghe. 2010. A multi-objective approach for robust airline scheduling. Computers Operations Research 37 (5):822–32. doi:10.1016/j.cor.2009.03.026.
- Cacchiani, V. and J.-J. Salazar-González. 2017. Optimal solutions to a real-world integrated airline scheduling problem. Transportation Science 51 (1):250–68. doi:10.1287/trsc.2015.0655.
- da Silva, S., M. Dias Júnior, V. L. Junior, and M. J. Brennan. 2008. Structural damage detection by fuzzy clustering. Mechanical Systems and Signal Processing 22 (7):1636–49. doi:10.1016/j.ymssp.2008.01.004.
- de Amorim, R. C., and C. Hennig. 2015. Recovering the number of clusters in data sets with noise features using feature rescaling factors. Information Sciences 324:126–45. doi:10.1016/j.ins.2015.06.039.
- Dempster, A. P., N. M. Laird, and D. B. Rubin. 1977. Maximum likelihood from incomplete data via the EM algorithm. Journal of the Royal Statistical Society. Series B (Methodological) 39 (1):1–22. doi:10.1111/j.2517-6161.1977.tb01600.x.
- Fava, G. A., J. Guidi, P. Porcelli, C. Rafanelli, A. Bellomo, S. Grandi, L. Grassi, L. Mangelli, P. Pasquini, A. Picardi, et al. 2012. A cluster analysis-derived classification of psychological distress and illness behavior in the medically ill. Psychological Medicine 42 (2):401–7. doi:10.1017/S0033291711001231.
- Feng, Q., X. Bi, X. Zhao, Y. Chen, and B. Sun. 2017. Heuristic hybrid game approach for fleet condition-based maintenance planning. Reliability Engineering System Safety 157:166–76. doi:10.1016/j.ress.2016.09.005.
- Green, R., I. Staffell, and N. Vasilakos. 2014. Divide and conquer? k-means clustering of demand data allows rapid and accurate simulations of the British electricity system. IEEE Transactions on Engineering Management 61 (2):251–60. doi:10.1109/TEM.2013.2284386.
- Hedelin, P., and J. Skoglund. 2000. Vector quantization based on Gaussian mixture models. IEEE Transactions on Speech and Audio Processing 8 (4):385–401. doi:10.1109/89.848220.
- Horenbeek, A. V., P. A. Scarf, C. A. V. Cavalcante, and L. Pintelon. 2013. The effect of maintenance quality on spare parts inventory for a fleet of assets. IEEE Transactions on Reliability 62 (3):596–607. doi:10.1109/TR.2013.2270409.
- Kaplan, E. L., and P. Meier. 1958. Nonparametric estimation from incomplete observations. Journal of the American Statistical Association 53 (282):457–81. doi:10.1080/01621459.1958.10501452.
- Kassner, M. E., and M. T. Pérez-Prado. 2000. Five-power-law creep in single phase metals and alloys. Progress in Materials Science 45 (1):1–102. doi:10.1016/S0079-6425(99)00006-7.
- Ketchen, D. J., and C. L. Shook. 1996. The application of cluster analysis in strategic management research: An analysis and critique. Strategic Management Journal 17 (6):441–58. doi:10.1002/(SICI).1097-0266(199606)17:6 < 441::AID-SMJ819 > 3.0.CO;2-G.
- Lai, C. S., Y. Jia, M. D. McCulloch, and Z. Xu. 2017. Daily clearness index profiles cluster analysis for photovoltaic system. IEEE Transactions on Industrial Informatics 13 (5):2322–32. doi:10.1109/TII.2017.2683519.
- Liao, T. W. 2005. Clustering of time series data—A survey. Pattern Recognition 38 (11):1857–74. doi:10.1016/j.patcog.2005.01.025.
- Lu, D. and E. Schnieder. 2014. Performance evaluation of GNSS for train localization. IEEE Transactions on Intelligent Transportation Systems 16 (2):1–6. doi:10.1109/TITS.2014.2349353.
- Nair, R. and E. Miller-Hooks. 2011. Fleet management for vehicle sharing operations. Transportation Science 45 (4):524–40. doi:10.1287/trsc.1100.0347.
- Papadakos, N. 2009. Integrated airline scheduling. Computers Operations Research 36 (1):176–95. doi:10.1016/j.cor.2007.08.002.
- Schütz, W. 1996. A history of fatigue. Engineering Fracture Mechanics 54 (2):263–300. doi:10.1016/0013-7944(95)00178-6.
- Sheng, J., and D. Prescott. 2016. Optimising spare parts provision and inspection intervals for an aircraft fleet undergoing cannibalisation. Safety and Reliability 36 (2):88–105. doi:10.1080/09617353.2016.1219935.
- Sohn, H., S. D. Kim, and K. Harries. 2008. Reference-free damage classification based on cluster analysis. Computer-Aided Civil and Infrastructure Engineering 23 (5):324–38. doi:10.1111/j.1467-8667.2008.00541.x.
- Sohoni, M., Y.-C. Lee, and D. Klabjan. 2011. Robust airline scheduling under block-time uncertainty. Transportation Science 45 (4):451–64. doi:10.1287/trsc.1100.0361.
- Soler, Z. M., J. M. Hyer, L. Rudmik, V. Ramakrishnan, T. L. Smith, and R. J. Schlosser. 2016. Cluster analysis and prediction of treatment outcomes for chronic rhinosinusitis. The Journal of Allergy and Clinical Immunology 137 (4):1054–62. doi:10.1016/j.jaci.2015.11.019.
- Tola, V., F. Lillo, M. Gallegati, and R. N. Mantegna. 2008. Cluster analysis for portfolio optimization. Journal of Economic Dynamics and Control 32 (1):235–58. doi:10.1016/j.jedc.2007.01.034.
- Trauwaert, E. 1988. On the meaning of Dunn’s partition coefficient for fuzzy clusters. Fuzzy Sets and Systems 25 (2):217–42. doi:10.1016/0165-0114(88)90189-3.
- Vujanović, D., V. Momčilović, N. Bojović, and V. Papić. 2012. Evaluation of vehicle fleet maintenance management indicators by application of DEMATEL and ANP. Expert Systems with Applications 39 (12):10552–63. doi:10.1016/j.eswa.2012.02.159.
- Wendt, C. 2009. Mapping European healthcare systems: A comparative analysis of financing, service provision and access to healthcare. Journal of European Social Policy 19 (5):432–45. doi:10.1177/0958928709344247.
- Wiegand, V. 2019. A Corpus Linguistic Approach to Meaning-Making Patterns in Surveillance Discourse, 200–2. PhD dissertation, University of Birmingham, Birmingham. Available at https://etheses.bham.ac.uk//id/eprint/9778/.
- Xu, R., J. Xu, and D. C. Wunsch. 2012. A comparison study of validity indices on swarm-intelligence-based clustering. IEEE Transactions on Systems, Man, and Cybernetics. Part B, Cybernetics : a Publication of the IEEE Systems, Man, and Cybernetics Society 42 (4):1243–56. doi:10.1109/TSMCB.2012.2188509.
- Yang, M.-S., C.-Y. Lai, and C.-Y. Lin. 2012. A robust EM clustering algorithm for Gaussian mixture models. Pattern Recognition 45 (11):3950–61. doi:10.1016/j.patcog.2012.04.031.
- Yedavalli, R. K. and R. K. Belapurkar. 2011. Application of wireless sensor networks to aircraft control and health management systems. Journal of Control Theory and Applications 9 (1):28–33. doi:10.1007/s11768-011-0242-9.
- Yongquan, S., C. Xi, R. He, J. Yingchao, and L. Quanwu. 2016. Ordering decision-making methods on spare parts for a new aircraft fleet based on a two-sample prediction. Reliability Engineering System Safety 156:40–50. doi:10.1016/j.ress.2016.07.017.
- Zhou, H., A. Brintrup, and A. K. Parlikad. 2021. Module failure feature detection by cluster analysis for fleets of civil aircraft engines. IFAC-PapersOnLine 54 (1):31–6. doi:10.1016/j.ifacol.2021.08.154.
- Zhou, H., F. Li, M. Le Blanc, and J. Pan. 2022. A Bayesian inference reliability evaluation on the corrosion-affected underground high-voltage power grid. International Journal of Reliability, Quality and Safety Engineering 29 (1):2150042. doi:10.1142/S021853932150042X.
- Zhou, H., J. McGinty, and A. K. Parlikad. 2020. Failure prediction of auxiliary lube oil pump in gas turbines: Applying Monte Carlo neural networks to an unbalanced dataset**this research is supported by siemens industrial turbomachinery ltd. IFAC-PapersOnLine 53 (3):131–6. doi:10.1016/j.ifacol.2020.11.021.
- Zhou, H., M. Farsi, A. Harrison, A. K. Parlikad, and A. Brintrup. Forthcoming. Civil aircraft engine operation life resilient monitoring via usage trajectory mapping on the reliability contour. Reliability Engineering System Safety 230:108878. doi:10.1016/j.ress.2022.108878.
- Zhou, H., S. Gnanasambandam, M. Foresta, D. Weston, F. Li, J. Pan, and M. Le Blanc. 2017. Measurement and modeling of pitting depth distribution for phosphor bronze tapes used in underground power transmission cables. Corrosion 73 (7):844–52. doi:10.5006/2227.
- Zhou, H., S. Gnanasambandam, M. Foresta, F. Li, M. L. Blanc, D. Weston, and J. Pan. 2018. Life prediction of phosphor bronze reinforcing tape used in underground power cables. Corrosion 74 (5):530–42. doi:10.5006/2627.
- Zhou, H., T. A. Lopes Genez, A. Brintrup, and A. K. Parlikad. 2022. A hybrid-learning decomposition algorithm for competing risk identification within fleets of complex engineering systems. Reliability Engineering System Safety 217:107992. https://www.sciencedirect.com/science/article/pii/S0951832021005020. doi:10.1016/j.ress.2021.107992.