
Abstract
Breeding of turf bermudagrass (Cynodon (L.) Rich.) has made available a broad range of turf varieties with unique morphological and growth traits. Rapid establishment is necessary in order to provide the performance of a mature turf cover in the shortest time possible. The aims of the research were: (1) to determine variation of growth, morphological and biomass traits in bermudagrass accessions belonging to different phenotypic groups during establishment and (2) to relate such variations to establishment speed in order to assess whether contrasting phenotypic traits could induce different establishment patterns in bermudagrass or if a general establishment predictor can be identified for cultivars and ecotypes belonging to the same taxon. Plant material included 44 accessions of bermudagrasses that were grouped in ‘Wild’, ‘Improved’ ‘Hybrid’ and ‘Dwarf types’. Single spaced plants were transplanted in field plots in two locations in Italy (Pisa and Palermo) and allowed to establish without mowing. The following traits were determined: stolon growth rate, internode length, internode diameter and internode volume, phytomer dry weight, leaf width, colour, seed head production, above ground dry biomass, shoot density, horizontal stem density and node density. Establishment speed of accessions was also determined. Stolon growth rate was found to be the only parameter strongly correlated to establishment speed across all entries and for each of the phenotypic groups. Based on these results, stolon growth rate could be assumed as a good predictor of establishment speed for cultivars and ecotypes belonging to the Cynodon genus.
Introduction
Bermudagrass is known to have many desirable characteristics as turf species. It is vigorous, dense, deep rooted and competitive against weeds. Bermudagrass is well adapted to a wide range of soil types and tolerates wear, drought and salinity stress; diseases only pose few problems (McCarty & Miller Citation2002). Due to these characteristics, bermudagrass is the most widespread turfgrass in warm to temperate regions of the globe (Anderson et al. Citation1993; Taliaferro Citation2003).
Bermudagrass includes several taxa of the genus Cynodon (L.) Rich., but the two species that represent the genetic pool from which most present cultivars descend are Cynodon dactylon (L.) Pers. Var. dactylon and Cynodon transvaalensis (Burtt-Davy), also known as African bermudagrass (Taliaferro Citation2003).
Bermudagrasses used as turf in the early 1900s belonged to the C. dactylon species and were probably similar to the wild types with little breeding work done to improve the turf performance (Taliaferro Citation2003).
At a later stage, the species has undergone a genetic improvement that has led to the creation of a group of denser, finer and darker varieties referred to as ‘improved common’ types (Baltensperger et al. Citation1993). These varieties can be both seed or vegetative propagated regardless their ability to produce viable seeds (Nickson Citation2009; De Brujin Citation2012).
As mentioned above, African bermudagrass is used as turfgrass as well, but its major contribution to the turf industry is probably due to the interspecific hybridization with C. dactylon that has led to the selection of numerous vegetatively propagated hybrid varieties that are currently considered reference standards for fine turf applications (Taliaferro Citation2003).
Among hybrid genotypes, a number of cultivars have been selected for plant size and morphology in response to the lower cutting height adopted on golf greens. Subsequently, among hybrid genotypes, a number of cultivars named ‘dwarf’ and ‘ultradwarf’ have been selected for plant size and morphology in response to low cutting height adopted on golf greens (Beard & Sifers Citation1996).
Whatever the cultivar or type selected for a given use, the ability of plants to spread laterally is a key growth characteristic given that both vegetative and seed propagated bermudagrass varieties rely on horizontal growth for full establishment and recovery from damages.
In the past, different approaches have been adopted to quantify the rate at which a given turfgrass grows horizontally in order to define the speed at which it establishes.
In a study carried out by Roche and Loch (Citation2005) on ultradwarf bermudagrasses, lateral spread was found to be strongly associated to stolon internode length; however, under a different temperature regime, some of the cultivars did not confirm this association of parameters.
Traditionally, ground cover is visually assessed and the increase of ground cover over time, ground cover reached at a given date or, conversely, the number of days or weeks needed to reach a fixed threshold value are generally the methods adopted to describe or compare the establishment rate of turfgrasses (Richardson & Boyd Citation2001; Stiglbauer et al. Citation2009; Severmutlu et al. Citation2011).
In a study of Wu et al. (Citation2007), the 10 longest stolons per plot and visually estimated ground coverage at the end of the growing season were used as establishment rate descriptors. However, the measurements of stolon length alone can be affected by temporary changes in environmental growth conditions (Volterrani, Magni et al. Citation2012). Richardson et al. (Citation2001) reported a new method for determining turfgrass cover using digital image analysis. The method proved to be closely related to visually assessed data but inherently more accurate and unaffected by the evaluator bias. The same method was adopted by Patton et al. (Citation2007) in comparing 35 accessions of zoysiagrass in a field trial. Although green cover data recorded by digital image analysis provide information similar to that of visual assessments, data collected on zoysiagrasses were transformed and fitted to a linear model in order to convert a pool of data representing the rate of green area expansion in a simple numeric form, a coefficient called ‘establishment rate’, that can be easily correlated with morphological traits. In the same research, the relationships existing between establishment rate and morphological and growth traits were also studied. Results showed that quick establishment was associated in general with genotypes capable of producing long stolons with high growth rates. Leaf width across species was also positively correlated with establishment rate but the correlation was not significant at interspecific level, thus suggesting that leaf width was not involved in determining establishment rate.
Further observations on the increase of ground cover and stolon growth during establishment are reported by Volterrani et al. (Citation2008) in which measurements were carried out on different species. A strong relation was evident between rapid increase of ground cover and parameters describing stolon activity such as stolon weekly growth rate, stolon number per plant and total stolon length per unit area. On the contrary, internode length was not associated with the cover expansion during establishment.
Comparable conclusions can be found in Pompeiano et al. (Citation2012) that report of a trial in which establishment rate and stolon growth characteristics were studied on 10 zoysiagrass genotypes. When genotypes were grouped in ‘Japanese types’ and ‘fine leaved types’ the highest percentage green turf cover reached by the fast growing group of the Japanese types was associated with the highest value of total stolon length and stolon growth rate. Similarly, in a study on bermudagrass varieties by Volterrani, Pompeiano et al. (Citation2012), green turf cover was found to be associated with stolon number and total stolon length per plant whilst no association was reported with stolon growth rate.
In consideration of the wide genetic and phenotypic variability that, at present, can be found among bermudagrasses used for turf, the objectives of this research were: (1) to determine the variation of a number of growth, morphological and biomass traits in bermudagrass accessions belonging to different phenotypic groups and (2) to relate such variations to the establishment speed in order to assess whether contrasting phenotypic traits could explain different establishment patterns in bermudagrass or if a general establishment predictor can be identified for cultivars and ecotypes belonging to the same taxon.
Materials and methods
Plant material
With the aim of widening, the genetic pool and the morphological diversity of plant material in this research were included 44 accessions of bermudagrass (Cynodon (L.) Rich.) representative of naturally occurring populations and cultivated varieties derived from different methods of genetic improvement.
Group 1 included 13 entries that were called ‘Wild types’ and were naturally occurring populations of C. dactylon (L.) Pers. collected from contrasting environments, some of which were supposed to generate a selective pressure on native bermudagrass populations. Collection sites were located in Italy (CeRTES-1 = warm temperate, salt affected soil; CeRTES-2 = warm temperate, fertile soil; CeRTES-3 = warm temperate, polluted soil; CeRTES-13 = warm temperate, fertile soil), France (CeRTES-4 = cool humid, fertile soil), Greece (CeRTES-5, -6 and -7 = warm temperate, salt affected soils), Croatia (CeRTES-8 = warm temperate, salt affected soil), Argentina (CeRTES-9 warm temperate, salt affected pastureland), United Arab Emirates (CeRTES-10 and -11 = warm arid, desert sand) and Maldives (CeRTES-12 = tropical humid, salt affected soil).
Group 2 included 13 entries that were called ‘Improved types’. These were experimental or commercial vegetative and seeded improved C. dactylon cultivars.
Group 3 included 11 entries called ‘Hybrid types’ represented by commercial or experimental interspecific hybrids (C. dactylon × transvaalensis Burtt.-Davy) of which those labelled Tif- were kindly provided by Dr W. Hanna (University of Georgia, USA).
Group 4 included 7 entries called ‘Dwarf types’ represented by both commercial interspecific dwarf and ultradwarf hybrid cultivars and two C. transvaalensis Burtt.-Davy accessions, one being a commercial cultivar (Uganda) and the other (Roma) being a line of African bermudagrass that was collected in a turf nursery in Rome (Italy), where the species was first introduced presumably as a weed of other vegetatively propagated bermudagrasses. African bermudagrasses were included in the ‘dwarf types’ due to their similarity in leaf texture, density and growth habit with the well-known hybrid dwarf bermudagrasses.
Field management
On 15 April 2010 at the University of Pisa, Italy, the accessions were propagated in the greenhouse (24 ± 5°C) in peat-filled honeycomb seed trays with cells of 7 cm2 area and 25 cm3 volume each. Vegetatively propagated genotypes were planted as single-noded sprigs, and seeded cultivars were seeded as single seed.
On 13 May 2010, plants in the greenhouse were fertilized (30 kg ha−1 N, 10 kg ha−1 P and 10 kg ha−1 K) using a soluble fertilizer (Grow More Inc., Gardena, CA, USA).
On 31 May 2010, plants were mown to 5 cm and transplanted into field plots in two locations in Italy, the research station of the University of Pisa (43°40′N, 10°19′E, 6 m a.s.l.) and the research station of the University of Palermo (38°06′N, 13°20′E, 50 m a.s.l.). Monthly mean maximum and minimum temperatures recorded at the two trial sites are reported in .
Table 1. Monthly mean air temperatures (°C) and precipitations (mm) during trial period, and average (AVG 30 years) of monthly mean air temperatures (°C) and precipitations (mm) at Pisa and Palermo.
Experimental plots were 1.5 by 1.5 m with 0.5 m bare soil pathways arranged in a randomized complete-block design with four replications. One plant of bermudagrass was transplanted in the centre of each plot. Soil type at Pisa was silt-loam (Calcaric Fluvisol, 28% sand, 55% silt and 17% clay) with a pH of 7.8 and 18 g kg−1 organic matter while at Palermo soil type was sandy clay loam (Aric Regosol, 54% sand, 23% silt and 23% clay) with a pH of 7.6 and 14 g kg−1 organic matter. Irrigation was applied as needed to encourage establishment. Plots received 50 kg ha−1 N, 10 kg ha−1 P and 40 kg ha−1 K per month from June to September 2010 using 100 kg ha−1 of granular fertilizer 15.5.22. (Scotts Company), 100 ha−1 of granular fertilizer 18.5.18. (Scotts Company) and 80 kg ha−1 of ammonium sulphate 21.0.0. Assuming different mowing requirements for the different entries, plots were not mown during the year of establishment to avoid genotype by mowing interaction. In order to minimize weed competition, from two years before establishment, the experimental areas were treated twice a year with glyphosate [N-(phosphonomethyl) glycine] at 2.88 kg ha−1 a.i. The day before planting, oxadiazon [5-tert-butyl-3-(2,4-dichloro-5-isopropoxyphenyl)-1,3,4-oxadiazol-2(3H)-one] was applied at 3.36 kg ha−1 a.i. Weeds occurring during the trial period were manually removed. Encroachment of stolons into adjacent plots was avoided by the use of toothpicks that redirected the growing tip back towards the plot centre.
Data collection
From 28 to 56 days after planting (DAP), stolon growth rate was measured by marking with toothpicks the growing tip of two representative stolons in each plot. Elongation was measured weekly with a ruler and data are reported as average weekly elongation (mm week−1).
On 23 August 2010 (84 DAP), node–internode units, referred to as ‘phytomers’, were collected from different stolons. In order to consider for measurements only mature tissues, the first four nodes from the stolon tip downward were discarded. On 10 phytomers per plot, the following morphological and biomass traits were determined: internode diameter (measured with a digimatic micrometer – Mitutoyo Corp. Japan – and reported in millimeters), internode length (measured with a precision Vernier caliper and reported in millimeters), internode volume (calculated as (0.5 × internode diameter)2 × π × internode length, and reported in cubic millimeters) and phytomer dry weight (samples of 10 phytomers were put in a ventilated oven at 60°C to constant weight. Data are reported in grams).
On 11 October 2010 (133 DAP), colour (visual estimation based on a 1–9 scale with 1 = light green and 9 = dark green) and seed head density (visual estimation on 1–9 scale with 1 representing no visible seed heads and 9 the highest detectable seed head density) were assessed on the unmown canopies (Morris & Shearman Citation2008).
In the same date, one 50 cm2 core was collected to a depth of 10 cm and in proximity of the plot centre, where the turf was assumed to be fully established. On the cores, the following parameters were determined: leaf width (20 fully expanded leaves per plot were measured with a precision Vernier caliper and data are reported in millimeters), above ground dry biomass (all plant tissues were removed from the core top, collected and oven dried at 60°C to constant weight. Data are reported in grams), shoot density (direct counting with data reported as shoot No cm−2), horizontal stem density (stolons and rhizomes collected after soil washing were measured with a ruler and data are reported as cm cm−2) and node density (nodes of stolons and rhizomes collected from the core samples were counted and reported as No cm−2).
In the Pisa location, two further parameters were determined. From 14 to 56 DAP digital images of each plot were taken weekly with a Sony DSC-T70 digital camera mounted on a tripod to ensure a consistent height from the soil surface (l.02 m). Coverage of bermudagrass was determined using digital image analysis performed with the automated procedure described in Rasmussen et al. (Citation2007) available as a web-based software (www.imaging-crops.dk). Photographs of plots with two graduated tapes set orthogonally on soil surface were also taken as calibration images. The actual surface area covered by the images was calculated and percentage green coverage data were converted into square centimetre units. According to the method described by Patton et al. (Citation2007) to determine the establishment rate for each entry, coverage was transformed using the natural logarithm so that data could fit to the linear model [Coverage = (K × DAP) + I], where K is the rate of increase (loge coverage d−1), DAP is days after planting and I is equal to the natural logarithm of 1.5 cm2, which was the mean starting green coverage for all plots. In the present paper, the ‘establishment rate’ specifically refers to the calculated rate of expansion of green tissues (K).
Since instrument-based methods have been found to be non-suitable to replace visual turfgrass ratings in the comparison of dissimilar grasses (Landon et al. Citation2009), both digital image analysis and visual assessment of ground cover have been adopted to quantify establishment speed.
From 35 to 133 DAP, ground cover percentage was visually estimated (Morris & Shearman Citation2008) every other week. Data reported refer to 31 August (92 DAP) when some plots first reached full cover.
Analysis of data
Data were subjected to analysis of variance using CoStat software (Monterey, CA, USA). To test the effects of location, accession and their interaction, a factorial combination was used. Significant different means were separated using Fisher's least significant difference (LSD) at the t-probability level of 0.05.
Data collected in Pisa were used to determine the relationship between growth, morphological and biomass descriptors and establishment speed. Pearson's correlation coefficients (r) were calculated using CoStat software (Monterey, CA, USA) for both establishment rate data determined by digital image analysis and visually assessed data of ground cover at 92 DAP. Correlations were performed across all entries and for each of the sub-groupings of wild, improved, hybrid and dwarf types. For those descriptors showing significant correlation to establishment speed for all sub-groupings, linear regression curves modelling the descriptor against establishment rate or ground cover at 92 DAP were constructed.
Results
reports the parameters that were significantly affected by location.
Table 2. Bermudagrass (Cynodon (L.) Rich.) stolon internode diameter, length, volume, dry weight and leaf width determined at 84 DAP and seed heads, shoot density and node density determined at 133 DAP.
The effect of accessions was significant for all the measured parameters and data are reported in and . Probably due to the variability of data, the effect of interaction between accessions and locations only gave a few sparse changes in the ranking and in the significance of differences as reported for accessions mean effect. For ease of exposition, these data are not presented.
Table 3. Bermudagrass (Cynodon (L.) Rich.) stolon growth rate (28–56 DAP), stolon internode diameter, internode length, internode volume, phytomer dry weight and leaf width (84 DAP): accession effect averaged across locations.
Table 4. Bermudagrass (Cynodon (L.) Rich.) accessions, colour (visual estimation based on a 1–9 scale with 1 = light green and 9 = dark green), seed head density (visual estimation on 1–9 scale with1 representing no visible seed heads), dry biomass, shoot density, horizontal stem density and node density 133 DAP.
Location mean effect
A number of morphological and biomass traits were significantly affected by the location. Internodes were longer and thicker in Pisa (43 and 1.6 mm, respectively) compared to Palermo (35 and 1.2 mm; ). As a direct effect of dimensions also internode volume was higher in Pisa (98 mm3). Phytomer fresh and dry weight followed the same trend. Leaves were finer in Pisa (1.8 mm) compared to Palermo (2.4 mm) while seed head production recorded in Pisa was more than the double of Palermo.
Fully established turfs were denser in Pisa with a value of 2.11 shoots cm−2 compared to Palermo where a density 1.45 shoots cm−2 was recorded: 1.79 and 0.95 nodes cm−2 were recorded in Pisa and Palermo, respectively.
Accession mean effect
Establishment rate
Establishment rate provides a numeric value for the rate of increase in green ground coverage measured via the digital image analysis over a given period of observation. R6LA is the improved type bermudagrass that reported the highest establishment rate in the trial (). Tifsport (hybrid), Veracruz (improved) and CeRTES-9 (wild) were not statistically different from R6LA. Miniverde had the lowest establishment rate over all entries even if not significantly different from CeRTES-1 and CeRTES-7 (wild), Tift 00-01 and Tift 00-07 (hybrid), and Tifeagle (dwarf). Within each of the four groups of entries a wide range of establishment rate was observed.
Stolon growth rate
Tifsport (hybrid) had 202 mm of stolon elongation per week during the period of observation (). Values recorded for Argentina, Veracruz, Riviera and R6LA among improved types, Patriot among hybrids and CeRTES-9 among the wild types were not statistically different from that recorded for Tifsport. Stolon growth rate recorded for Miniverde was 35 mm per week with the dwarf types Tifeagle, Tifdwarf and Roma, the hybrid types Tift 00-07, Tift 00-10, Tift 00-02, Tift 00-01 and Tift 00-18, the wild types CeRTES-1, CeRTES-7 and CeRTES-4 and the improved types Yukon and Sovereign not reporting significant differences for this parameter.
Internode diameter
Internodes thicker than 2.0 mm were only found in wild types CeRTES-13, CeRTES-2 and CeRTES-5 (). Within the improved types Grand Prix had the thickest internode with 2.0 mm diameter. In contrast most of the thinnest internodes were found in dwarf types with 0.7 mm recorded for Roma and 0.9 mm recorded for Tifdwarf, Tifeagle and Miniverde. CeRTES-12 had astolon diameter not different in size from most of the wild types. Improved types had stolon diameter ranging from 1.1 mm (Sovereign) to 1.7 mm (Barazur) while for hybrid types values ranged from 1.0 (Santa Ana) to 1.4 (Patriot).
Internode length
The longest internodes were observed for the wild type CeRTES-11 with 91 mm (). The improved types Argentina and Riviera had internodes significantly shorter than CeRTES-11 but still statistically longer compared to the remaining entries. As expected, the shortest internodes were recorded in three dwarf types (Tifeagle, Miniverde and Tifdwarf) even though the relative values were not significantly different from two hybrid types (Tift 00-02 and Tift 00-07).
Internode volume
As an effect of stolon length and diameter, the entry having the larger stolon internode volume was CeRTES-5 with 205 mm3 (). Values recorded for dwarf types Miniverde and Tifeagle were 10 mm3; these being not statistically different from those of other dwarf types (Roma, Tifdwarf and Tifgreen), a wild type (CeRTES 12), hybrid types (Tift 00-18 Tift 00-07, Tift 00-02 and Tift 00-10) and an improved type (Princess 77) with overall values ranging from 12 to 34 mm3.
Phytomer dry weight
Highest phytomer dry weights were recorded for the wild types CeRTES-5, CeRTES-11 and the improved type Argentina (). Lowest phytomer weights were found in all groupings of entries as CeRTES 12 among wild types, Princess 77 among improved types, Tift 00-02, Tift 00-07, Tift 00-10 and Tift 00-18 among hybrid types, and Miniverde, Tifdwarf, Tifeagle, Tifgreen and Roma among dwarf types.
Leaf width
The coarser leaves were found in wild types CeRTES-2 and CeRTES-6 (). CeRTES-12 showed a leaf width that was not statistically different from many hybrid and dwarf types. Roma, Champion, Tifdwarf and Tifgreen were the dwarf varieties exhibiting narrow leaves compared to entries belonging to wild, improved and hybrid type.
Ground cover percentage
Data reported in refer to 31 August (92 DAP), when some of the accessions were rated as totally covering the 2.25 m2 plot surface. Those with full coverage included two improved types (Veracruz and R6LA) and two hybrid types (Santa Ana and Tifsport). Even if not reaching full cover, ground cover of improved types Riviera and Argentina, hybrid types Patriot and wild types CeRTES-9 was not significantly different. Ninety-two days after planting only 18 entries out of 44 had reached a ground cover exceeding 50% of the plot surface.
Colour
Among wild types, CeRTES-7 was the darkest entry while among entries belonging to the improved types, the highest (Barazur) and the lowest (Riviera) values across all bermudagrasses were recorded. Santa Ana and Tifsport were the two varieties with the lighter colour among hybrid types, and Miniverde was scored as the darkest among the dwarf types.
Seed heads
The highest value was recorded for the improved type Veracruz. Miniverde (dwarf type) and Bull's Eye were virtually free of seed heads with CeRTES 13 (wild type), Patriot, Tift 00-02 (hybrid types), Tifeagle and Roma (dwarf types) receiving a score not significantly different.
Above ground biomass
Riviera, Argentina, R6LA, Veracruz, Yukon, Patriot and Santa Ana had a high dry biomass production with no significant difference among them. Significantly less biomass was recorded for CeRTES-1, CeRTES-7, CeRTES-10, Celebration, Grand Prix, Princess 77, Sovereign, SR9554, Wintergreen, Tifsport, Tifway, Tift 00-01, Tift 00-07, Tift 00-10, Tift 00-18, Tift 00-24, Tift 00-27, Miniverde, Tifdwarf, Tifeagle and Roma.
Shoot density
Most of the wild types had loose turfs with densities that ranged from 1.5 (CeRTES-4) to 0.6 shoots cm2 (CeRTES-1). CeRTES-12 was the only wild type entry producing a turf with superior density compared to improved, hybrid and dwarf types. Riviera had a density statistically lower compared to most of the entries of the group of improved bermudagrasses with only Argentina being not significantly different. Tift 00-01 was denser compared to the other hybrid types with the only exception of Santa Ana. Among dwarf bermudagrasses, Tifdwarf was the only one less denser than Uganda.
Horizontal stem density
The wild type CeRTES-12 had the highest value (). Low values were recorded for wild types CeRTES-1, CeRTES-2, CeRTES-4, CeRTES-7, CeRTES-8 and CeRTES-12, improved types Bull's Eye, Celebration and SR9554, hybrid types Tift 00-07 and Tift 0010 and dwarf types Miniverde, Tifdwarf and Tifgreen.
Node density
CeRTES-12 showed the highest number of nodes per surface unit while for most of the entries of the same group of wild types (CeRTES-1, CeRTES-2, CeRTES-3 CeRTES-4, CeRTES-7, CeRTES-8, CeRTES-9, CeRTES-11), low values were recorded.
Low values were observed also for the improved types Argentina, Celebration and Grand Prix and the hybrid type Tifsport.
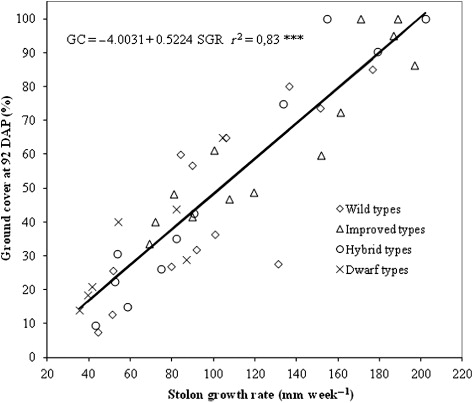
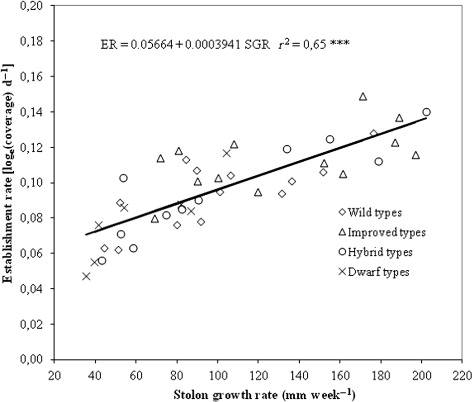
Correlation analysis of establishment rate and ground cover with all the morphological, growth and biomass traits revealed that several characteristics determined on plants were positively correlated with the two indicators of establishment speed (). In particular, when all the data set was used, ground cover recorded at 92 DAP and establishment rate were positively correlated with stolon growth rate (r = 0.91 and 0.80, respectively), internode length (r = 0.55 and 0.43, respectively) and above ground dry biomass (r = 0.59 and 0.57, respectively). Ground cover at 92 DAP was negatively correlated with colour (r = 0.46) while a further positive correlation was found between establishment rate and seed head production (r = 0.46). Additionally, the two indices of establishment speed were found to be strongly correlated (r = 0.88).
Table 5. Pearson correlation coefficients (r) among 92 DAP ground cover and establishment rate and morphological and biomass traits determined at Pisa location for 44 Cynodon (L.) Rich. entries.
When correlations were calculated separately for each grouping of entries, most of them lost their significance for one or more of the grouping thus suggesting that the correlation of variables observed across the entire data set could not be assumed as a general description of bermudagrass establishment.
Stolon growth rate was the only growth trait that confirmed a strong positive correlation with both ground cover at 92 DAP and establishment rate for all sub-grouping of entries included in the trial. The strongest correlation between 92 DAP ground cover and stolon growth rate was found in improved types with a correlation coefficient of 0.92 whilst the weakest was observed for wild types with a correlation coefficient of 0.8. Correlations between establishment rate and stolon growth rate had coefficient ranging from that of hybrid types (r = 0.88) and that of improved types (r = 0.58). Therefore, stolon growth rate can be considered a good predictor of establishment speed for all bermudagrass types.
Scatter plot of observed data and regression curves representing the ground cover at 92 DAP and establishment rate as affected by stolon growth rate are reported in and .
Discussion
The study carried out on a pool of genetically and morphologically different entries belonging to the genus Cynodon has highlighted a wide variability of morphological, growth and biomass traits.
As expected, morphological traits gave a general description of bermudagrasses with most of the wild types having long and thick internodes, coarse leaf texture and low shoot density.
In comparison, hybrid and dwarf types had in general short and thin internodes with fine leaves and a higher shoot density.
The general trend observed for stolon growth rate indicated improved types as the fastest growing bermudagrasses with dwarf types being the slowest.
Biomass traits, namely phytomer dry weight and above ground biomass, did not show any consistent trend through bermudagrass types.
Establishment speed, as determined by ground cover at 92 DAP or by establishment rate derived by digital image analysis, was associated with a number of morphological, growth and biomass descriptors, but a correlation able to describe the association of variables across all bermudagrasses and for every single sub-grouping was found only with stolon growth rate.
This result is in accordance with previous findings reported on warm season grasses by Patton et al. (Citation2007), Volterrani et al. (Citation2008) and Pompeiano et al. (Citation2012).
In past research work, stolon internode length has been investigated as a descriptor of establishment speed. While Volterrani et al. (Citation2008) did not report any evident association of this morphological trait with the establishment speed of three warm season species, Roche and Loch (Citation2005) found a strong association between internode length and rates of lateral spread in eight dwarf bermudagrasses. Nonetheless, they also found that such association of variables did not fully explain differences in rates of lateral spread since the role played by growing conditions could have affected the speed of spreading as well.
Also in our study stolon internode length was associated with establishment speed as a general trend but the lack of consistency through all the Cynodon groupings indicated that this trend could not be assumed as a reliable descriptor of establishment speed for bermudagrass.
Stolon growth rate can be considered as an indirect indication of growing conditions occurring during the observation period, hence the correlation of stolon growth rate and establishment speed could be a further confirmation of the effect of growing conditions reported by Roche and Loch on bermudagrass establishment speed.
The lack of association between green turf cover determined via digital image analysis and stolon growth rate observed in Volterrani, Pompeiano et al. (Citation2012) is apparently in contrast with the relation observed in this trial between ground cover and stolon growth rate. Assuming a limited bias due to the methods adopted, the most relevant difference between the two experiments is that observations on ground cover refer to 28 and 92 DAP, respectively. Ground cover during the early stages of establishment seems therefore to be affected predominantly by stolon number and total length while the effect of stolon growth rate becomes evident at a later stage.
As reported by Richardson et al. (Citation2001) and Patton et al. (Citation2007), digital image analysis-derived data and visually assessed ground cover proved to be strongly correlated suggesting that both can be valid tools for turfgrass ratings.
In conclusion, different bermudagrasses types have distinctive morphological, growth and biomass traits. When considered as a whole, speed of establishment appears to be related to some of these traits. On the other hand, when considering selected sub-groupings, which are representative of morphologic and genetic diversity that can be found in turf bermudagrasses, only stolon growth rate was found to be strongly correlated to the speed of establishment.
An aggressive lateral growth is commonly assumed to be associated with quick establishment and high recuperative potential. The correlation found between stolon growth rate and establishment speed seems to confirm this empirical knowledge. Concerning recuperative potential, a recent experiment carried out on warm season turfgrasses (Lulli et al. Citation2012) is in line with this assumption as well. Results highlighted in fact that tissue constituents underlying an active growth were more important for turfgrass recovery than the density of living tissues retained after the damage.
Acknowledgements
The authors wish to acknowledge Dr Wayne Hanna, the University of Georgia, for providing experimental clones of hybrid bermudagrass.
Funding
This trial was carried out within the project ‘Sistemi avanzati per la produzione vivaistica di tappeti erbosi di specie macroterme ad uso multifunzionale a basso consumo idrico ed energetico’, funded by the Italian Ministry of Food, Forest and Agricultural Policies.
Additional information
Funding
References
- Anderson JA, Taliaferro CM, Martin DL. 1993. Evaluating freeze tolerance of bermudagrass in a controlled environment. HortScience. 28:955–959.
- Baltensperger A, Dossey B, Taylor L, Klingerberg J. 1993. Bermudagrass, Cynodon dactylon (L.) Pers., seed production and variety development. Int Turf Soc Res J. 7:829–838.
- Beard JB, Sifers SI. 1996. New cultivars for Southern putting greens. Golf Course Manag. 64:58–62.
- De Brujin J. 2012 Aug 14. Bermudagrass plant named ‘Barazur’. United States Plant Patent N° US PP22,963 P3.
- Imaging Crop Response Analyser. Version 0.4. [cited 2010 Nov]. Available from: www.imaging-crops.dk
- Landon DB, Johnson PG, Kopp KL, Van Dyke A. 2009. Tools for evaluating native grasses as low maintenance turf. HortTech. 19:626–632.
- Lulli F, Volterrani M, Grossi N, Armeni R, Stefanini S, Guglielminetti L. 2012. Physiological and morphological factors influencing wear resistance and recovery in C3 and C4 turfgrass species. Funct Plant Biol. 39:214–221.10.1071/FP11234
- McCarty LB, Miller G. 2002. Managing bermudagrass turf. Chelsea (MI): Ann Arbor Press; p. 221.
- Morris KN, Shearman RC. 2008. NTEP turfgrass evaluation guidelines. Beltsville (MD): National Turfgrass Evaluation Program; [cited 2013 Jan 15]. Available from: http://www.ntep.org/cooperator.htm
- Nickson D. 2009 May 26. Cynodon dactylon plant named ‘Grand Prix’. United States Plant Patent N° US PP20,017 P3.
- Patton AJ, Volenec JJ, Reicher ZJ. 2007. Stolon growth and dry matter partitioning explain differences in zoysiagrass establishment rates. Crop Sci. 47:1237–1245.10.2135/cropsci2006.10.0633
- Pompeiano A, Grossi N, Volterrani M. 2012. Vegetative establishment rate and stolon growth characteristics of 10 zoysiagrasses in southern Europe. HortTech. 22:1–7.
- Rasmussen J, Nørremark M, Bibby BM. 2007. Assessment of leaf cover and crop soil cover in weed harrowing research using digital images. Weed Res. 47:299–310.10.1111/j.1365-3180.2007.00565.x
- Richardson MD, Boyd JW. 2001. Establishing Zoysia japonica from sprigs: effects of topdressing and nitrogen fertility. HortSci. 36:377–379.
- Richardson MD, Karcher DE, Purcell LC. 2001. Quantifying turfgrass cover using digital image analysis. Crop Sci. 41:1884–1888.10.2135/cropsci2001.1884
- Roche MB, Loch DS. 2005. Morphological and developmental comparisons of seven greens quality hybrid bermudagrass (Cynodon dactylon (L.) Pers. x C. transvaalensis Burtt-Davy) cultivars. Int Turfgrass Soc Res J. 10:627–634.
- Severmutlu S, Mutlu N, Shearman RC, Gurbuz E, Gulsen O, Hocagil M, Karaguzel O, Heng-Moss T, Riordan TP, Gaussoin RE. 2011. Establishment and turf qualities of warm-season turfgrasses in the Mediterranean region. HortTech. 21:67–81.
- Stiglbauer JB, Liu H, McCarty LB, Park DM, Toler JE, Kirk K. 2009. ‘Diamond’ zoysiagrass putting green establishment affected by sprigging rates, nitrogen sources, and rates in the southern transition zone. HortSci. 44:1757–1761.
- Taliaferro CM. 2003. Bermudagrass (Cynodon (L.) Rich.). In: Casler MD, Duncan RR, Editor. Turfgrass biology, genetics, and breeding. Hoboken (NJ): Wiley; p. 235–256.
- Volterrani M, Grossi N, Lulli F, Gaetani M. 2008. Establishment of warm season turfgrass species by transplant of single potted plants. Acta Hort. 783:77–84.
- Volterrani M, Magni S, Gaetani M, Lulli F. 2012. Trinexapac-ethyl effects on stolon activity and node vitality of ‘Tifway’ hybrid Bermudagrass. HortTech. 22:479–483.
- Volterrani M, Pompeiano A, Magni S, Guglielminetti L. 2012. Carbohydrate content, characterization and localization in bermudagrass stolons during establishment. Acta Agric Scand Sect B. 62:62–69.
- Wu YQ, Taliaferro CM, Martin DL, Anderson JA, Anderson MP. 2007. Genetic variability and relationship for adaptive, morphological, and biomass traits in Chinese bermudagrass accessions. Crop Sci. 47:1985–1994.10.2135/cropsci2007.01.0047