
Abstract
There is uncertainty regarding the suitability of some soils for mole drainage. Soils with questionable potential for the formation of stable mole channels generally have <45% clay and >20% sand, and gravel mole drainage is an alternative. However, this technique is unattractive due to its relative cost (2014 price: €1500–2800 ha−1 versus €125–300 ha−1). The performance of conventional mole drains and gravel mole drains was compared on a clay loam soil in the south of Ireland over 12 rainfall events. The installation dates of mole drainage treatments were staggered (January versus July) to assess how soil moisture status during installation affected performance. Treatments were (A) undrained control, (B) mole drainage installed in January 2011 (suboptimal), (C) mole drainage installed in July 2011 (optimal) and (D) gravel mole drainage installed in July 2011. Gravel mole drains were consistently more efficient in removing excess water than mole drains. Mean total drain flow (DF) during rainfall events was greater (P < .05, standard error 0.56 mm) in gravel mole drains (7.4 mm) than any mole drainage treatment irrespective of installation conditions (B [3.8 mm] and C [4.2 mm]). Initially, DF volumes exceeded overland flow (OF) in all treatments (Events 1–4, mean total OF was 0.47 [±0.08] of mean total DF). From Event 5 onwards, this relationship changed with OF being greater than DF (mean total OF was 2.02 [±0.41] of mean total DF). Results showed that across treatment replicates, the water table depth was consistently shallower in control plots. Mole drains were effective for a period of approximately 2 years. Although gravel mole drains were more effective, they were also subject to significant deterioration during the study. Installation conditions had no effect on mole drain performance. The results suggest that on this site conventional mole drainage repeated every 2 years could provide adequate drainage at low cost.
Introduction
In Ireland, many farms are located in areas where high rainfall, underlying geology, glacial history and landscape position have given rise to poorly drained soils. Precipitation ranges from 750 to 1400 mm year−1 (excluding mountainous areas), while evapotranspiration ranges from 390 to 570 mm (Mills Citation2000). On low-permeability soils in wet growing seasons, the topsoil may never undergo significant drying, as persistent rainfall maintains high soil moisture contents (Mulqueen Citation1974). On grassland farms, this inhibits soil trafficability, reduces the potential number of grazing days and hinders silage harvesting (Brereton and Hope-Cawdery Citation1988; Shalloo et al. Citation2004). Such conditions necessitate land drainage with significant discharge capacity (12–25 mm day−1; Mulqueen & Hendricks 1986; Collins et al. Citation2004) if productivity is to be improved.
The objective of any form of land drainage is to control the position of the water table (WT) (Nijland et al. Citation2005). In designing drainage systems, particular attention is paid to layers of exceptionally poor or exceptionally high permeability in the soil profile (Ryan Citation1986). Layer-specific disturbed soil samples are collected and analysed to establish soil texture (by hand or in the laboratory). The saturated hydraulic conductivity (ks, m day−1) of various layers can be measured or derived from the textural data by pedotransfer function (Saxton & Rawls Citation2006). For conventional drainage systems, these parameters can then be used as inputs to design equations to determine drain spacing and depth (Ernst Citation1956; Kirkham Citation1958; Toksöz & Kirkham Citation1961, Citation1971a, Citation1971b; Ritzema Citation1994).
Where no high-permeability layers are obvious, a shallow drainage system incorporating a soil disruption technique to improve permeability is implemented (Childs Citation1943; Burke et al. Citation1974; Spoor Citation1982; Robinson et al. Citation1987). Soil disruption techniques include mole drainage and gravel mole drainage. Mole drains are formed with a mole plough comprising a torpedo-like cylindrical foot attached to a narrow leg, followed by a slightly larger diameter cylindrical expander (Godwin et al., Citation1981). The foot and trailing expander form the mole channel while the leg creates a narrow slot that extends from the soil surface down to the mole channel depth (Cavelaars et al., Citation1994).
The suitability of a given soil for the formation of a stable mole channel is open to debate (Rycroft & Thorburn Citation1974; Galvin Citation1982; Mulqueen Citation1985). Soil having >45% clay and <20% sand was deemed optimal by Burke (Citation1978) and Cavelaars et al. (Citation1994). In Ireland, gravel-filled mole drains were developed (Mulqueen Citation1985) for those soils lacking the required stability for long-term effectiveness of mole channels (Spoor et al. Citation1982a, Citation1982b; Spoor Citation1985). The difference between the mole types is (1) cost, conventional mole drains are €125–300 ha−1, whereas gravel mole drains are €1500–2800 ha−1 (Crosson et al. Citation2013), and (2) lifespan; conventional mole drains last between 1 and 5 years (Galvin Citation1983, Citation1986; Cavelaars et al. Citation1994) whereas gravel mole drains are expected to last more than 10 years (Mulqueen Citation1985).
The study reported in this paper was undertaken on a grassland farm dominated by clay loam (sand 36%, silt 36% and clay 28%) textured soils (Necpalova et al. Citation2012), but this varies considerably throughout the farm. This soil texture, combined with climate, is not optimal for animal production and is also perhaps not ideal for stable mole channel formation (Burke Citation1978). National agricultural policy (Department of Agriculture, Fisheries and Food Citation2010), driven by regional European policy, is placing pressure on such farms to increase productivity, so demand is rising for practical drainage solutions that can be implemented on farms with limited resources for investment. While gravel mole drainage, designed for such situations could be prescribed for the site, the high cost makes this technique unattractive for landowners. The relative performance of mole and gravel mole treatments on such a site would determine the effectiveness of both treatments and establish whether the increased cost of the gravel moles can be justified in such a soil. Furthermore, the soil rupturing required for optimal mole drainage performance is highly dependent on soil moisture content at the time of installation (Galvin Citation1983; Smedema & Rycroft Citation1983). In many parts of Ireland, the season for carrying out mole drainage is severely restricted and landowners are often forced to install mole channels in non-ideal conditions. Therefore, the objective of this study was to compare mole and gravel mole drainage performance in a clay loam soil, to elucidate if gravel mole drainage could justify its high cost and to establish if sub-optimal installation conditions affected performance.
Materials and methods
Site details
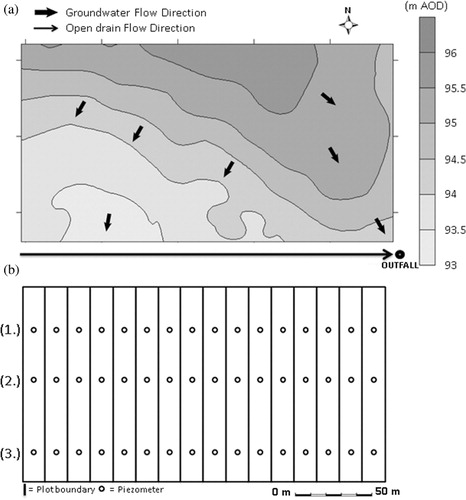
The site (2.5 ha) was located at the Solohead Research Farm (52 ha) in the south of Ireland (52°30′N, 08°12′W) () and slopes gently (1.4%) with a southerly aspect. Average annual rainfall (10 years; measured on site) is 1070 mm. The study site comprises poorly drained gleys (90%) and grey brown podzolics (10%) (Gardiner & Radford Citation1980). A perched WT fluctuates seasonally (depth range from 0 to 2.2 m below ground level [bgl]) (Necpalova et al. Citation2012).
Drainage installation
In August 2010, a large open drain, up to 2 m deep, was excavated to enable mole/gravel drain installation and facilitate monitoring equipment. The study area was isolated from outside run-on using an isolation ditch, comprising a 1-m-deep trench filled with stone aggregate. In January 2011, the area was divided into four blocks (60 m wide, 100 m long). Each block was subdivided into four 15-m-wide plots. One of four treatments was imposed in each plot in a randomised complete block design. The four treatments were (A) undrained control, (B) mole drainage installed in January 2011, (C) mole drainage installed in July 2011 and (D) gravel mole drainage installed in July 2011. Adjacent plots were separated by low soil side ridges (0.30 m high).
The mole plough (M. Tighe Engineering, Navan, Co. Meath, Ireland) had a 0.075-m-diameter foot, a 0.08-m-diameter expander plug and an adjustable leg capable of reaching a depth of 0.55 m. Mole drainage was installed at a depth of 0.55 m and spacing of 1.2 m. The depth was chosen as the maximum attainable by the mole plough, to induce maximum soil disruption. Spacing was determined as the closest allowable given the width of the tractor used for drawing the mole plough and the need to avoid tracking over newly formed adjacent mole channels. The gravel mole plough (O' Keeffe Engineering, Listowel, Co. Kerry, Ireland) had a 0.08-m-wide foot and could reach depths up to 0.40 m. It was set to instal a 0.20-m-high column of gravel (10–20 mm) in the channel. Gravel mole drainage was installed at a depth of 0.40 m and spacing of 1.2 m.
Experimental measurements
Soil physical analysis
Disturbed soil samples from soil test pits, representative of distinct soil horizons were bulked for each horizon and analysed for sand, silt and clay% (laser diffraction method with correction for clay fraction underestimation) (Konert & Vandenberghe Citation1997). Indicative saturated hydraulic conductivity (ks) was inferred using Saxton and Rawls (Citation2006).
Meteorological data
An automated weather-station (Campbell Scientific Ltd. Loughborough, UK) provided input parameters for the estimation of daily soil moisture deficit (SMD) and drainage or ‘effective drainage’ (ED; the total amount drained via percolation and overland flow [OF]) using the hybrid grassland model of Schulte et al. (Citation2005). The total number of rain days (≥0.2 mm day−1), wet days (≥1.0 mm day−1), very wet days (≥10.0 mm day−1) and extremely wet days (≥20.0 mm day−1) were estimated according to Keane & Sheridan (Citation2004).
Flow event delineation and antecedent conditions
A period of 12 hours without rainfall was used to separate one rainfall event from another (Kurz et al. Citation2005; Ibrahim et al. Citation2013). A ‘perceptible rise in discharge’ signalled the start of the flow event, while the end of the event was defined as flow returning to pre-event flow levels (Vidon & Cuadra Citation2010). Base-flow from the treatments was non-existent such that the start and end of flow events was clearly defined. Seven-day and 30-day antecedent precipitation for each event was calculated by computing total precipitation (mm) in the 7 and 30 days preceding the event.
Soil moisture status
Prior to installation of each treatment, three soil samples were collected from the layer at 0.0 to 0.3 m bgl and at 0.3 to 0.6 m bgl in two locations in each plot being drained, using a soil sampling kit and stainless steel cores having a volume of 9.82 × 10⁻⁵ m2 (Eijkelkamp, Agrisearch Equipment, Giesbeek, The Netherlands). Gravimetric moisture content (g g−1) of a bulked soil sample from each depth was measured using standard methods (Phelan et al. Citation2013). Seven-day and 30-day antecedent and subsequent precipitation for each installation was calculated by computing total precipitation (mm) in the 7 and 30 days preceding and following installation. SMD on the day of each installation was calculated from meteorological data using the hybrid grassland model of Schulte et al. (Citation2005).
After treatment installation, four subplots were established along the centreline of each plot to take account of variations in the soil water regimen. Volumetric moisture content (VMC) in the upper 0.05 m of soil was measured at three locations in each subplot (a total of 12 per plot) using an ML2x soil moisture measurement kit (Delta-T Devices Ltd, Burwell, Cambridge, UK) on a weekly basis. Where rainfall events occurred between weekly data points, VMC was estimated by interpolation.
Overland and subsurface drain flow
All OF from each plot was channelled towards an outlet point. In each drained plot, the five central mole or gravel mole channels were connected to a pipe, which directed their combined flow to a separate measurement tank. The OF and drain flow (DF) passed through a v-notch weir constructed within their respective 1.0 × 0.6 × 0.6-m measurement tank (Carbery Plastics, Clonakilty, Co. Cork, Ireland). In three plots from each treatment, the tanks were fitted with a Sigma area/velocity probe connected to a Sigma 920 flowmeter (HACH Company, MD, USA) to monitor flow. Flow rate from each system was measured continuously, with the average rate logged every 15 minutes. The ratio of flow (OF or DF) to ED in each monitored plot was calculated, to standardise flows across events, as the ratio of total flow (normalised by area) to ED (both in millimetre).
WT depth
Fully screened piezometers (three per plot, high density polyethylene [HDPE] pipes [Eijkelkamp, Agrisearch Equipment]) were installed to below water strike (2–3 m bgl) in an upslope, mid-slope and downslope location in each plot (). Weekly manual measurements of WT depth were made using an electronic dipper (Marton Geotechnical Services Ltd, Suffolk, UK). Where rainfall events occurred between weekly data points, WT position was interpolated.
Statistical analysis
All data (OF, DF, WT depth and VMC) were analysed by analysis of variance with treatment as a factor. Multiple comparisons between treatments were made using the general linear model Tukey method in MINITAB statistical analysis package (MINITAB release 16, Minitab Inc., PA, USA).
Results
Soil physical analysis
Samples taken from soil test pits on the site had high clay content at the mole and gravel mole installation depths with low permeability (). This places the soil type in the clay textural class but suboptimal for stable mole channel formation.
Table 1. Soil profile texture and estimated hydraulic conductivity.
Meteorological data
On-site annual rainfall was 1131 mm and 953 mm in 2012 and 2013, respectively. The year 2012 was characterised by a relatively dry spring and early summer (January to May) with 248 mm of rainfall recorded, compared to the 10-year average of 396 mm, followed by an extremely wet period (June to December) with 882 mm rainfall compared with the 10-year average of 669 mm. Rainfall in the January to May 2013 period (376 mm) was similar to the 10-year average (396 mm). The period June to November 2013 was relatively dry with 418 mm of rainfall, relative to a 10-year average of 557 mm. December 2013 was wetter than the 10-year average (162 mm versus 113 mm). Total evapotranspiration was 513 mm in 2012 and 471 mm in 2013. Annual ED was 600 mm in 2012 and 482 mm in 2013. No ED occurred for a 126-day period in 2013 from 30 May to 2 October with the exception of 5–10 August, where a total of 1.6 mm of ED was estimated. Mean daily SMD was −3.9 mm in 2012 and 4.1 mm in 2013. Saturated soil conditions (SMD = −10 mm) occurred on 88 days in 2012 and 71 days in 2013 while there was excess soil water above field capacity (SMD < 0 mm) on 285 days in 2012 and 221 days in 2013.
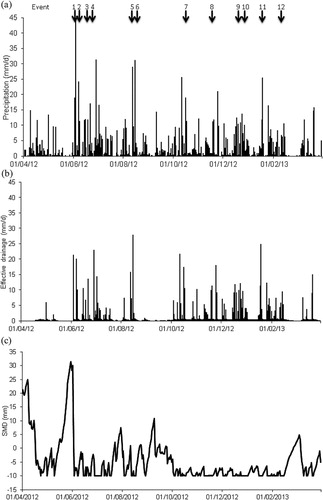
The 12 rainfall events in this study were selected from within the year beginning 1 April 2012. Ideally some events from summer 2013 would also have been included to analyse temporal variations over an extended period, unfortunately the atypically dry conditions experienced in the summer and autumn of 2013 prevented this. The current study therefore looked at drainage performance during the second year of operation of the drains. Total rainfall for the year beginning 1 April 2012 was 1242 mm. The total number of rain days, wet days, very wet days and extremely wet days in this period were above the 10-year annual average (289 versus 224 days; 181 versus 170 days; 37 versus 30 days and 8 versus 7 days, respectively). Daily precipitation, ED and SMD data for the year beginning 1 April 2012 is presented in , the timing of rainfall events is also indicated. Total event precipitation () was highest for Event 1 (63.8 mm) and lowest for Event 9 (10.4 mm).
Table 2. Pre-event and event precipitation characteristics of the 12 selected events.
Soil moisture and weather status at installation
Treatment B was installed on 31 January 2011. SMD (a negative value indicates excess soil water above field capacity [Schulte et al. Citation2005]) on that date was −2.3 mm (). Mole drainage installation on this date was characterised by traction problems on the wet surface and extensive surface and sward damage. In some localised areas, ruts up to 0.20 m deep were formed. Mole channels were however installed in good condition. Treatment D was installed on 12 July 2011, while Treatment C was installed on 14 July 2011. Surface disruption was minimal on both dates, due to the drier soil conditions prevailing () and was confined to that induced by the plough itself.
Table 3. Soil moisture status on treatment installation dates.
Overland and subsurface drain flow patterns
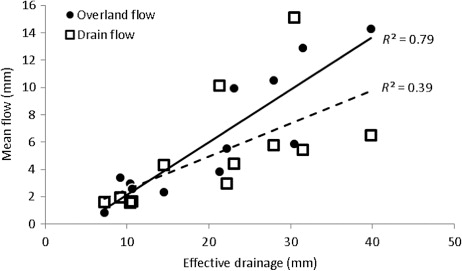
Event total OF was significantly correlated with event duration (P < .001), 30-day antecedent precipitation (P < .05), event precipitation (P < .001), maximum precipitation intensity (P < .001) and ED (; P < .001). Event total DF was significantly correlated with 7-day antecedent precipitation (P < .05), 30-day antecedent precipitation (P < .01), antecedent SMD (P < .01), event precipitation (P < .001), maximum precipitation intensity (P < .01), mean precipitation intensity (P < .01) and ED (; P < .001).
Flow variation between treatments
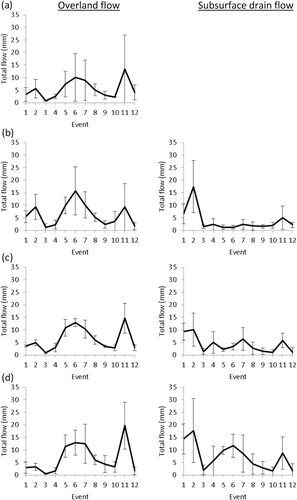
The mean total amount drained () via OF and DF during events in Treatments A, B, C and D was 5.5, 10.1, 10.5 and 14.1 mm, respectively. Significantly more water was removed from drained Treatments B, C and D relative to control Treatment A (P < .05, standard error [SE] 1.05 mm).
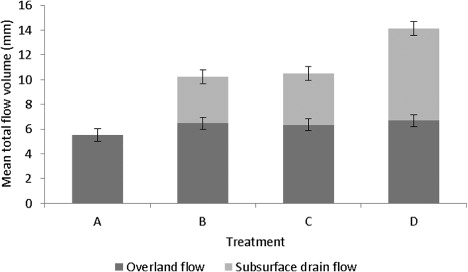
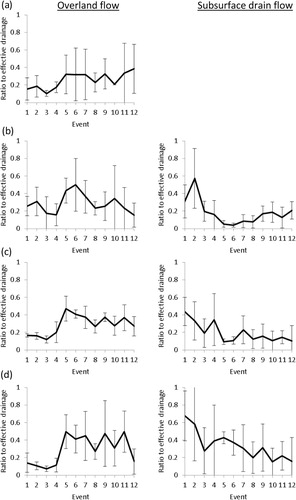
Mean total OF (5.5–6.7 mm; ) and mean ratio of OF to ED (0.24–0.30) were not significantly affected by treatment. Mean total DF was greater (P < .05, SE 0.56 mm) in Treatment D (7.4 mm) than either Treatment B (3.8 mm) or C (4.2 mm), which were not significantly different (). The mean ratio of DF to event ED was also significantly higher (P < .01, SE 0.021) in Treatment D (0.34) than Treatment B (0.18) or C (0.20), which were not significantly different.
Flow variation across rainfall events
There was a clear behavioural change in flow response ( and ) in all treatments over the study. During the first four events, DF was dominant relative to OF. After Event 4, there was a distinct decrease in DF relative to OF in all treatments. For Events 1–4, mean (SD) total OF was 0.47 (0.08) of mean total DF. For Events 5–12, mean total OF was 2.02 (0.41) of mean total DF. The mean ratio of DF to ED in Events 1–4 was 0.31, 0.33 and 0.48 in Treatments B, C and D, respectively, relative to values of 0.12, 0.13 and 0.27 in Events 5–12. Subsurface drain flow in Treatment D remained dominant for a greater number of events than in Treatments B and C. For example, the total DF from Treatment D during Event 6 was 11.7 mm, relative to 1.3 mm from Treatment B and 3.4 mm from Treatment C (P < .05, SE 1.79 mm).
WT and soil moisture status response to treatments
Across replicates, the WT depth was consistently shallower in the undrained control than in the drainage treatments. Mean pre-event WT depth was 0.65 m bgl in Treatment A relative to 0.80, 0.80 and 0.87 m bgl for Treatments B, C and D, respectively, (P < .05, SE 0.038 m), with post-event means of 0.52, 0.71, 0.72 and 0.78 m bgl for A, B, C and D, respectively (P < .05, SE 0.041 m).
The average WT depth was 0.78 m bgl before rainfall events, and rose by an average of 0.10 m during the events studied. The maximum increase in mean WT depth was 0.19 m during Event 8, while the minimum increase in mean WT depth was 0.01 m during Event 11. The change in WT depth during events was more pronounced in the control, rising 0.12 m on average, relative to 0.10, 0.08 and 0.09 m in Treatments B, C and D, respectively. Mean pre-event WT depth was 1.03 m in the upslope position, 0.68 m in mid-slope and 0.65 m in the downslope position. The equivalent post-event means were 0.98, 0.59 and 0.55 m, respectively.
Mean VMC in the upper 0.05 m was greater (P < .05) in Treatment A than in Treatments B, C and D pre-event (SE 0.006 g g−1) and post-event (SE 0.006 g g−1). Mean pre-event VMC was 0.56, 0.53, 0.53 and 0.54 g g−1 for Treatments A, B, C and D, respectively. Mean post-event values were 0.60, 0.57, 0.57, 0.57 g g−1. Average VMC was 0.54 g g−1 pre-event and 0.58 g g−1 post-event.
Discussion
Gravel mole drainage was designed for soils that require the close spacing and soil rupturing provided by mole drainage but where the mole channels themselves are unstable. However, the high cost associated with gravel mole drainage makes it potentially uneconomical on many farms. Furthermore, the season for carrying out effective mole drainage is severely restricted in some areas and landowners are often forced to install mole drainage in non-ideal conditions. The results have shown that although less effective than gravel mole drainage, mole drainage has some value, regardless of installation conditions.
Soil moisture status at installation
Installation conditions for Treatments C and D resulted in minimal surface damage. Treatment B was installed in adverse conditions, due to antecedent weather conditions. The damage caused to the surface during installation was due to the lack of surface traction caused by the soil water content. In spite of the damage, the performance of Treatment B, in terms of flow response and WT control, was not significantly different to Treatment C during the study period.
Overland and subsurface drain flow patterns
Flow variation between treatments
Mole and gravel mole drainage were effective in removing excess water off site. Variations between treatments were not constant across rainfall events as other factors influenced flow response. OF and DF during events were strongly dependent on pre-event and event hydrometeorological conditions due to the effect of antecedent soil moisture status and flow dynamics during events.
The greater DF in Treatment D relative to Treatments B and C ( and ) indicated that gravel mole drainage was more effective than mole drainage in this soil type. This was due to sustained DF during events in Treatment D relative to those for Treatments B or C. The flow-through gravel mole drains was more intense with greater peak flow rates and greater total flows than other treatments.
Flow variation across rainfall events
The change in flow behaviour from Event 5, with increased OF relative to DF was seen in all treatments but particularly in the mole treatments, regardless of installation date ( and ). This was most likely due to the persistent intense rainfall in this period () and the associated increase in soil moisture content.
Mole and gravel mole drainage are dependent on the establishment of a network of cracks and fissures, essentially soil macropores, connecting the soil surface to the mole channel (Galvin Citation1983, Citation1985; Youngs Citation1985; Robinson et al. Citation1987). The development of such a cracking pattern allows water flow with little resistance compared with water moving through the soil itself (Goss et al. Citation1983; Hallard & Armstrong Citation1992). These macropores are quite dependent on soil moisture status due to the shrink/swell nature of the high clay content soil. Under normal summer conditions, the soil matrix would dry and help propagate shrinkage cracks, allowing for rapid flow from the soil surface to the mole drains (Jarvis & Leeds-Harrison Citation1987). When the clay swells in winter, these cracks shrink, thus reducing the ks of the soil (Robinson et al. Citation1987). As a consequence, these drainage techniques are at their most effective when the soil is at its driest, but effectiveness is reduced during wetter conditions (Burke et al. Citation1974).
It appears that the wet conditions prevailing on site in the summer of 2012 resulted in a greater natural propensity for OF and reduced the level of soil macropores to such an extent as to inhibit drainage through the moles/gravel moles. In the upper 0.05 m, mean pre-event VMC (%) for the first four events was 0.46 g g−1, while mean pre-event VMC for the latter eight events was 0.58 g g−1. This change in soil moisture status may be the principal reason for differences in OF relative to DF between events. The stronger sustained DF response from Treatment D relative to that from Treatments B and C may have been partly due to differences in invert depths (0.40 versus 0.55 m); flow from the soil surface to gravels mole drains had a thinner soil matrix to traverse and may not have been as reliant on soil macropores.
Implications
Despite the deterioration in effectiveness over time, mole DF was maintained, albeit at a lower level, for latter events ( and ) and the drainage provided was adequate to control WT depth below that of the control. Mole drainage has always been considered a temporary measure, which must be repeated in order to maintain effectiveness (Mulqueen Citation1985). Given the low cost of mole drainage (€125–300 ha−1), it is reasonable that the mole drainage operation could be repeated every 2 years on this soil type. The cost of gravel mole drainage (€1500–2800 ha−1) does not allow for frequent repetition of the operation. Given the disparity between installation costs, it is likely that regularly rejuvenated (2 years) mole drains, while less effective than gravel mole drains, could provide adequate drainage on this site at a much lower long-term cost.
The capacity and lifespan of mole and gravel mole channels would be improved by the installation of a field drain network, excavated perpendicular to and deeper than the mole drains to act as an outfall (Castle et al. Citation1992; Mulqueen Citation1998). This would shorten the effective length of the mole channels and substantially increase drainage capacity, lessening both the chances of failure and the impact of isolated failures on the whole system if they occur. Future research could look at the optimum mole/gravel mole channel length in a range of soil types for such combined systems, having mole or gravel mole drainage as a supplementary measure to a field drain network. This would have significant cost implications, however, as such field drains cost approximately €5–7/m (Crosson et al. Citation2013). The impact of repeated installation on soil compaction also needs to be evaluated, particularly if installation has to occur in sub-optimum conditions.
Both mole and gravel mole drainage were found to be effective in the removal of excess water off site. Drain performance varied between treatments and between events, but general trends were evident: DF from gravel mole drainage installed in July 2011 had consistently higher peak flow rates and greater total flows than in other treatments. Therefore, gravel mole drainage was generally more effective than mole drainage in removing excess water. The installation of mole drainage in non-ideal conditions resulted in extensive surface damage during installation. This damage was directly linked to the timing of the operation and the associated soil moisture status. However, the performance of the drainage systems was not affected by the installation conditions. VMC at the soil surface was greater and the WT depth was consistently shallower in the undrained control plots than in drainage treatment plots.
Drainage treatments reached steady-state flow conditions approximately 1 year after installation following an initial period of high relative DF response. The temporal changes in flow response were due to both the wetter conditions prevailing during latter events, with resulting greater propensity for OF flow, and the reduced effectiveness of the disruption techniques in persistent wet weather due to the natural shrink/swell properties of the high clay content soil.
Acknowledgements
We acknowledge the technical assistance of D. Barrett and the staff at the Teagasc Solohead Research Farm. We thank Dr Mark Healy, NUI Galway, and Dr Matthew Helmers, Iowa State University, for early review of the manuscript.
Additional information
Funding
References
- Brereton AJ, Hope-Cawdery M. 1988. Drumlin soils: the depression of herbage yield by shallow water table depth. Irish J Agr Res. 27:167–178.
- Burke W. 1978. The physical basis of soil/water relationships. In: Land reclamation. Proceedings of the seminar; 1978 Oct 24–26; Ballinamore County, Leitrim. Dublin: An Foras Taluntais.
- Burke W, Mulqueen J, Butler P. 1974. Aspects of the hydrology of a gley on a Drumlin. Irish J Agr Res.13:215–229.
- Castle DA, Spoor G, Onasanya EO, Ormandy AK. 1992. Mole plough and soil factors influencing the hydraulic connection between mole channels and the permeable backfill placed over pipe drains. J Agr Eng Res. 51:217–235. 10.1016/0021-8634(92)80039-U
- Cavelaars JC, Vlotman WF, Spoor G. 1994. Subsurface drainage systems. In: Ritzema HP, editor. Drainage principles and applications. Wageningen: International Institute for Land Reclamation & Improvement; p. 827–929.
- Childs EC. 1943. Studies in mole-draining: interim report on an experimental drainage field. J Agr Sci. 33:136–146. 10.1017/S002185960000650X
- Collins JF, Larney FJ, Morgan MA. 2004. Climate and soil management. In: Keane T, Collins JF, editors. Climate, weather and Irish agriculture. Dublin: AGMET; p. 229–332.
- Crosson P, Shalloo L, Thorne F. 2013. The economics of land drainage. In: Moore M, Fenton O, Tuohy P, Ibrahim T, editors. Teagasc manual on drainage and soil management: a best practice manual for Ireland's farmers. Carlow (Ireland): Teagasc; p. 113–119.
- Department of Agriculture, Fisheries and Food. 2010. Food harvest 2020. A vision for Irish agri-food and fisheries. Available from: www.agriculture.gov.ie/media/migration/agrifoodindustry/foodharvest2020/2020FoodHarvestEng240810.pdf
- Ernst LF. 1956. Calculation of the steady flow of groundwater in vertical cross-sections. Neth J Agr Sci. 4:126–131.
- Galvin LF. 1982. Gravel mole drains are the most suitable system for many impermeable soils. Farm Food Res. 13:103–105.
- Galvin LF. 1983. The drainage of impermeable soils in high rainfall areas. Irish J Agr Res. 22:161–187.
- Galvin LF. 1985. Effective disruption is a major factor in the drainage of impermeable soils. In: van Wijk ALM, Wesseling J, editors. Proceedings of a symposium on agricultural water management; 1985 Jun 18–21; Arnhem. Rotterdam (The Netherlands): A.A. Balkema.
- Galvin LF. 1986. Aspects of land drainage development in Ireland in the last twenty-five years. In: Vos J, editor. Twenty-five years of drainage experience. Proceedings, symposium 25th international course on land drainage; 1986 Nov 24–28; Wageningen. Wageningen (The Netherlands): International Institute for Land Reclamation and Improvement.
- Gardiner MJ, Radford T. 1980. Soil associations of Ireland and their land use potential. Dublin: An Foras Taluntais.
- Godwin RJ, Spoor G, Leeds-Harrison P. 1981. An experimental investigation into the force mechanics and resulting soil disturbance of mole ploughs. J Agr Eng Res. 26:477–497. 10.1016/0021-8634(81)90081-0
- Goss MJ, Harris GL, Howse KR. 1983. Functioning of mole drains in a clay soil. Agr Water Manage. 6(1):27–30. 10.1016/0378-3774(83)90023-9
- Hallard M, Armstrong AC. 1992. Observations of water movement to and within mole drainage channels. J Agr Eng Res. 52:309–315. 10.1016/0021-8634(92)80069-5
- Ibrahim TG, Fenton O, Richards KG, Fealy RM, Healy MG. 2013. Loads and forms of nitrogen and phosphorus in overland flow and subsurface drainage on a marginal land site in south east Ireland. Biol Environ. 113:169–186.
- Jarvis NJ, Leeds-Harrison PB. 1987. Modelling water movement in drained clay soil. I. Description of the model, sample output and sensitivity analysis. J Soil Sci. 38:487–498. 10.1111/j.1365-2389.1987.tb02284.x
- Keane T, Sheridan T. 2004. Climate of Ireland. In: Keane T, Collins JF, editors. Climate, weather and Irish agriculture. Dublin: AGMET; p. 27–62.
- Kirkham D. 1958. Seepage of steady rainfall through soil into drains. Trans Amer Geophys Union. 39:892–908. 10.1029/TR039i005p00892
- Konert M, Vandenberghe J. 1997. Comparison of laser grain size analysis with pipette and sieve analysis: a solution for the underestimation of the clay fraction. Sedimentology. 44:523–535. 10.1046/j.1365-3091.1997.d01-38.x
- Kurz I, Coxon C, Tunney H, Ryan D. 2005. Effects of grassland management practices and environmental conditions on nutrient concentrations in overland flow. J Hydrol. 304:35–50. 10.1016/j.jhydrol.2004.07.022
- Mills G. 2000. Modelling the water budget of Ireland—evapotranspiration and soil moisture. Irish Geogr. 33(2):99–116. 10.1080/00750770009478586
- Mulqueen J. 1974. Drainage of Impeded soils. Dublin: An Foras Taluntias.
- Mulqueen J. 1985. The development of gravel mole drainage. J Agr Eng Res. 32(2):143–151. 10.1016/0021-8634(85)90074-5
- Mulqueen J. 1998. Depth, spacing and length of mole drains with applications to afforestation. Irish J Agr Food Res. 37:39–49.
- Mulqueen J, Hendriks R. 1986. The use of groundwater surveys in the diagnosis and solution of a drainage problem. Irish J Agr Res. 25:285–298.
- Necpalova M, Fenton O, Casey I, Humphreys J. 2012. N leaching to groundwater from dairy production involving grazing over the winter on a clay-loam soil. Sci Total Environ. 432:159–172. 10.1016/j.scitotenv.2012.05.091
- Nijland HJ, Croon FW, Ritzema HP. 2005. Subsurface drainage practices: guidelines for the implementation, operation and maintenance of subsurface pipe drainage systems, vol. 60. Wageningen (The Netherlands). International Institute for Land Reclamation & Improvement.
- Phelan P, Keogh B, Casey IA, Necpalova M, Humphreys J. 2013. The effects of treading by dairy cows on soil properties and herbage production for three white clover-based grazing systems on a clay loam soil. Grass Forage Sci. 68:548–563. 10.1111/gfs.12014
- Ritzema HP. 1994. Subsurface flow to drains. In: Ritzema HP, editor. Drainage principles and applications. Wageningen: International Institute for Land Reclamation & Improvement; p. 263–304.
- Robinson M, Mulqueen J, Burke W. 1987. On flows from a clay soil—seasonal changes and the effect of mole drainage. J Hydrol. 91:339–350. 10.1016/0022-1694(87)90210-1
- Ryan T. 1986. Agricultural drainage practices in Ireland. Environ Geol. 9:31–40.
- Rycroft DW, Thorburn AA. 1974. Water stability tests on clay soils in relation to mole draining. Soil Sci. 117:306–310. 10.1097/00010694-197405000-00011
- Saxton KE, Rawls WJ. 2006. Soil water characteristic estimates by texture and organic matter for hydrologic solutions. Soil Sci Soc Am J. 70:1569–1578. 10.2136/sssaj2005.0117
- Schulte RPO, Diamond J, Finkele K, Holden NM, Brereton AJ. 2005. Predicting the soil moisture conditions of Irish grasslands. Irish J Agr Food Res. 44:95–110.
- Shalloo L, Dillon P, O'Loughlin J, Rath M, Wallace M. 2004. Comparison of a pasture-based system of milk production on a high rainfall, heavy-clay soil with that on a lower rainfall, free-draining soil. Grass Forage Sci. 59:157–168.
- Smedema LK, Rycroft DW. 1983. Land drainage: planning and design of agricultural drainage systems. Ithaca (NY): Cornell University Press.
- Spoor G. 1982. Potential for mole drainage as drainage technique on heavy soils. In: Gardiner MJ, editor. Proceedings of a seminar on land drainage; 1981 July 27–31: Cambridge, UK. Rotterdam (The Netherlands): A.A. Balkema.
- Spoor G. 1985. Factors influencing mole drainage channel stability. In: van Wijk ALM, Wesseling J, editors. Agricultural water management: proceedings of a symposium on agricultural water management; 1985 Jun 18–21; Arnhem. Rotterdam (The Netherlands): A.A. Balkema.
- Spoor G, Leeds-Harrison PB, Godwin RJ. 1982a. Some fundamental aspects of the formation, stability and failure of mole drainage channels. J Soil Sci. 33:411–425. 10.1111/j.1365-2389.1982.tb01777.x
- Spoor G, Leeds-Harrison PB, Godwin RJ. 1982b. Potential role of soil density and clay mineralogy in assessing the suitability of soils for mole drainage. J Soil Sci. 33:427–441. 10.1111/j.1365-2389.1982.tb01778.x
- Toksöz S, Kirkham D. 1961. Graphical solution and interpretation of a new drain-spacing formula. J Geophys Res. 66:509–516.
- Toksöz S, Kirkham D. 1971a. Steady drainage of layered soils. 1. Theory. J Irr Drain Div-ASCE. 97:1–18.
- Toksöz S, Kirkham D. 1971b. Steady drainage of layered soils. 2. Nomographs. J Irr Drain Div-ASCE. 97:19–37.
- Vidon P, Cuadra PE. 2010. Impact of precipitation characteristics on soil hydrology in tile-drained landscapes. Hydrol Process. 24:1821–1833.
- Youngs EG. 1985. An analysis of the effect of the vertical fissuring in mole-drained soils on drain performances. Agr Water Manage. 9:301–311. 10.1016/0378-3774(85)90040-X