
Abstract
In poorly drained (PD) soils, fertilizer N containing NO3 is easily denitrified. To determine emissions of N2O-N from PD, imperfectly drained (ID) and moderately well drained (MD) mineral soils, soil moisture and groundwater levels were monitored, and gas samples were collected from closed gas chambers during two crop growing seasons (i.e. April to August 2011 and 2012) in the South East of Norway. The gas samples were analyzed for N2O-N flux using gas chromatograph. In 2011, the depth to groundwater table ranged between 1 and 40 cm in PD, 50 and 89 cm in ID and 74 and 96 cm in MD soils during the growing seasons. In 2012, the depths were 11–51 cm in PD, 55–81 cm in ID and 46–78 cm in MD soil. Daily mean water filled pore space (WFPS) ranged between 51% and 70% in PD, 44% and 62% in ID and 38% and 72% in MD soils in 2011 and in 2012, the WFPS felled within this range. During the growing season, N2O flux rate (µg N m−2 h−1) varied from 20 to 635 (6–878) in PD, 22 to 112 (11–1607) in ID and 4 to 33 (8–92) in MD soils in 2011–2012 (mean of five chambers). Peak N2O-N fluxes in PD and ID soils were detected one week after fertilizer applications and immediately after rain events. Cumulative N2O-N emissions (kg N ha−1) from PD (6–10), from ID (4–12) and from MD soils (0.2–0.9) were emitted during (2011–2012) growing season. In general, PD soils emitted more N2O-N compared to MD soils mainly due to higher soil moisture and relatively shallow ground water table.
Introduction
Poorly drained (PD) and imperfectly drained (ID) soils can potentially have large amounts of applied fertilizer N lost through denitrification which can be one of the major contributors to soil N2O-N emissions (Nash et al. Citation2012). Poor drainage conditions contribute to denitrification and subsequent emissions of N2O-N from agricultural soils (Granli & Bøckman Citation1994). In Norway, at least 10% (i.e. 100,000 ha) of the total agricultural lands have inadequate drainage (SSB Citation2010). It is estimated that Norwegian agriculture is responsible for about 70% of N2O-N national emissions (SLF Citation2013). To improve the drainage conditions of agricultural soils and increase crop production, subsurface tile drainage systems were installed in many agricultural lands of Norway in the early 1900s. At present, about 60% of Norwegian agricultural land is equipped with artificial drainage systems. However, the maintenance of these drainage systems were not given due attention (Njøs Citation2005).
If climate change leads to wetter and warmer climate in Norway as many models predict (Hanssen-Bauer et al. Citation2009), the effects of poor drainage on N2O-N emissions and crop growth will exacerbate even more. Higher N2O-N emissions are usually measured at high soil water filled pore space (WFPS; Davidson et al. Citation2000; Dobbie & Smith Citation2003). Thus, the need for improved drainage is vital from the crop production point of view and climate change effects on soil N2O-N emissions. Installation of appropriate drainage systems to prevent shallow water tables may be one option to reduce N2O-N emissions from mineral agricultural soils (Brady & Weil Citation2002; Dobbie & Smith Citation2006; Setiawan et al. Citation2013). Furthermore, keeping the soils saturated for longer periods (outside the growing season) may actually lower N2O-N emissions with conditions favouring the complete transformation of to N2 gas through denitrification (Bateman & Baggs Citation2005; Hernandez & Mitsch Citation2006; Nash et al. Citation2012) in mineral soils. A high soil moisture content under controlled drainage system increases the potential for denitrification and the residence time of N2O in the soil, thereby providing greater opportunity for its reduction to N2 (Kliewer & Gilliam Citation1995; McDowell et al. Citation2012).
Increased emission of N2O-N from peat land cultivation in Northern Norway was detected during and after a dry period followed by an increase NO3-N concentrations in the soilwater and groundwater (Kløve et al. Citation2010). This is because drainage of peat lands facilities nitrification and mineralisation of nitrogen by microbial activity and increased temperature, which enhances N2O-N emissions from the soil and NO3-N leaching.
Emissions of N2O-N generally increases with increasing N fertilization rates from arable agricultural mineral soils (Stehfest & Bouwman Citation2006) and from grassland soils (Hansen et al. Citation2014). Nevertheless, little information is available when it comes to emissions of N2O-N from mineral soils with different moisture and drainage conditions apart from a recent study made by Grossel et al. (Citation2014) who found that on average undrained loamy soils resulted in larger emissions (29 g N2O-N ha−1 d−1) than tile-drained soils (3.6 g N2O-N ha−1 d−1) in central France. Here, we have hypothesized that soils from poorly and inadequately drained fertilized arable lands emit more N2O-N fluxes compared to soils from well-drained fertilized fields. To test our hypothesis, emissions of N2O-N from three soil drainage classes namely, PD, ID and moderately well drained (MD) mineral soils were determined.
Materials and methods
Site descriptions
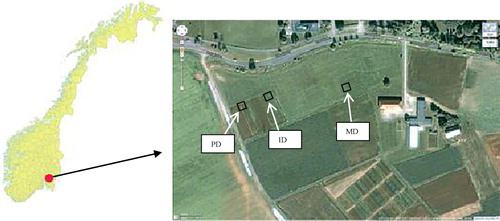
The study was carried out at the research field of the Norwegian University of Life Sciences (NMBU) in Ås, (59° 40΄N, 10° 47΄E, 75 m above sea level; ) during the growing season (from 1 April to 31 August) in 2011 and 2012. Rainfall, air and soil temperatures (at 10 cm depth) data were acquired from a nearby weather station located at NMBU campus in Ås (Grimenes & Hansen Citation2011, Citation2012). The long-term mean annual rainfall at Ås is 785 mm with 50–60% falling during the growing season. Mean long-term annual air temperature is +5.5°C, which varies from −2.4°C in winter to +16.5°C during summer. Mean air temperature in the growing season is +13.3°C.
The study site is characterized by relatively flat landscape with lower depressions of a closed creek where PD soils are nearby located. The difference in elevation between PD and ID is around 0.2 m, and between PD and MD is about 1.0 m. Selected properties of the soils at the site are presented in . The parent material of the soil is post-glacial marine clay in the deeper layers and in the upper layer, a mixture of transported and re-sedimented post-glacial clay and somewhat outwash from adjacent moraine hills (Njøs Citation1978). The soil texture in the topsoil is a silty clay loam. The top soils are characterized with near neutral pH and rich in plant nutrients except K and Mg, which are relatively low. The soils are classified as stagnic Albeluvisols according to World Reference Base for soil resources (FAO Citation2006) correlated to typic endoaqualf (USDA Citation2003). The soils in three plots were artificially tile drained at 7 m spacing and 0.7–0.8 m drainage depth in the 1970s (Njøs Citation1978). Most recently, it was found that the outlets of the plastic tile drains in PD and ID plots were partly dysfunctional but not the tile drains in MD plot.
Table 1. Some physico-chemical properties of the soils (0–100 cm depth) at the study site.
To examine the effect of soil drainage conditions on emissions of N2O, three adjacent fields receiving the same agronomic management practices and having similar climatic conditions but with different drainage status were selected. The fields were located in the lower (PD), middle (ID) and upper (MD) position of the study site (). The size of PD and ID plots were 2 m × 5.4 m each and MD plot was 2 m × 6.4 m. In addition to micro topographic variations, water tables depth were also used to define PD (0–40 cm), ID (40–60 cm) and MD (>60 cm) soils.
The study fields were spring ploughed and sown with oats on 6 May 2011 and with barley on 19 May 2012. Nitrogen fertilizers were applied as ammonium nitrate (NH4NO3) (in compound fertilizer from YARA Norge A/S) at a rate of 105 kg N ha−1, a rate equivalent to that applied by the local farmers (Øgaard Citation2013). The fertilizers were applied to the soils at the same time with sowing in the first week of May 2011 and third week of May 2012.
Groundwater table and soil measurements
To monitor the groundwater table in the three soil drainage fields, one porous plastic pipe (Ø 17 mm) made of PVC were installed at 100 cm depth per plot. The pipes were placed 50 cm equidistant from the gas chambers of PD, ID and MD fields. The groundwater depth was measured using a measuring tape connected to a probe that emits a clear acoustic and light signal when it touches a water level (SEBA Hydrometrie GmbH & Co. KG, Germany). The measurement was done at the same date when gas sampling was undertaken. Continuous soil moisture at a depth of 10 cm was also monitored in situ by installing Em50 data logger series (10HS sensor Decagon Devices, Inc. USA) in PD, ID and MD fields. One composite soil sample from the top 10-cm layer was collected at each sampling date by taking five soil subsamples nearby the chambers in the PD, ID and MD plots. The dates were 24 May 2011, 13 April 2012 (two weeks after sowing and fertilizer application), 13 July 2011, 2 July 2012 (when full ground cover was achieved), 2 September 2011 and 3 September 2012 (one week before harvest). Soil mineral N (,
) was extracted using 2M KCl (1:2.5 field moist soil: KCl). Extracts were stored at −20°C until analysis by automated colorimetry (Model QuickChem 8000 FIA+, Lachat Instruments Ltd, Loveland, CO, USA).
In addition, undisturbed soil cores were taken from the topsoil in the PD, ID and MD fields at the same dates we did sampling for soil mineral-N. The soils were dried for 24 hours at 105oC to determine bulk density and gravimetric water content. Bulk density was measured from the oven-dried weight of the soil and the volume of the core samples. The total pore space (TPS) was calculated from the equation:
Where ρb is soil bulk density (g cm−3) and ρp is soil particle density (2.65 g cm−3 for typical mineral soil). The proportion of WFPS was subsequently calculated from the TPS and volumetric soil water content (measured using 10HS Decagon devices) as follows:
N2O gas sampling and analysis
The closed chamber technique (e.g. Rochette & Eriksen-Hamel Citation2008) was used to measure direct N2O-N fluxes from PD, ID and MD soils. There were five replicates chambers in each field, inserted 10 cm into soils. The chambers had a dimension of 55 cm × 55 cm × 20 cm high. The chambers were removed during sowing and soil tillage and reinstalled shortly after the operation. Sampling was usually performed every two weeks throughout the study period and was generally conducted in the morning hours between 9:00 and 12:00 to prevent effects of diurnal variation (Velthof & Oenema Citation1995). Sampling dates are shown in and .
Four gas samples were withdrawn from each chamber headspace at 10 minutes interval (0, 10, 20 and 30 minutes) immediately after closure from a surface area of 0.262 m2. The gas samples were taken from the tubes fitted with knobs using plastic syringes (0.02 dm3) that are fitted to needle after pugging air in and out of the syringe, a couple of times before sampling in order to mix the chamber air. The samples were then transferred to butyl rubber stopper of pre-evacuated glass vials (Model 10-CV-Crimp, Chromacol, Herts, UK ~0.01 dm3). The gas samples of 2011 and 2012 were analyzed for N2O-N concentrations at the NMBU laboratory and Bioforsk laboratory, respectively at Ås-Norway using a gas chromatograph (Model 7890A, Agilent, Santa Clara, CA, US). In total, gas samplings were conducted on 13 events between 8 April and 2 September 2011 and 10 events between 13 April and 27 August 2012. Measurements stopped after crop harvest until the following growing season started, and no measurements and/or sampling were undertaken when snow covered the experimental fields.
Yield and yield attributes
The grain and straw yields in PD and ID fields were harvested from 11 m2 plot and from 13 m2 in the case of MD field. There was only one replicate per plot. Grain and straw yields were calculated on a per hectare basis. N2O-N emissions per kg grain harvested and per kg N fertilizer applied were estimated taking the cumulative N2O-N emissions from MD, ID and PD plots.
Calculation of N2O-N flux and statistical analysis
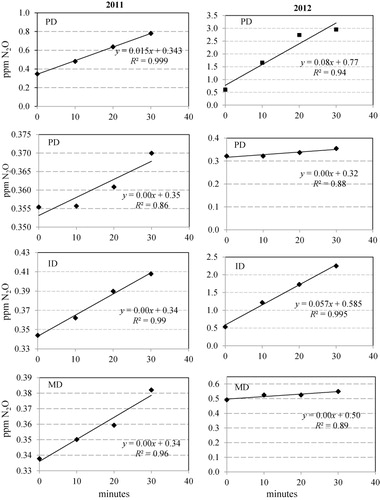
Flux calculations were based on the assumption that there was a linear increase in N2O-N concentration with time in the closed chambers from sampling time 0–30 minutes (Rochette & Hutchinson Citation2005). The change in N2O concentrations per unit time were estimated from the slope of the line obtained by plotting the N2O concentration in the headspace of the chamber versus the sampling time as presented below:
Where is the N2O flux (µg N2O-N m−2 h−1),
(ppm N2O min−1) is the rate of change in gas concentration in the chamber headspace, Vc is the chamber volume (L), A is the surface area covered by the chamber (m2), Mm is the molecular mass of N in N2O (28 g N mol−1) and Vm is the molecular volume of the gas at the mean temperature during chamber deployment (L mol−1).
N2O-N flux for each replicate chamber (in PD, ID and MD plots) was computed only if the linear correlation (r2) between N2O concentration in the gas sample and sampling time (0, 10, 20 and 30 minutes) was greater than 0.8, if not the outliers were removed from the data set (see examples in ). Statistical differences among N2O-N flux rates in the three soil drainage plots were analyzed using Minitab 16 (Minitab Inc., State College, PA, USA) in one way ANOVA. Cumulative N2O-N emissions (kg N2O-N ha−1 season−1) were estimated for PD, ID and MD plots as a mean of the cumulative fluxes of the five replicate chambers within each plot multiplied by the number of days between two adjacent sampling occasions. We assumed average flux between two measurement dates to estimate cumulative flux as it is commonly done (e.g. Nadeem et al. Citation2012). Because of the long time (14 days) between the measurements, we could have lost peaks of N2O flux, or we could have assumed too high mean values. To reduce the risk for too high mean values, the time between the last sampling before the fertilization and at the time of fertilization was not incorporated in the estimates of cumulated fluxes.
Results and discussion
Weather conditions: rainfall and temperature
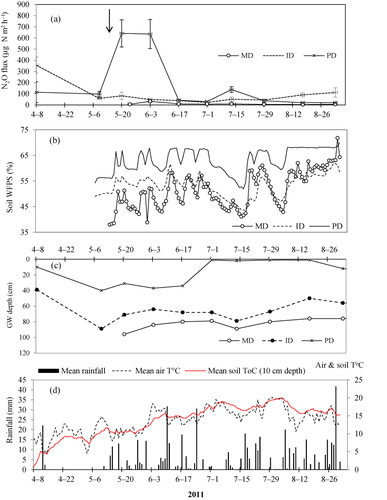
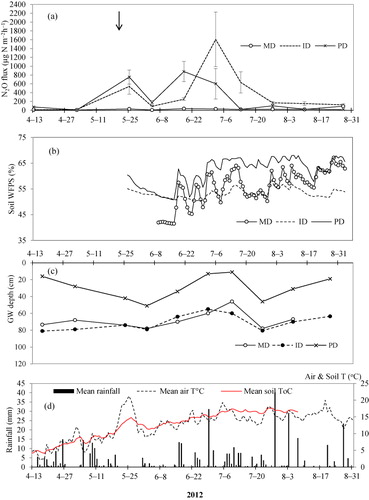
The monthly rainfall from April through August in 2011 as well as 2012 was higher than the 30 years means of 1960–1991 (data not shown). The highest amount of monthly rainfall (~190 mm) was recorded in August 2011 and the lowest rainfall (~36 mm) in April 2011. The cumulative rainfall (from April to August) was 544 mm in 2011 and 453 mm in 2012, which both were higher than the long term cumulative (331 mm). In general, the rainfall conditions during the growing season of 2011 is characterized as wet, while the growing season of 2012 was drier than 2011. Daily mean air and soil temperatures during the growing seasons of April through August in 2011 and 2012 were highly variable ( and ). During this period, the mean temperatures varied between +2.4 and +20.2°C in 2011. Whilst in 2012, daily mean air temperature ranged between +0.2 and +21.2°C. The monthly mean air temperatures during the growing seasons of 2011 (+8.3 to +16.9°C) were often higher than the 30 years monthly means of 1960–1991 (+4.1 to +16.1°C) according to the report by Grimenes and Hansen (Citation2011). The mean monthly soil temperature at 10 cm depth varied between +5.2°C in April and +16.9°C in August 2011 and +4.3°C in April and +16.7°C in July 2012. Soil temperature data for August 2012 was not available. The daily pattern of soil temperature variations resembles that of air temperature variations during the growing seasons of 2011 and 2012 ( and ).
Groundwater table and soil WFPS
The depth to water table (cm) varied among the PD, ID and MD plots and in both years 2011 and 2012 ( and ). In 2011, the depth to groundwater table ranged between 1 and 40 cm in PD, 50 and 89 cm in ID and 74 and 96 cm in MD soils during the growing seasons. In 2012, the depths were 11–51 cm in PD, 55–81 cm in ID and 46–78 cm in MD soil. The highest WFPS was observed in the PD plots when the groundwater level was near the surface (i.e. 1 cm in 2011 and 11 cm in 2012) as shown in and . Mean WFPS in PD soils were greater than ID and MD soils throughout the growing season of 2011–2012 (). Mean WFPS among MD, ID and PD soils were significant different (at p < 0.05) in 2011 as well as in 2012 growing seasons.
Table 2. WFPS of topsoil in the three drainage plots in 2011 and 2012.
Table 3.  and contents in the topsoil (0–10cm depth) of moderately well drained (MD), imperfectly drained (ID) and poorly drained (PD) dried soils at three occasions in 2011 and 2012.
Mineral nitrogen content in top soil
gives and
contents in soil at the upper 10 cm of MD, ID and PD plots at three occasions in 2011 and 2012, respectively. In the end of May 2011, the soil
contents in MD, ID and PD plots were 18, 31 and 13 mg N kg−1 dry soil, respectively, which could be classified as medium to high nitrates according to the ratings by Marx et al. (Citation1999). But in July and September, the
N contents in MD, ID and PD plots were all lower by about 5–15 times (). Likewise, the soil
contents in MD, ID and PD plot were medium to high after fertilization (measured 24 May), but towards the harvesting time, the ammonium levels decreased in ID plots ().
The soil N contents in MD, ID and PD fields varied between 0.6 and 9.9 mg N kg−1 dry soil throughout the growing season of 2012, which all were low compared to 2011. However, the soil
contents were initially high (19 mg N kg−1 dry soil in MD, 25 mg N kg−1 in ID and 28 mg N kg−1 in PD fields) but later decline. Exception to this was on 2 July 2012 when sampled soils from the ID field measured peak
(41 mg N kg−1).
Soil N2O-N fluxes
In 2011, the highest N2O-N flux rates (641 ± 121 µg N m−2 h−1, n = 5) was emitted from PD soils one week after fertilization, and lowest flux (20 ± 6.8 µg N m−2 h−1, n = 5) one week before crop harvest (). In ID soils, mean flux rates ranged from 22 ± 1.2 to 356 ± 72 and in MD soils varied between 4 ± 0.5 and 33 ± 6.8 µg N m−2 h−1 in 2011. When comparing the N2O-N fluxes among MD, ID and PD soils on each sampling day, the fluxes were higher from PD soils in 50% of the sampling occasions (). In 2012, PD soil N2O-N fluxes varied in the range of 6 ± 2.8–878 ± 229 µg N m−2 h−1 (). N2O-N emissions from the PD soils peaked three weeks after fertilizer application, and after the first rains ().
The rainfall events and temperatures conditions appeared to be partly responsible for peaks N2O-N emission from PD and ID plots ( and ). Distinct N2O-N peaks were measured in the impeded drained soils (i.e. PD and ID) when the first rains were recorded and when air and soil temperatures rise to 10°C and above in 2011 and 2012. The wet spring in 2011 and 2012 as well as wet summer months of 2011 have contributed to increased emissions of soil N2O-N from PD and ID soils. In similar site, Nadeem et al. (Citation2012) has also measured highest N2O-N emission during 2009 summer that was characterized as warmer and wetter than normal.
The N2O flux from PD soil was higher than from ID and MD soil. This was most pronounced shortly after fertilization in 2011, but also in 2012, the peak of N2O-fluxes after fertilization was largest in PD treatments. The higher N2O-N emissions registered in PD soil compared with ID and MD soils is most likely attributed to the high water content, and short distance to water table. The peaks in N2O-N fluxes shown in () and () from PD plots did match with high soil WFPS values recorded in the PD soils. The largest peak of N2O-N in PD plot were observed when the GW table was in the range of 30–40 cm below the soil surface and when mean WFPS was between 60% and 70% in 2011 (). Our findings agree with Granli and Bøckman (Citation1994) and Bateman and Baggs (Citation2005) who have reported that highest N2O-N emissions from mineral soils are often observed at 60–70% WFPS. Under such conditions, the available ions are denitrified to NO and N2O, but the denitrification potential was not high enough for a complete denitrifcation to N2. Complete denitrification of
ions to N2 often occurs when the WFPS are ≤80% in mineral soils (Granli & Bøckman Citation1994) and at very shallow GW levels. At very shallow GW levels (1 cm below the soil surface in 2011), N2O-N emissions from PD soils decreased substantially below 50 µg N m−2 h−1 towards the end of growing season () due to the conversion of N2O into N2 and reduced mineralization that has resulted to low content of
-N in the soils ().
In general, the N2O flux from ID soil was lower than PD soils, but higher than MD soil. The N2O-flux peak on 2 July 2012 in ID soil is probably not related to the ground water table and/or the soil moisture content because the values (on this particular date) were similar with MD soils. The high N2O peak from ID soil at this date is likely attributed to the high content of mineral-N in the soil (). In the case of MD soils, flux ranged between 7.6 ± 1.9 and 92 ± 13.6 µg N m−2 h−1. All fluxes from MD soil were below 50 µg N2O-N m−2 h−1 except the sample on 27 August 2012 that emitted 92 µg N m−2 h−1 (). One of the reasons for low emissions in MD plot (<50 µg N2O-N m−2 h−1) could be the deeper ground water table (≥40 cm) which improves the aeration of the uppermost soil horizons in MD. Under such conditions, the extent of anaerobic zones is reduced and denitrification is unlikely to occur (Dobbie & Smith Citation2006). The analysis of variance among MD, ID and PD soils also showed statistically significant difference at p < 0.05 for mean N2O-N fluxes measured in 2011 and 2012 growing season ().
Table 4. ANOVA table for N2O fluxes among poorly drained (PD), imperfectly drained (ID) and moderately well drained (MD) plots for mean of 2011 and 2012.
Cumulative N2O-N emissions
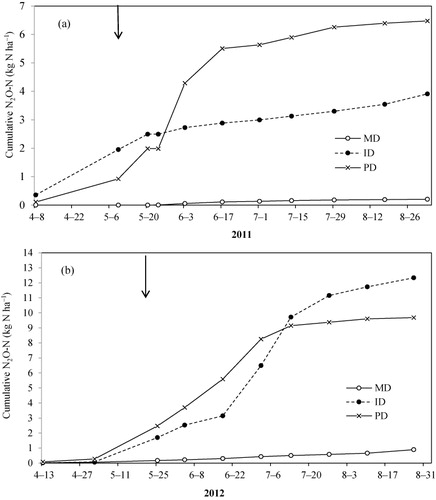
The cumulative N2O-N emissions from PD soil (6 kg N ha−1) were much higher than ID (4 kg N ha−1) and MD (0.2 kg N ha−1) in 2011 (). In 2012, the cumulative N2O-N emissions from PD soil were higher than the ID soil until early July, but were lower towards the end of the growing season. On the other hand, cumulative N2O-N emissions from MD soil (0.9 kg N ha−1) were much lower than PD and ID soils in both years (10 and 12 kg N ha−1, p < 0.05). The low cumulative N2O-N emission (0.2–0.9 N2O-N kg ha−1) registered from MD soils throughout the growing seasons of 2011 and 2012 () is probably due to good drainage conditions of the soils and having deeper ground water table when compared to PD and ID soils. This has promoted effective utilization of the available soil and
ions by the growing crops.
Yield and N2O-N emission intensities
The rainfall conditions has negatively affected the crop yields due to very wet soils coupled with poor soil drainage conditions in PD and ID plots. In 2011, the growth of the oats at PD and ID plots were so poor that no grain yield was harvested, whereas, about 5800 kg grain dry matter (DM) ha−1 and 2880 kg straw DM ha−1 were harvested from MD plot. In 2012, the grain yields from ID and PD were lower by almost 8% and 28%, respectively compared to the yield from MD plot (). As shown in , the estimated g N2O-N emissions from MD plot per kg grain yield (0.04 and 0.20 in 2011) and per kg N applied (2.0 and 8.5 in 2012) was much smaller than ID and PD plots. In 2012, the N2O-N emissions per kg of N applied increased in all plots when compared to 2011. The N2O-N emissions per kg of N applied in ID and PD plots were higher than the IPCC default factor i.e. 1% emissions of applied N fertilizer (IPCC Citation2006), whereas emissions from MD plots were lower ().
Table 5. Grain and straw DM yields of spring oats and barley at plots with poorly drained (PD), imperfectly drained (ID) and moderately well drained (MD), and cumulated N2O emissions during growing season.
N2O-N emissions from soils demonstrate very large temporal and spatial variations. However, due to lack of resources and time, the present study has been carried out in selective agro-ecological zone of SE Norway with limited measurements and only during the crop growing seasons. It is noteworthy to mention here that the information on estimates of cumulative N2O emissions from MD, ID and PD plots, should be used with caution because of the long time between the measurements, as estimates of cumulative N2O emissions from agricultural soils have large uncertainties. Nonetheless, considering the dearth of information and data shortage regarding N2O-N emissions from mineral soils under different drainage conditions, the findings of this study will provide a baseline information for further field studies on the effect of drainage conditions.
Acknowledgements
The authors would like to thank the Norwegian Agricultural Authority and the Norwegian Foundations for soil and peat research for financial support. Further, we would like to thank the NMBU at Ås for allowing us to use their fields to carry out the research. We thank Dr Peter Dörsch and Mr Trygve Fredriksen for their technical assistance and guidance, and Dr Hanna Silvennoinen for analyzing the N2O samples. We extend our grateful acknowledgements to Professor Trond Børresen and Mr Adam O'Toole for providing crop yield data. Thanks also to the anonymous reviewers for helpful comments on the earlier version of the manuscript.
Disclosure statement
No potential conflict of interest was reported by the authors.
References
- Bateman EJ, Baggs EM. 2005. Contributions of nitrification and denitrification to N2O emissions from soils at different water-filled pore space. Biol Fertil Soils. 41:379–388. 10.1007/s00374-005-0858-3
- Brady NC, Weil RR. 2002. The nature and properties of soils. 13th ed. Upper Saddle River (NJ): Prentice Hall.
- Davidson EA, Keller M, Erickson HE, Verchot LV, Veldkamp E. 2000. Testing a conceptual model of soil emissions of nitrous and nitric oxides. Bioscience. 50:667–680. 10.1641/0006-3568(2000)050[0667:TACMOS]2.0.CO;2
- Dobbie KE, Smith KA. 2003. Nitrous oxide emission factors for agricultural soils in Great Britain: the impact of soil water-filled pore space and other controlling variables. Glob Change Biol. 9:204–218. 10.1046/j.1365-2486.2003.00563.x
- Dobbie KE, Smith KA. 2006. The effect of water table depth on emissions of N2O from a grassland soil. Soil Use Manage. 22:22–28. 10.1111/j.1475-2743.2006.00002.x
- FAO. 2006. World reference base for soil resources 2006: a framework for international classification, correlation and communication. World soil resources reports no. 103. Rome: FAO.
- Granli T, Bøckman OC. 1994. Nitrous oxide from agriculture. Norwegian J Agric Sci. Suppl. 12:7–128 and 57–58.
- Grimenes AA, Hansen TV. 2011. Meteorological data for Ås 2011. Ås: Institute of Mathematics and Technology. University of Life Sciences. ISBN: 978-82-7636-025-7. Norwegian.
- Grimenes AA, Hansen TV. 2012. Meteorological data for Ås 2012. Ås: Institute of Mathematics and Technology, University of Life Sciences. ISBN: 978-82-7636-026-4. Norwegian.
- Grossel A, Nicoullaud B, Rochette P, Guimbaud C, Chartier M, Hénault C. 2014. Nitrous oxide emissions from drained and undrained loamy soils in Central France. Geophys Res Cent Abstr. 16:11549.
- Hansen S, Bernard M-E, Rochette P, Whalen JK, Dörsch P. 2014. Nitrous oxide emissions from a fertile grassland in Western Norway following the application of inorganic and organic fertilizers. Nutr Cycl Agroecosyst. 98:71–85. 10.1007/s10705-014-9597-x
- Hanssen-Bauer I, Drange H, Førland EJ, Roald LA, Børsheim KY, Hisdal H, Lawrence D, Nesje A, Sandven S, Sorteberg A, et al. 2009. Climate of Norway 2100: background material to NOU climate adaptation. Oslo: Norwegian Climate Centre; p. 148. Norwegian.
- Hernandez ME, Mitsch WJ. 2006. Influence of hydrologic pulses, flooding frequency, and vegetation on nitrous oxide emissions from created riparian marshes. Wetlands. 6:862–877.
- IPCC. 2006. Guidelines for National Green House Gas Inventories, Vol. 4, Chapter 11: N2O emissions from managed soils and CO2 emissions from lime and urea application. Hayama: Institute for Global Environmental Strategies (IGES); p. 54.
- Kliewer B, Gilliam JW. 1995. Water management effects on denitrification and nitrous oxide evolution. Soil Sci Soc Am J. 59:1694–1701.
- Kløve B, Sveistrup TE, Hauge A. 2010. Leaching of nutrients and emission of greenhouse gases from peatland cultivation at Bodin, Northern Norway. Geoderma. 154:219–232.
- Marx ES, Hart J, Stevens RG. 1999. Soil test interpretation guide. Corvallis (OR): Oregon state university.
- McDowell RW, Gongol C, Woodward B 2012. Potential for controlled drainage to decrease nitrogen and phosphorus losses to Waituna Lagoon. Environment Southland. New-Zealand: AgResearch Ltd; p. 1–16.
- Nadeem S, Hansen S, Bleken AM, Dörsch P. 2012. N2O emission from organic barley cultivation as affected by green manure management. Biogeosciences. 9:2747–2759. 10.5194/bg-9-2747-2012
- Nash PR, Motavalli PP, Nelson KA. 2012. Nitrous oxide emissions from clay pan soils due to nitrogen fertilizer source and tillage/fertilizer placement practices. Soil Sci Soc Am J. 76:983–993. 10.2136/sssaj2011.0296
- Njøs A. 1978. Effects of tractor traffic and liming on yields and soil physical properties of a silty clay loam soil. Norwegian Agric Sch. 57:1–26. Norwegian.
- Njøs A. 2005. Nydyrking og grunnforbedring i Norge: noen tall for belysning av utviklingen [Cultivation of new land and land improvement in Norway: some numbers to show the development]. Jordforsk rapport nr. 94. Ås: Norwegian Agricultural School; p. 44. Norwegian.
- Øgaard AF. 2013. Nitrogen use efficiency in cereal production. In: Bechmann M, Deelstra J, editors. Agriculture and environment – long term monitoring in Norway. Trondheim: Akademika; p. 55–68.
- Rochette P, Eriksen-Hamel NS. 2008. Chamber measurements of soil nitrous oxide flux: are absolute values reliable? Soil Sci Soc Am J. 72:331–342.
- Rochette P, Hutchinson GL. 2005. Measuring soil respiration in situ: chamber techniques. Publications from USDA-ARS/UNL Faculty Paper 1379. Lincoln (NE): Univeristy of Nebraska; p. 247–286.
- Setiawan BI, Irmansyah A, Arif C, Watanabe T, Mizoguchi M, Kato H. 2013. Effects of groundwater level on CH4 and N2O emissions under SRI paddy management in Indonesia. Taiwan Water Conserv. 61:135–146.
- SLF. 2013. State of the environment in agriculture for 2012: thematic assessment of the environmental status and environmental development in agriculture. The Norwegian Agricultural Authority report no. 5/2013. Oslo: Norwegian Agricultural Authority; p. 49. Norwegian.
- SSB. 2010. Agricultural census. [ cited 2012 Oct 19] Available from: http://www.ssb.no/10/04/10/landt/arkiv/art-2010-12-15-01.html
- Stehfest E, Bouwman L. 2006. N2O and NO emission from agricultural fields and soils under natural vegetation: summarizing available measurement data and modelling of global annual emissions. Nutr Cycl Agroecosys. 74:207–228. 10.1007/s10705-006-9000-7
- USDA. 2003. Keys to soil taxonomy. 9th ed. Washington (DC): United States Department of Agriculture and Natural Resources Conservation Service.
- Velthof GL, Oenema O. 1995. Nitrous oxide fluxes from grassland in the Netherlands: I. Statistical analysis of flux-chamber measurements. Eur J Soil Sci. 46:533–540. 10.1111/j.1365-2389.1995.tb01349.x