
Abstract
The aim of this study was to investigate influences of six-year past application rates of nitrogen and a catch crop, sweet corn (Zea mays L. ssp. Saccharata Sturt), on soil microbial community and diversity in a greenhouse-based intensive vegetable soil in eastern China. Soil electrical conductivity, pH, mineral nitrogen, phospholipid fatty acids (PLFA) profiles and carbon source utilization patterns under five annually past nitrogen rates (0, 348, 522, 696 and 870 kg nitrogen ha−1) were evaluated after the establishment of sweet corn during 1–1.5-month fallow period over three-year tomato/cucumber/celery rotations. The past nitrogen application rates exerted significant effects on soil electrical conductivity, pH, nitrate-nitrogen, ammonium-nitrogen and carbon source utilization patterns, but not on PLFAs profiles. The sweet corn had a significant effect on soil chemical properties, total and actinobacterial PLFAs, but not on carbon source utilization patterns. Soil electrical conductivity, nitrate-nitrogen and the total PLFAs decreased whilst soil organic carbon, pH and the actinobacterial PLFAs increased after the establishment of sweet corn. Soil microbial functional diversity from carbon source utilization patterns and actinobacterial PLFAs were greatest after the establishment of sweet corn at a 60% of the conventional nitrogen rate (i.e. 522 kg nitrogen ha−1). Soil electrical conductivity and ammonium-nitrogen were two key factors to determine carbon source utilization patterns, whilst soil pH was the key factor to determine PLFAs profiles. A combination of the catch crop sweet corn during summer fallow and a 60% of the conventional nitrogen rate is a sustainable pathway of utilizing greenhouse-based intensive vegetable soils in eastern China.
Introduction
Land-use change and intensive agriculture are directly related to food security, water and soil quality, soil organic matter and carbon sequestration, and biodiversity and ecosystem services. The Yangtze River Delta in eastern China, covering a total of 3.6 million hectares of agricultural lands, has been the most intensive rice with wheat (Tritucum aestivum L.) or rape (Brassica napus L.) cropping system for several centuries. Recently, to meet its ever-increasing vegetable demanding over 10% of these traditional croplands have been changed into polythene tunnel or “polytunnel” greenhouse vegetable lands or soils, which are annually able to have three or four harvests of more profitable vegetables per year than the traditional rotation of rice–wheat (or rape). The conversion of traditional rice/wheat (or rape) rotation lands or open field vegetable lands to greenhouse-based intensive vegetable lands has resulted in a decrease in soil microbial diversity (Shen et al. Citation2008). Moreover, high N application rate up to 570−948 kg N ha−1 two crops y−1 in such polytunnel greenhouse vegetable soils has resulted in lower N use efficiency, leaching to the groundwater, and soil secondary salinization and acidification (Shi et al. Citation2009; Shen et al. Citation2010; Min et al. Citation2011b).
A number of agricultural practices have been attempted to sustain soil quality and productivity in greenhouse-based intensive vegetable systems in China such as the improvement of N management or cultivation of catch crop (Guo et al. Citation2008; Min et al. Citation2011a, Citation2011b; Tian et al. Citation2011). We have shown that the conventional N rate of 570 kg N ha−1 two crops y−1 decreased soil enzyme activities, nitrification capacity and microbial functional diversity including the population and diversity of ammonia-oxidizing bacteria, and proposed a 60% of the N rate (342 kg N ha−1 two crops y−1) was practical to decrease excess N inputs while maintaining the sustainability of greenhouse-based intensive vegetable systems in this Yangtze River Delta area, eastern China (Shen et al. Citation2010, Citation2011; Min et al. Citation2011a, Citation2011b). To further our study, we recognized that the polyethylene greenhouse in eastern China is usually uncovered after the spring vegetable harvest coupling with the largest amounts of precipitation in summer, and the soil lies fallow during this period until the establishment of autumn vegetables. However, little is known about the effects of past N application rates on soil microbial community and diversity during this fallow period, particularly if the introduction of a catch crop into such an intensive vegetable production system could alter the soil microbial activities.
The catch crop has potentials to reduce leaching, improve microbial properties and enhance crop yields (Constantin et al. Citation2010; Tian et al. Citation2011; Doltra & Olesen Citation2013; Janusauskaite et al. Citation2013). Sweet corn (Zea mays L. ssp. saccharata Sturt) has been an effective catch crop in the above-mentioned greenhouse-based intensive vegetable systems to increase soil nutrient utilization and to decrease losses and/or accumulations of N and phosphorus (P) in soils (Guo et al. Citation2008; Min et al. Citation2011a; Tian et al. Citation2011). For example, total N leaching loss was reduced by 12% under fallow plus a catch crop than minus a catch crop at the conventional 870 kg N ha−1 N rate (Min et al. Citation2011a). In addition, either by removal or incorporation of their residues into greenhouse-based intensive vegetable soils in northern China, the following cucumber yields were significantly increased after the coverage of sweet corn, but decreased after the coverage of common bean (Tian et al. Citation2011). As a result, studies on the individual or integrated effects of past N application rates and the establishment of a catch crop during summer fallow period on soil microbial community and diversity are further needed.
We therefore studied if soil chemical and microbial properties after a three-year tomato/cucumber/celery rotation had been changed by past application rates of N () and/or a growth of catch crop during the fallow period after the conversion of traditional lands to polytunnel greenhouse lands in the Yangtze River Delta, eastern China. Community-level physiological profiles (CLPP) are usually used to indicate microbial metabolic activity and functional diversity deduced from the C source utilization patterns (Campbell et al. Citation1997; Shen et al. Citation2008, Citation2010; Chaer et al. Citation2009). Phospholipid fatty acids (PLFA) are major membrane constituents of living cells, and thus good indicators to evaluate microbial community structures in agricultural soils (Zelles Citation1999; Kulmatiski & Beard Citation2011; Rousk et al. Citation2011; Börjesson et al. Citation2012; Gao et al. Citation2015). By employing a split-plot design with past application rates of N in the main plots and catch crop in the sub-plots, our objectives were to investigate the effects of past application rates of N and/or catch crop cultivation on (1) soil chemical properties, (2) microbial C source utilization patterns and (3) PLFA profiles. We then related these effects to better soil quality and sustainable use of such greenhouse-based intensive vegetable soils.
Table 1. Crop rotations and past annual N application rates of urea during 2008–2010 in the field plots.
Materials and methods
Field site
The field site is located in Yixing County (31°14′N, 119°53′E), Jiangsu, China, which has a subtropical monsoon climate. With around 240 frost-free days, the annual mean and accumulated temperature, and precipitation are 15.7 and 5418°C, and 1177 mm, respectively. The traditional open land use as a rice–wheat (or rape) rotation has been transformed to a polytunnel greenhouse covered tomato–cucumber rotation since 2001. The soil (Stagnic Anthrosol, Gong Citation1999; IUSS Working Group WRB Citation2006) in the polytunnel greenhouse was fertilized under the conventional N rate between 2001 and 2004, and then five N fertilization rates between 2005 and 2007 (). Prior to the experimentation in 2005, the soil at 0–20 cm depth had a pH (H2O) of 5.89, EC of 0.51 dS m−1, total N and organic C of 1.04 and 14.4 g kg−1, –N, Olsen-P and NH4OAc–K of 42.7, 61.4 and 56.2 mg kg−1.
Split-plot design
For the present experiment, cucumber (Cucumis sativus cv. Jinchun 4), tomato (Solanum lycopersicum cv. Jinpeng 1) and celery (Apium graveolens cv. Xiqin 5) were cultivated between 2008 and 2010 at twenty 7.0 m × 2.5 m plots in two 36 m × 12 m polytunnel greenhouses. The rotation schedule was tomato from April to June, cucumber from September to November and celery from December to next March. Five annual N fertilization rates or treatments (four replicates of each) were 100% (N870: 300, 270 or 300 kg N ha−1 for tomato, cucumber or celery, respectively), 80% (N696), 60% (N522), 40% (N348) and 0% (N0) of the conventional N rate (). The chemical N fertilizer was urea that was used as basal (50%) before transplanting and as supplementary (50%) fertilization during the flowering/fruit stage. Calcium-magnesium phosphate (120 kg ha−1 P2O5), potassium sulfate (150 kg ha−1 K2O) and commercial organic manure (made from composted chicken manure with composting period of 7–15 days, 29.4% moisture, total C and N of 261 and 20 g kg−1 fresh weight, –N and
–N of 527.4 and 174.9 mg kg−1 fresh weight, and pH (H2O) of 6.12) were equally used as basal fertilization for each plot before transplanting. In addition, each vegetable (tomato, cucumber or celery) growing season received 3900 kg ha−1 of commercial organic manure. Chemical fertilizers and organic manures were broadcasted evenly onto the soil surface by hand and incorporated into the soil through plough and irrigation.
To increase N use efficiency and/or reduce N leaching, a catch crop sweet corn (Z. mays L. ssp. saccharata Sturt) was grown on equally split half-size plots for 1–1.5 month from July to August between 2008 and 2010. The polytunnel greenhouses were then uncovered and no fertilization was employed. Meanwhile, other split half-size plots lay fallow.
Soil sampling
Eight bulk soil cores (3.3 cm diameter) at 0–20 cm depth were taken from each sub-plot as one composite sample after sweet corn harvesting on 26 August 2010, and four composite samples (replicates) were collected from each sub-treatment (sweet corn or fallow). Part of the fresh composite samples were then stored at 4°C within one week for microbiological and mineral N analyses. Other soils were air dried and sieved (<2 mm) for chemical analyses.
Soil chemical analysis
Soil EC was measured with an electrolytic conductivity meter (soil:water = 1:5), and pH with a glass electrode (soil:water = 1:2.5). Soil organic C was determined by the dichromate oxidation (Schumacher Citation2002). Soil N was extracted with 2 M KCl (soil:KCl = 1:4) for 1 h, and –N and
–N were then determined by a Skalar SANplus Segmented Flow Analyzer (Skalar Analytic B.V., De Breda, The Netherlands) according to the instrument manual. Olsen-P and NH4OAc-K were extracted with sodium bicarbonate and ammonium acetate, and then determined by the molybdenum-blue method and a flame photometry, respectively (Lu Citation2000).
Biolog analyses and calculation of indices of microbial diversity
CLPP of the bacterial communities in soils were estimated using the Biolog method (Campbell et al. Citation1997). Briefly, 10 g fresh soils were suspended in 100 ml 0.05 M sterilized phosphate buffer (pH 7.0) and shaken at 70 rpm for 30 min. One milliliter of soil suspension was used for serial 10-fold dilutions with the same sterilized phosphate buffer. To each well of the Biolog Eco Micro plate (Biolog, Hayward, CA, USA) was added 150 µl diluted soil solution and incubated at 25°C for a total of 168 h, and measured every 24 h by an Emax precision micro plate reader at 590 nm. The readings at 96 h incubation were collected by the Microlog Rel. 4.2 software (Biolog, Hayward, CA, USA) and calculated by the Microsoft Excel to obtain the average well color development (AWCD) and the functional diversity indices [Shannon index (H′ ), Simpson index (D) and McIntosh index (U)].
PLFAs analyses
PLFAs were extracted using a modified Bligh–Dyer technique (Brant et al. Citation2006). Briefly, three replicates of 2 g fresh soils were incubated in 15 ml methanol, chloroform and phosphate (2.0:1.0:0.8, 0.1 M potassium phosphate buffer with a pH of 7.0) buffer at 180 rpm for 2 h. The soil extracts were filtered and the chloroform phases were collected. Phospholipids were separated from glycolipids and neutral lipids using silicic acid-bonded solid-phase-extraction columns (Supelco, PA, USA). The separated phospholipids were then saponified and methylated to fatty acid methyl esters (FAME) for the analysis of individual PLFA using an Agilent 6850 Gas Chromatograph. Fatty acids were identified using the MIDI Sherlock Microbial Identification System (MIDI, Newark, DE, USA) according to the manufacturer's instructions. Peaks were identified based on the retention time with known standards. Concentration of each PLFA was obtained by comparing their peak area with a 19:0 FAME internal standard.
Fatty acid/PLFA nomenclature follows the form A:BωC, where A is the number of carbon atoms, B is the number of double bonds and C indicates the position of first double bond from methyl end of the molecule. The prefixes i and a refer to iso and ante-iso branching, cy refers to cyclopropyl groups, and 10me refers to a methyl group at the 10th carbon from the carboxyl end of the molecule. Total PLFA concentrations were used to indicate total microbial biomass of the soil (Budge et al. Citation2011). Diagnostic groups of fatty acids were used to calculate bacterial (15:0, a15:0, i15:0, 15:0 3OH, 15:1ω9, i16:0, 16:0 2OH, 16:1ω7, 16:1ω9, 16:1 2OH, a17:0, i17:0, cy17:0, 17:1ω7, 17:1ω8, 18:0 2OH and 18:1ω5), Gram-positive (G+, a15:0, i15:0, i16:0, 16:1ω7, a17:0 and i17:0), gram-negative (G−, 16:0 2OH, 16:1ω7c, 16:1ω9, cy17:0, 17:1ω7, 17:1ω8, 18:0 2OH and 18:1ω5), fungal (16:1ω5c, 18:1ω9c, 18:2ω6,9c and 18:3ω6,9c) and actinobacterial (10Me16:0, 10Me17:0 and 10Me18:0) PLFAs based on previously published PLFA biomarker data (Zelles Citation1999; Kulmatiski & Beard Citation2011; Gao et al. Citation2015). PLFA biomass was expressed in nanomoles of PLFA per gram dry weight soil.
Statistics
With the past application N rates as between-subjects (main) factor and catch crop as within-subject (split-plot) factor, statistical analyses were performed using the General Linear Model-Repeated Measures. Data (means ± SE, n = 4) were subjected to analysis of variance (ANOVA) to determine the significance of differences among past application rates of N by the Tukey post hoc test at p = .05 with the SPSS 16.0 for Windows (SPSS Inc, Chicago, USA). Paired-samples t test was employed to determine the differences between no catch crop and catch crop at p = .05.
The soil microbial community and diversity responding to environmental factors were assessed using the canonical correspondence analysis (CCA). The CCA analysis was performed for the statistical analyses of species data (individual fatty acids and sole carbon source) and the environmental data (EC, pH, organic C, –N and
–N) with the software CANOCO 4.5 (Microcomputer Power, Ithaca, NY, USA). A Monte Carlo permutation test was carried out on 499 random permutations.
Results
Soil chemical properties
Past application rates of N had significant effects on soil EC, pH, –N and
–N but not on soil organic C (). Soil EC was significantly the greatest under past N870 and N696, the greater under past N522 and the least under past N348 and N0. Soil pH was significantly higher under past N0 and N348 than under past N522, N696 and N870. Soil
–N was significantly decreased with decreasing N rates. Soil
–N was significantly high under past N870.
Figure 1. Effects of six-year past annual N application rates and a catch crop on soil EC, pH, organic C, –N and
–N (means ± SE, n = 3) between an intensive rotation. The p values of past N application rates on soil EC, pH, organic C,
–N and
–N were <.001, <.001, .335, <.001 and <.001. The p values of catch crop on soil EC, pH, organic C,
–N and
–N were .026, .027, .046, <.001 and .015. The p values of interaction between past N application rates and catch crop on soil EC, pH, organic C,
–N and
–N were .323, .018, .769, .001 and .031. N0, N348, N522, N696 and N870 were 0%, 40%, 60%, 80% and 100% of the conventional N rate (300, 270 or 300 kg N ha−1 for tomato, cucumber or celery).
Catch crop showed significant effects on all tested soil chemical properties. Soil organic C and pH were significantly increased whilst soil EC and –N were significantly decreased under catch crop than under no catch crop (). The past N application rates and catch crop had significant interaction effects on soil pH,
–N and
–N.
Carbon source utilization patterns
Past application rates of N showed significant effects on AWCD, Shannon index and McIntosh index, whilst catch crop showed no significant effects on AWCD and all these three diversity indices (). The AWCD and McIntosh index were significantly higher under past N0 than under past N696 and N870, or under past N522 and N348 than under past N870. The Shannon index was significantly higher under past N0, N522 and N348 than under past N870.
Figure 2. Effects of six-year past annual N application rates and a catch crop on soil microbial AWCD, Shannon index, Simpson index and McIntosh index (means ± SE, n = 4) between an intensive rotation. The p values of past N application rates on AWCD, Shannon index, Simpson index and McIntosh index were <.001, .009, .087 and <.001. The p values of catch crop on AWCD, Shannon index, Simpson index and McIntosh index were .286, .302, .625 and .561. The p values of interaction between past N application rates and catch crop on AWCD, Shannon index, Simpson index and McIntosh index were .162, .378, .148 and .259. N0, N348, N522, N696 and N870 were 0%, 40%, 60%, 80% and 100% of the conventional N rate (300, 270 or 300 kg N ha−1 for tomato, cucumber or celery).
There was considerable variation in carbon source utilization patterns among treatments in the CCA analysis ordination plot (). A significant separation of substrate utilization patterns was found between past N application rates. The CCA analysis illustrated that soil EC was positively associated with –N and
–N, whilst negatively with soil pH. Soil EC (p = .002) and
–N (p = .020) were significant environmental variables of CLPP profiles (). Soil EC and
–N were positively correlated with carbon sources l-asparagine, d-galacturonic acid, itaconic acid, d-malic acid, l-phenylalanine, phenylethylamine and 4-hydroxy benzoic acid, whilst negatively correlated with γ-hydroxybutyric acid, glycyl- l-glutamic acid, i-erythritol, d, l-α glycerol phosphate and α-cyclodextrin.
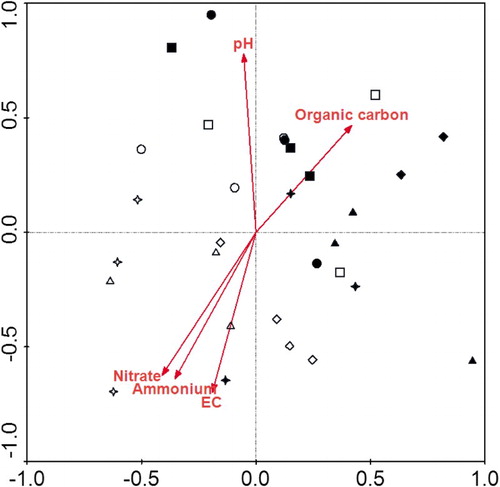
Figure 3. The CCA biplot with the sole carbon source and the following environmental factors: EC, pH, organic C, –N and
–N. N0 (circle), N348 (square), N522 (diamond), N696 (triangle), and N870 (star) were 0%, 40%, 60%, 80% and 100% of the conventional N rate (300, 270 or 300 kg N ha−1 for tomato, cucumber or celery). Hallow symbols denote the no catch crop and solid symbols denote the catch crop.
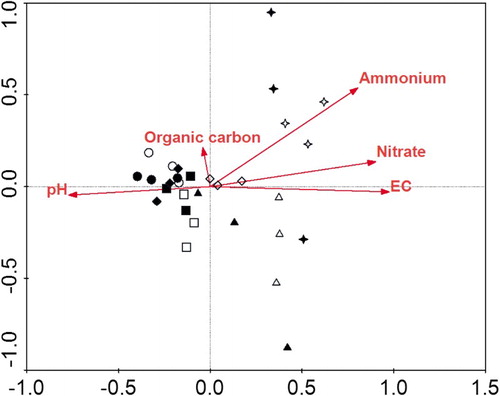
Table 2. CCA of PLFA patterns and CLPP for soil microbial communities.
Phospholipid fatty acids
Past application rates of N did not affect any PLFA, whilst catch crop showed significant effects on the total and actinobacterial PLFAs (). The total PLFA was significantly decreased whilst the actinobacterial PLFA was increased under catch crop than under no catch crop. There was considerable variation in PLFA patterns among treatments in the CCA analysis ordination plot (). The separation of PLFA patterns was significant under catch crop than under no catch crop. The CCA analysis illustrated that soil EC was positively associated with –N and
–N, but negatively with soil pH and organic C. Soil pH was a significant (p = .05) environmental variable of PLFA profiles, and was positively correlated with PLFAs 16:1ω9c, 17:1ω8c, 18:1ω7c and 16:0 3OH, but negatively with PLFAs 14:0 3OH/i16:1 I, i13:0, 12:0 2OH and i12:0 3OH ().
Figure 4. Effects of six-year past annual N application rates and a catch crop on the amounts (nmol g−1 dry weight soil) of total, bacterial, gram-positive bacterial, gram-negative bacterial, fungal and actinobacterial phospholipids fatty acids (PLFAs) (means ± SE, n = 4) between an intensive rotation. The p values of past N application rates on total, bacterial, gram-positive bacterial, gram-negative bacterial, fungal and actinobacterial PLFAs were .681, .968, .688, .481, .346 and .716. The p values of catch crop on total, bacterial, gram-positive bacterial, gram-negative bacterial, fungal and actinobacterial PLFAs were .020, .104, .088, .160, .083 and .008. The p values of interaction between past N application rates and catch crop on total, bacterial, gram-positive bacterial, gram-negative bacterial, fungal and actinobacterial PLFAs were .074, .125, .636, .352, .333 and .232. N0, N348, N522, N696 and N870 were 0%, 40%, 60%, 80% and 100% of the conventional N rate (300, 270 or 300 kg N ha−1 for tomato, cucumber or celery).
Figure 5. CCA biplot with the microbial fatty FAMEs and the following environmental factors: EC, pH, organic C, –N and
–N. N0 (circle), N348 (square), N522 (diamond), N696 (triangle) and N870 (star) were 0%, 40%, 60%, 80% and 100% of the conventional N rate (300, 270 or 300 kg N ha−1 for tomato, cucumber or celery). Hallow symbols denote the no catch crop and solid symbols denote the catch crop.
Discussion
Soil chemical properties
Soil EC has been used to indicate the magnitude of soil salinity that is harmful to crop growth. Soil significantly contributed to soil salinity and acidification in a similar or same greenhouse-based vegetable land in eastern China (Shen et al. Citation2008, Citation2011; Shi et al. Citation2009; Min et al. Citation2011b). Both soil EC and inorganic N were significantly increased, whilst soil pH was decreased with the increase in past N application rates during the summer fallow period (). Similar results have been observed under the same polytunnel greenhouse vegetable lands during vegetable growth seasons (Shen et al. Citation2010, Citation2011). The average annual yield of vegetables was similar between 60%, 80% and 100% of the conventional N rate, but significantly decreased under ≤ 40% of the conventional N rate, since ≤ 40% of the conventional N rate could not meet the vegetable nutrient needs and maintain the vegetable production (Min et al. Citation2011a). These results suggested that any ≤ 40% of the conventional N rate might be impracticable since it would bring a further decrease in vegetable yield and thus in the farmer's profits. Soil EC and
were dramatically decreased after the establishment of catch crop compared to no catch crop at the same past N application rates (), suggesting that the sweet corn could reduce
accumulation since it is an effective C4 plant in taking up N and producing high biomass. Soil pH was significantly improved under catch crop compared to under no catch crop, probably due to a dramatic decrease in soil
that mainly caused soil acidification in such greenhouse-based vegetable land (Shen et al. Citation2008, Citation2011; Shi et al. Citation2009; Min et al. Citation2011b).
Soil organic C was not significantly improved after the coverage of sweet corn or common bean, or even decreased after the coverage of garland chrysanthemum and edible amaranth in a greenhouse-based intensive vegetable soil, northern China (Tian et al. Citation2011). In contrast, soil organic C was significantly increased after the establishment of sweet corn in the tested greenhouse-based vegetable production systems in China's Yangtze River Delta, eastern China ((c)). An increase in soil organic C in this study indicated a more rapid incorporation from plant tissues or residues under a warmer and wetter climate in eastern China (annual mean temperature and precipitation of 15.7°C and 1177 mm) than in northern China (annual mean temperature and precipitation of 11.8°C and 550.3 mm).
Carbon source utilization patterns
The Biolog method has been effective at distinguishing spatial and temporal changes in rapidly growing aerobic heterothrophs in the rhizosphere soil deduced from the C source utilization patterns (Campbell et al. Citation1997). The AWCD and three diversity indices generally decreased with the increase in past N application rates after a summer fallow period (), as observed under the same polytunnel greenhouse vegetable lands during vegetable growth seasons (Shen et al. Citation2010). Soil EC and –N were key factors determining the CLPP during the summer fallow period (), suggesting that soil salinity exerts adverse effect on the rapidly growing aerobic heterotrophs mainly caused by past N application rates. This is inconsistent with previous finding that soil
was the key factor determining the CLPP during vegetable growth seasons (Shen et al. Citation2010), probably due to a substantial
uptake (28, 31, 31 and 38 kg N ha−1 under 40%, 60%, 80% and 100% of the conventional N rate in 2008; 44, 46, 50 and 55 kg N ha−1 in 2009) by sweet corn during the summer fallow period (Min et al. Citation2011a).
Higher populations of heterotrophic bacteria and fungi and greater enzymatic activity were observed in soils after the coverage of catch crops (Janusauskaite et al. Citation2013). Soil microbial populations and diversity indices were greater after the coverage of catch crops in a greenhouse-based intensive vegetable soil, northern China (Tian et al. Citation2011). In contrast, the AWCD and three diversity indices were not significantly improved after the establishment of catch crop in this tested greenhouse-based vegetable soil (), suggesting that rapidly growing aerobic heterotrophs were not influenced by sweet corn during 1–1.5-month fallow period. However, the AWCD and three diversity indices were the greatest after the establishment of sweet corn at a 60% of the conventional N rate, indicating that the establishment of catch crop during summer fallow and a 60% of the conventional N rate (i.e. N522) could improve the rapidly growing aerobic heterotrophs in such greenhouse-based intensive vegetable soils, eastern China.
PLFA profiles
Several studies have shown that N fertilization could change soil microbial biomass and community structures, as determined by PLFA profiles (Cusack et al. Citation2011; Rousk et al. Citation2011; Börjesson et al. Citation2012; Li et al. Citation2012). The amounts of total, bacterial, fungal or actinobacterial PLFAs were generally increased with the increase in N application rates (Cusack et al. Citation2011; Börjesson et al. Citation2012; Li et al. Citation2012). In contrast, the amounts of total, bacterial or fungal PLFAs remained unchanged or even decreased by higher N application rates (Roberts et al. Citation2011; Rousk et al. Citation2011). The past N application rates did not change either soil microbial biomass and community structures (), or the ratios of fungal to bacterial PLFAs and G+ to G− bacterial PLFAs as measured by PLFA analyses (data not shown), which are widely used to indicate soil quality and health (Helgason et al. Citation2009). These results suggest that CLPP was more responsive than PLFA profiles to past N application rates tested in this study.
Soil microbial biomass, population and diversity indices were greater under the summer cover crop than under the no cover crop control in a commercial greenhouse vegetable land in northern China (Tian et al. Citation2011). In contrast, total PLFAs were decreased and bacterial PLFA, G+ bacterial PLFA, G− bacterial PLFA and fungal PLFA remained unchanged after the establishment of sweet corn in our study, probably because both our field experimental duration (3-year) and catch crop growth period (1–1.5-month annually) were shorter than the previous field experiment (4-year) and growth period (3-month). Another reason might be that the PLFA-based assessment of microbial community structure was less sensitive, compared to the DNA-based approaches (Chaer et al. Citation2009; Tian et al. Citation2011). However, actinobacteria, which are well known for degradation and penetration of chitinous hyphal walls of plant pathogenic fungi through the secretion of chitinases and other antifungal compounds (Rothrock & Gottlieb Citation1981; Nazari et al. Citation2011), were significantly enhanced after the establishment of sweet corn ((f)). The actinobacterial growth had been improved after the establishment of sweet corn, possibly due to organic matter input to soil from sweet corn, and alleviating soil acidification and secondary salinization of such greenhouse-based vegetable production system. Continuous vegetable cropping of the same genus or species accumulated toxic root exudates in soils (Yu et al. Citation2000), decreased the number of effective microorganisms and soil microbial diversity (Yao et al. Citation2006), and promoted the incidence of soil-borne plant diseases in greenhouse-based vegetable production systems (Shen et al. Citation2008). Our results suggest that the establishment of sweet corn during summer fallow period could improve soil organic matter ((c)), and enhance the growth of actinobacteria that might strengthen soil suppressiveness towards soil-borne plant fungal pathogens through the secretion of chitinases and other antifungal compounds (Rothrock & Gottlieb Citation1981; Nazari et al. Citation2011).
In conclusion, the introduction of a catch crop into an intensive vegetable production system could alter soil properties and relevant microbial activities during 1–1.5-month fallow period over 3-year tomato/cucumber/celery rotations. Results from the present study showed that soil EC and –N were significantly decreased whilst soil organic C and actinobacterial PLFA were significantly enhanced, suggesting that chemical properties were greatly improved after the establishment of sweet corn during the summer fallow period. These results demonstrated that a combination of the establishment of a catch crop of sweet corn during the summer fallow and with a 60% of the conventional N rate might be a sustainable pathway of utilizing greenhouse-based intensive vegetable soils in eastern China.
Acknowledgements
The authors thank Biyun Bian for her assistances with analyzing PLFA samples and Wenhui Zhong for his kind suggestion during this study.
Disclosure statement
No potential conflict of interest was reported by the authors.
ORCID
Additional information
Funding
References
- Börjesson G, Menichetti L, Kirchmann H, Kätterer T. 2012. Soil microbial community structure affected by 53 years of nitrogen fertilisation and different organic amendments. Biol Fert Soils. 48:245–257. doi: 10.1007/s00374-011-0623-8
- Brant JB, Sulzman EW, Myrold DD. 2006. Microbial community utilization of added carbon substrates in response to long-term carbon input manipulation. Soil Biol Biochem. 38:2219–2232. doi: 10.1016/j.soilbio.2006.01.022
- Budge K, Leifeld J, Egli M, Fuhrer J. 2011. Soil microbial communities in (sub)alpine grasslands indicate a moderate shift towards new environmental conditions 11 years after soil translocation. Soil Biol Biochem. 43:1148–1154. doi: 10.1016/j.soilbio.2011.02.001
- Campbell CD, Grayston SJ, Hirst DJ. 1997. Use of rhizosphere carbon sources in sole carbon source tests to discriminate soil microbial communities. J Microbiol Meth. 30:33–41. doi: 10.1016/S0167-7012(97)00041-9
- Chaer GM, Fernandes MF, Myrold DD, Bottomley PJ. 2009. Shifts in microbial community composition and physiological profiles across a gradient of induced soil degradation. Soil Sci Soc Am J. 73:1327–1334. doi: 10.2136/sssaj2008.0276
- Constantin J, Mary B, Laurent F, Aubrion G, Fontaine A, Kerveillant P, Beaudoin N. 2010. Effects of catch crops, no till and reduced nitrogen fertilization on nitrogen leaching and balance in three long-term experiments. Agr Ecosyst Environ. 135:268–278. doi: 10.1016/j.agee.2009.10.005
- Cusack DF, Silver WL, Torn MS, Burton SD, Firestone MK. 2011. Changes in microbial community characteristics and soil organic matter with nitrogen additions in two tropical forests. Ecology. 92:621–632. doi: 10.1890/10-0459.1
- Doltra J, Olesen JE. 2013. The role of catch crops in the ecological intensification of spring cereals in organic farming under Nordic climate. Eur J Agron. 44:98–108. doi: 10.1016/j.eja.2012.03.006
- Gao N, Shen WS, Lin XG, Shi WM. 2015. Influence of transgenic ath-miR399d tomato lines on microbial community and diversity in rhizosphere soil. Soil Sci Plant Nutr. 61:259–268. doi: 10.1080/00380768.2014.970116
- Gong ZT. 1999. Chinese soil taxonomy (in Chinese). Beijing: Science Press, pp. 147–196.
- Guo RY, Li XL, Christie P, Chen Q, Jiang RF, Zhang FS. 2008. Influence of root zone nitrogen management and a summer catch crop on cucumber yield and soil mineral nitrogen dynamics in intensive production systems. Plant Soil. 313:55–70. doi: 10.1007/s11104-008-9679-0
- Helgason BL, Walley FL, Germida JJ. 2009. Fungal and bacterial abundance in long-term no-till and intensive-till soils of the northern Great Plains. Soil Sci Soc Am J. 73:120–127. doi: 10.2136/sssaj2007.0392
- IUSS Working Group WRB. 2006. World reference base for soil resources 2006. World soil resources reports No. 103, pp. 71–72. FAO, Rome.
- Janusauskaite D, Arlauskiene A, Maikteniene S. 2013. Soil mineral nitrogen and microbial parameters as influenced by catch crops and straw management. Zemdirbyste. 100:9–18. doi: 10.13080/z-a.2013.100.002
- Kulmatiski A, Beard KH. 2011. Long-term plant growth legacies overwhelm short-term plant growth effects on soil microbial community structure. Soil Biol Biochem. 43:823–830. doi: 10.1016/j.soilbio.2010.12.018
- Li YJ, Chen X, Shamsi IH, Fang P, Lin XY. 2012. Effects of irrigation patterns and nitrogen fertilization on rice yield and microbial community structure in paddy soil. Pedosphere. 22:661–672. doi: 10.1016/S1002-0160(12)60051-4
- Lu RK. 2000. Methods of soil agricultural chemical analysis. Beijing: China Agriculture Science & Technology Press.
- Min J, Shi WM, Xing GX, Zhang HL, Zhu ZL. 2011a. Effects of a catch crop and reduced nitrogen fertilization on nitrogen leaching in greenhouse vegetable production systems. Nutr Cycl Agroecosys. 91:31–39. doi: 10.1007/s10705-011-9441-5
- Min J, Zhao X, Shi WM, Xing GX, Zhu ZL. 2011b. Nitrogen balance and loss in a greenhouse vegetable system in southeastern China. Pedosphere. 21:464–472. doi: 10.1016/S1002-0160(11)60148-3
- Nazari B, Saito A, Kobayashi M, Hassaninasab A, Miyashita K, Fujji T. 2011. High expression levels of chitinase genes in Streptomyces coelicolor A3(2) grown in soil. FEMS Microbiol Ecol. 77:623–635. doi: 10.1111/j.1574-6941.2011.01143.x
- Roberts BA, Fritschi FB, Horwath WR, Scow KM, Rains WD, Travis RL. 2011. Comparisons of soil microbial communities influenced by soil texture, nitrogen fertility, and rotations. Soil Sci. 176:487–494. doi: 10.1097/SS.0b013e31822769d3
- Rothrock CS, Gottlieb D. 1981. Importance of antibiotic production in antagonism of selected Streptomyces species to two soil-borne plant pathogens. J Antibiot. 34:830–835. doi: 10.7164/antibiotics.34.830
- Rousk J, Brookes PC, Baath E. 2011. Fungal and bacterial growth responses to N fertilization and pH in the 150-year ‘Park Grass’ UK grassland experiment. FEMS Microbiol Ecol. 76:89–99. doi: 10.1111/j.1574-6941.2010.01032.x
- Schumacher BA. 2002. Methods for the determination of total organic carbon (TOC) in soils and sediments. US environmental protection agency, Washington, DC, EPA/600/R-02/069 (NTIS PB2003-100822).
- Shen WS, Lin XG, Gao N, Shi WM, Min J, He XH. 2011. Nitrogen fertilization changes abundance and community composition of ammonia-oxidizing bacteria. Soil Sci Soc Am J. 75:2198–2205. doi: 10.2136/sssaj2010.0459
- Shen WS, Lin XG, Gao N, Zhang HY, Yin R, Shi WM, Duan ZQ. 2008. Land use intensification affects soil microbial populations, functional diversity and related suppressiveness of cucumber Fusarium wilt in China's Yangtze River Delta. Plant Soil. 306:117–127. doi: 10.1007/s11104-007-9472-5
- Shen WS, Lin XG, Shi WM, Min J, Gao N, Zhang HY, Yin R, He XH. 2010. Higher rates of nitrogen fertilization decrease soil enzyme activities, microbial functional diversity and nitrification capacity in a Chinese polytunnel greenhouse vegetable land. Plant Soil. 337:137–150. doi: 10.1007/s11104-010-0511-2
- Shi WM, Yao J, Yan F. 2009. Vegetable cultivation under greenhouse conditions leads to rapid accumulation of nutrients, acidification and salinity of soils and groundwater contamination in South-Eastern China. Nutr Cycl Agroecosys. 83:73–84. doi: 10.1007/s10705-008-9201-3
- Tian YQ, Zhang XY, Liu J, Gao LH. 2011. Effects of summer cover crop and residue management on cucumber growth in intensive Chinese production systems: soil nutrients, microbial properties and nematodes. Plant Soil. 339:299–315. doi: 10.1007/s11104-010-0579-8
- Yao HY, Jiao XD, Wu FZ. 2006. Effects of continuous cucumber cropping and alternative rotations under protected cultivation on soil microbial community diversity. Plant Soil. 284:195–203. doi: 10.1007/s11104-006-0023-2
- Yu JQ, Shou SY, Qian YR, Zhu ZJ, Hu WH. 2000. Autotoxic potential of cucurbit crops. Plant Soil. 223:147–151. doi: 10.1023/A:1004829512147
- Zelles L. 1999. Fatty acid patterns of phospholipids and lipopolysaccharides in the characterisation of microbial communities in soil: a review. Biol Fertil Soils. 29:111–129. doi: 10.1007/s003740050533