
ABSTRACT
The main cause of loss of soil structural stability is vehicle operation on unpaved wet surfaces. Unfortunately, there is a lack of continuous soil moisture data in predicting trafficable conditions. To measure changes in soil moisture conditions in real time, Percostation (Adek) sensors were installed in sandy loam Stagnosol soil at different depths. Problems with soil trafficability can be expected at the plastic limit, and the soil is unable to support vehicle operations at the liquid limit in such soils. The maximum water-holding capacity of the soil is 32%, the field capacity is 25%, the plastic limit is 22%, and the liquid limit is 30%. With rainfall of more than 10 mm d−1, the moisture content reached the plastic limit in the upper 25 cm of soil. The average increase in the soil moisture content after more than 10 mm of rain was 1–2.5% in a time frame of 2–3 hours. After rain, the previous soil moisture level was obtained within 2 to 3 days in the vegetation period. Measurements also allowed soil water balance and evapotranspiration modelling data to predict soil moisture conditions with an accuracy of one day but failed to predict in a shorter period.
Introduction
Soil structural stability is highly relevant to support all soil functions and is mainly affected by the vehicle operations outside the roads. Soil resistance to the loads depends on vehicle parameters, such as axle loads and soil properties such as soil texture, porosity, organic matter content and the most important of all about the water content during movement (Horn et al. Citation2005; Stevens et al. Citation2016). Müller et al. (Citation1990) stated that trafficability parameters, such as axle load and soil shear strength are important, but not necessarily needed for trafficability predictions and more relative parameters, such as consistency, permeability and their change with time should be determined. Different trafficability models are developed using both typical (Laughery et al. Citation2000; Horn & Fleige Citation2003; Pirnazarov & Sellgren Citation2015) and related (FM Citation5-Citation430-Citation00-Citation1 Citation1994; Priddy & Willoughby Citation2006; Flores et al. Citation2014; Goodin & Priddy Citation2016) parameters. However, all these soil parameters are highly dependent on the soil water status, and maps created for trafficability are static at certain water contents (D´Or Destain Citation2014). Problems with soil workability and trafficability can be expected at the plastic limit (Dexter & Bird Citation2001; Qu et al. Citation2014) and soil cannot support repeated vehicle operations at the liquid limit in cohesive soils (Müller et al. Citation1990; Wagner et al. Citation1992; Marinho Citation2013). Soils are most workable in the range of 0.6–0.9 of the plastic limit (Mosaddeghi et al. Citation2009). However, in the soils where the plastic limit is similar to the field capacity it is the range where the soils are most vulnerable to compaction (Hamza & Anderson Citation2005). If the water content between plastic and liquid limits differs, the soil can be compacted (Hamza & Anderson Citation2005), but if the water content of natural soil is higher than the liquid limit, repeated passing transforms the soil into thick viscous mud (Terzaghi et al. Citation1996). Therefore, the main question of predicting soil trafficability is the accurate measure or prediction of soil water content change over time. As the weather can change quickly and with that also soil water status, the manual measurements, especially the physical sampling and drying, may not give sufficient quick results. Several sensors have been developed to measure the soil moisture content. Counting with the crops water demands, measuring the soil matrix potential can be accurate and the results obtained are independent of soil characteristics (Thompson et al. Citation2007). A limitation of such kind of measurements is the range of measurement, especially during the rapid drying of soil. With the wide range of measure, the time domain reflectrometry (TDR) introduced in the 1980s (Topp et al. Citation1980) is widely used later for in situ and continuous measurements (Greco & Guida Citation2008; Fatás et al. Citation2013) for different purposes. Measuring the soil moisture content by TDR, the results should be calibrated according to the soil density, salinity and temperature. As described the method needs installation of sensors and cannot be used in the wide range, the near infrared reflectance sensors are being developed for local (Yin et al. Citation2013) and microwave technology (L-band: 1–2 GHz) to measure the soil moisture globally after every 2–3 days (Kerr et al. Citation2001) and tested for the trafficability purposes (Flores et al. Citation2014).
If the direct measurement of the soil water content is not possible, the way to obtain the expected results is to model the soil water content changes. Several pedotransfer functions are developed to predict the different soil water characteristics according to the basic soil properties such as texture and bulk density (Arya & Paris Citation1981; Al Majou et al. Citation2008; Li et al. Citation2016).
The simplest predictions are based on modelling the soil as a container. Over a given time interval all input and output flows are summarized and the difference of initial stage and final stage is the change of soil water content (Lascano Citation1991; Allen et al. Citation1998). The input can be considered as precipitation on plain surface and precipitation and external inflow in depressions. The outputs are deeper percolation, outflow on hilly surface and evapotranspiration, depending on soil properties and plant cover. The Darcy law and its developments are commonly used to calculate water movement in the soil (Lascano Citation1991). As the water movement into the deeper layers depends also on soil density and initial water content, the Green–Ampt infiltration equation, taking into account the wetting front, is widely used in the water balance models (Green & Ampt Citation1911; Barry et al. Citation2005). The water conductivity of the soil decreases with the increase in groundwater table and also during continuous heavy rain. At the same time, water conductivity decreases also in very dry soil condition. Because of this the Green–Ampt model has been modified to fit better with real conditions (Gowdish & Muñoz-Carpena Citation2009; Mao et al. Citation2016).
The FAO Penman-Monteith method is recommended as the standard method for the definition and computation of the reference evapotranspiration in agriculture since 1990 (Allen et al. Citation1998). The method gives quite accurate results but requires specific climatic data, such the net radiation, heat fluxes, wind speed and the crop-specific parameters which may be not available.
Due to the limitations of the specific data availability, the simplest models should be used to estimate trafficability conditions at field scale. For this, the Blaney–Criddle equation can be used to estimate the evapotranspiration in the regions where only temperature data are available but only for monthly or longer period estimations (Allen et al. Citation1998; Salama et al. Citation2015). In case the relative humidity of air is also known, the Alpatjev equation can be adopted (Alpatjev Citation1954). The principle of the Alpatjev equation is to use air humidity deficit and plant coefficient depending on the plant growth stage (Shumova Citation2009). In the case of the Alpatjev model, the same crop coefficients can be used as suggested by Allen et al. (Citation1998).
The aim of the current study was to test the soil moisture changes in the field conditions in short intervals under cultivated and grassland area in the different depths using Adek Percostation in relation with precipitations and to find out a simple model to predict soil moisture changes.
Material and methods
To measure continuously changes in the soil moisture conditions, Percostation (Adek LLC) sensors were installed into the soil at different depths in end of May 2013 and left on the same location for 1.5 year in Estonia near Tartu. Percostation is a system for continuous monitoring of dielectric constant, electrical conductivity and temperature of materials and used so far mainly to assess the critical bearing capacity of roads (Adek – Dielectric Constant … ). For one station, a maximum of eight sensors can be installed. However, the same system can be used effectively in different soil conditions. The measurement frequency was set to 2 h to fit with the local weather station settings located on the same field. Sensors were placed at depths of 10, 25, 45 and 75 cm under spring barley (Hordeum vulgare L.) or potato (Solanum tuberosum L.) in cultivated soil, in 2013 and 2014, respectively, and 10, 25 and 45 cm under grassland (turf grass around field experiment) (). One sensor was left to measure the air temperature. To calibrate the data, from the same depths the soil samples to measure bulk density, water content and water permeability were collected (). Data from Percostation were sent to the user server via the internet (mobile internet connection), downloaded and volumetric water content calculated taking into account the soil salinity and temperature.
Figure 1. Setup of Percostation and sensors (Ader LLC) in May, 2013 (photo by E. Reintam).
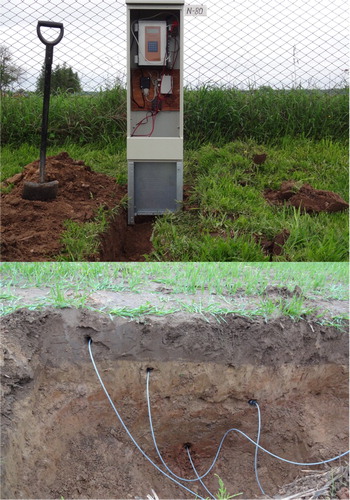
Table 1. Average soil properties and standard error of the values of the experimental site.
To calculate soil water balance in the soil, the following principle was used (Allen et al. Citation1998):(1) where SWt is the current soil humidity (mm H2O); SW0 the starting (day 0) soil humidity (mm H2O); t the time (days); Rday the precipitation in day i (mm H2O); Qsurf the superficial outflow in day i (mm H2O); Ea the evapotranspiration in day i (mm H2O); wdeep the vertical percolation in day i (mm H2O) and Qgw the horizontal percolation in day i (mm H2O).
As long as the soil water content in the root zone is below field capacity, the soil will not drain and percolation will be equal to zero. As the results showed no changes in the water content in the deeper horizons during the growing period (), no percolation was calculated in the current study.
In soil moisture prediction, the average of the upper 25 cm soil layer was used as the most important part for trafficability of most of the vehicles.
The Alpatjev (Citation1954) equation was used to predict soil evapotranspiration:(2) where E0 is the potential evapotranspiration (mm); k the biological constant, depending on crop and growth stage and (e0
–e) the deficit of relative humidity (kPa).
Deficit of vapour pressure can be found through relative air humidity (r) as follows:(3) where r is the relative air humidity (%); e the water vapour pressure deficit (mb) and E the water vapour pressure at certain temperature (mb).
Deficit of relative humidity was found to be(4) where d is the deficit of relative humidity (mb); e the water vapour pressure (mb) and E the water vapour pressure at certain temperatures (mb).
Vapour pressure at certain temperatures was found to be(5)
Temperature correction T was found through real air temperature (t°):(6)
To test the prediction accuracy, the root mean square error (RMSE) was calculated as follows:(7) where W0 and
are the measured and predicted volumetric soil moisture contents, respectively (%) and n is the number of measurements.
The crop coefficient for spring barley (field) used was 0.2 till the end of May, 1.15 till the end of July, 1.0 in August and 0.1 in September and October and 0.01 in November. For potato, the following coefficients were used: 0.2 till the end of May, 0.75 till the middle of June, 1.15 till the end of August, 0.75 till the end of September and 0.1 in October and 0.01 in November. The crop coefficient for turf grass used was 0.9 till the end of August and 0.85 in November (Allen et al. Citation1998).
Results
As there were no extreme weather events during the survey period, the results of measurements revealed that the soil water content did not reach the liquid limit in the investigated seasons ( and ). With rainfall more than 10 mm d−1, the moisture content reached up to the plastic limit in the upper 25 cm of soil. The average increase in the soil moisture content after more than 10 mm of rain was 1–2.5% in the time frame of 2–3 h in the upper layers. The rest of the water was used by the plants or evaporated as no changes in the deeper (45 and 70 cm in the soil) soil layers were detected before November. After the rain, the previous soil moisture level was reached within 2–3 days in the vegetation period.
Figure 2. Measured soil volumetric water content (%, by Percostation) in different depths under field (Hordeum vulgare L.) and grassland, precipitations (mm) and calculated evapotranspiration by Alpatjev in 2013.
Figure 3. Measured soil volumetric water content (%, by Percostation) at different depths under field (Solanum tuberosum L.) and grassland, precipitations (mm) and calculated evapotranspiration by Alpatjev in 2014.
Use of the Alpatjev equation (2) to calculate the evapotranspiration and through that the water balance revealed the unsuitability of the used simple water balance model (1) to predict the soil moisture changes in a short period, 2 h, of time ( 2 h step). The model overestimated both precipitations and evapotranspiration not taking into account that it will take more time to get new equilibrium in the soil. However, for changes calculated over a period of a day (24 h), the model predictions fitted with the measured soil water changes (). Used crop coefficients slightly underestimate the evapotranspiration, especially in the case of turf grass since September.
Figure 4. The correlation between measured and predicted soil volumetric moisture content (%) of upper 25 cm (average) of soil as an average of two years using the 2 h and daily step under cultivated (field) and grassland conditions. For daily predictions correlation is statistically significant (p < .05).
Discussion
The use of Percostation revealed its sensors suitability to detect the soil moisture changes over time at different depths. So far the stations are used mainly as a ‘Tool for Monitoring Moisture and Bearing Capacity in Road Construction, and Optimising the Use of Load Restrictions’ (Adek – Dielectric Constant … ; Yeo et al. Citation2012). However, as soon the freezing of the soil starts, the detection of water content via the sensors is impossible as the dielectric constant will be more affected by the temperature changes than the changes in the water content. On the other hand, such a change in the electrical constant is a signal of freezing/melting of the soil and can be used for the trafficability predictions during that time period of year.
The study revealed that simple models can be used for prediction of moisture changes in the soil if only limited data are available. Prediction accuracy is higher when the daily step calculations instead of 2 h step are used (; ). The suggested crop coefficients (Allen et al. Citation1998) underestimated the evapotranspiration of spring barley and potato during intensive growing and those higher constants should be used. The same was the situation with turf grass, as the suggested coefficient 0.9 underestimated evapotranspiration, especially in September and October probably due to the higher than 10 cm plant cover at that period. Due to the warm autumn (in year 2013) the grass had an opportunity to grow higher than the average turf grass height and coefficients of the pasture would give more accurate results. It should be taken into account also that available crop coefficients cannot be directly adapted to the Estonian climate conditions and no local coefficients are available as irrigation is not essential. On the other hand, the need for such kind of information is becoming more important due to the need to avoid extra damage, such compaction or tyre tracks during the field operations. The prediction accuracy depends also from the initial water content taken as the starting point for prediction. It can be calculated as well (Allen et al. Citation1998); however, at least one measurement on the field should be done before model to run.
Table 2. Root mean square error of the models using the 2 h step or daily step interval to calculate water balance in the soil under field and grassland conditions in 2013 and 2014.
In the period of investigation the soil water content did not exceed the liquid limit and reached only after heavier rain close to the plastic limit (; and ) those having no problems with general trafficability. The reason was the very dry season having 140 mm less precipitation than average in the period June till October in 2013. Taking into account the trafficability, precipitation in excess of 60 mm in a 12-h period is considered critical (FM Citation34-Citation81 Citation1989). However, the amount of precipitations in which case the trafficability will be difficult depends on initial soil water content, soil infiltration coefficient and also plant cover. In agriculture Schjønning et al. (Citation2012), proposed the ‘50–50 rule’ to avoid excessive compaction – ‘at water contents around field capacity, traffic on agricultural soil should not exert vertical stresses in excess of 50 kPa at depths >50 cm’ (Edwards et al. Citation2016).
Problems with soil trafficability can be expected at soil water content over a plastic limit and soil cannot support vehicle operations at the liquid limit in cohesive soils. The results of two season measurements on sandy loam soil revealed that the soil water content did not reach the liquid limit at the survey period due to the abnormal dry seasons in 2013 and 2014. With rainfall more than 10 mm d−1 the moisture content reached up to the plastic limit in upper 25 cm of soil. The average increase in soil moisture content after more than 10 mm of rain was 1–2.5% in time frame 2–3 h. After rain previous soil moisture level was reached within 2–3 days in the vegetation period. Measures approved the soil water balance and evapotranspiration modelling data to predict the soil moisture conditions with the accuracy of one day but failed to predict in a shorter period.
Disclosure statement
No potential conflict of interest was reported by the authors.
Notes on contributors
Endla Reintam, PhD is associated professor in soil science at Estonian University of Life Sciences. She has over 20 years of experience in fundamental and applied research in the area of soil physical and chemical properties and their interactions to plant growth. Her current activities are related to soil trafficability and soil management impacts on soil properties. Currently she is involved in the Horizon 2020 project ISQAPER, ERASMUS+ projects EduSapMan and Faces, and applied research project FERTIL-Crop. She has published over 100 papers in international and local journals and books.
Kersti Vennik, MSc is a postgraduate student at Estonian University of Life Sciences and lecturer at Estonian National Defence College. She has over 10 years of experience in GIS and soil trafficability.
Liia Kukk, PhD is specialist at Estonian University of Life Sciences. She has over 10 years of experience in soil–crop relationship of dedicated energy crops, fertilization efficiency and energy efficiency and GIS.
Siiri Kade, MSc is specialist at Estonian University of Life Sciences. She has 2 years of experience in soil physical-mechanical laboratory and field measurements.
Kadri Krebstein, MSc is a postgraduate student at Estonian University of Life Sciences. She has over 10 years of experience in the area of soil physical and chemical properties and their interactions to plant growth.
Mihkel Are, MSc is a postgraduate student at Estonian University of Life Sciences. He has 2 years of experience in the area of soil structural stability and physical properties.
Alar Astover, PhD – is professor in soil science at Estonian University of Life Sciences. He has over 15 years of experience in area of land use and soil management analyses, GIS, pedotransfer functions and composts. Currently he is involved in Horizon 2020 project ISQAPER and ERASMUS+ project EduSapMan. His current activities are related to different composts and humus balance models. He has published over 50 papers in international and local journals and books.
Additional information
Funding
References
- Adek – Dielectric Constant Measurement Continuous Monitoring Soil Moisture and Salinity. [Internet]. [cited 2016 Feb 14]. Percostation: Available from: http://adek.ee/index.php?page=96.
- Al Majou H, Bruand A, Duval O, Le Bas C, Vautier A. 2008. Prediction of soil water retention properties after stratification by combining texture, bulk density and the type of horizon. Soil Use Manage. 24(4):383–391. doi: 10.1111/j.1475-2743.2008.00180.x
- Allen RG, Pereira L, Raes D, Smith M. 1998. Crop evapotranspiration – guidelines for computing crop water requirements – FAO Irrigation and drainage paper 56: 33 pp. [Internet]. [cited 2016 Feb 14]. Available from: http://www.kimberly.uidaho.edu/water/fao56/fao56.pdf.
- Alpatjev AM. 1954. Water cycle of plants. (In Russian). Leningrad: Gidrometeoizdat, 246 pp.
- Arya LM, Paris JF. 1981. A physicoempirical model to predict the soil moisture characteristic from particle-size distribution and bulk density data. Soil Sci Soc Am J. 45(6):1023–1030. doi: 10.2136/sssaj1981.03615995004500060004x
- Barry DA, Parlange J-Y, Li L, Jeng D-S, Crapper M. 2005. Green–Ampt approximations. Adv Water Resour. 28:1003–1009. doi: 10.1016/j.advwatres.2005.03.010
- Dexter AR, Bird NRA. 2001. Methods for predicting the optimum and the range of soil water contents for tillage based on the water retention curve. Soil Tillage Res. 57:203–212. doi: 10.1016/S0167-1987(00)00154-9
- D´or D, Destain M-F. 2014. Toward a tool aimed to quantify soil compaction risks at a regional scale: application to Wallonia (Belgium). Soil Tillage Res. 144:53–71. doi: 10.1016/j.still.2014.06.008
- Edwards G, White DR, Munkholm LJ, Sørensena CG, Lamandé M. 2016. Modelling the readiness of soil for different methods of tillage. Soil Tillage Res. 155:339–350. doi: 10.1016/j.still.2015.08.013
- Fatás E, Vicente J, Latorre B, Lera F, Viñals V, López MV, Blanco N, Peña C, González-Cebollada C, Moret-Fernández D. 2013. TDR-LAB 2.0 improved TDR Software for soil water content and electrical conductivity measurements. Procedia Environ Sci. 19:474–483. doi: 10.1016/j.proenv.2013.06.054
- Flores NA, Entekhabi D, Bras RL. 2014. Application of a hillslope-scale soil moisture data assimilation system to military trafficability assessment. J Terramech. 51:53–66. doi: 10.1016/j.jterra.2013.11.004
- FM 5-430-00-1. 1994. US Army. Planning and design of roads, airfields, and heliports in the theater of operations – road design. VOL I. Headquarters, Department of the Army. Department of the Air Force. Washington, DC, 26 August 1994.
- FM 34-81. 1989. Weather Support for Army Operations. Appendix B. Weather effect on army operations. Department of the Army, Washington, DC, 31 August 1989.
- Goodin C, Priddy JD. 2016. Comparison of SPH simulations and cone index tests for cohesive soils. J Terramech. 66:49–57. doi: 10.1016/j.jterra.2015.09.002
- Gowdish L, Muñoz-Carpena R. 2009. An improved Green–Ampt infiltration and redistribution method for uneven multistorm series. Vadose Zone J. 8:470–479. doi: 10.2136/vzj2008.0049
- Greco R, Guida A. 2008. Field measurements of topsoil moisture profiles by vertical TDR probes. J Hydrol. 348:442–451. doi: 10.1016/j.jhydrol.2007.10.013
- Green WH, Ampt GA. 1911. Studies in soil physics: I. The flow of air and water through soils. J Agric Sci. 4:1–24. doi: 10.1017/S0021859600001441
- Hamza MA, Anderson WK. 2005. Soil compaction in cropping systems. A review of the nature, causes and possible solutions. Soil Tillage Res. 82:121–145. doi: 10.1016/j.still.2004.08.009
- Horn R, Fleige H. 2003. A method for assessing the impact of load on mechanical stability and on physical properties of soils. Soil Tillage Res. 73:89–99. doi: 10.1016/S0167-1987(03)00102-8
- Horn R, Fleige H, Richter F-H, Czyz EA, Dexter A, Diaz-Pereira E, Dumitru E, Enarche R, Mayol F, Rajkai K, et al.. 2005. SIDASS project: Part 5: prediction of mechanical strength of arable soils and its effects on physical properties at various map scales. Soil Tillage Res. 82:47–56. doi: 10.1016/j.still.2005.01.007
- Kerr YH, Waldteufel P, Wigneron J-P, Martinuzzi J-M, Font J, Berger M. 2001. Soil moisture retrieval from space: the soil moisture and ocean salinity (SMOS) mission. IEEE Trans Geosci Remote Sens. 39:1729–1735. doi: 10.1109/36.942551
- Lascano RJ. 1991. Review of models for predicting soil water balance. Soil water balance in the Sudano-SaheUan zone. Proceedings of the Niamey Workshop; February 1991; IAHS Publ. no. 199.
- Laughery S, Gerhart G, Muench P. 2000. Evaluating vehicle mobility using Bekker’s equations. US Army TARDEC Warren, MI.
- Li D, Gao G, Shao M, Fu B. 2016. Predicting available water of soil from particle-size distribution and bulk density in an oasis–desert transect in northwestern China. J Hydrol. 538:539–550. doi: 10.1016/j.jhydrol.2016.04.046
- Mao L, Li Y, Hao W, Zhou X, Xu C, Lei T. 2016. A new method to estimate soil water infiltration based on a modified Green–Ampt model. Soil Tillage Res. 161:31–37. doi: 10.1016/j.still.2016.03.003
- Marinho FAM. 2013. Undrained shear of plastic soils under suction. In: Laloui L, Ferrari A, editors. Multiphysical testing of soils and shales. Berlin: Springer Verlag; p. 45–56.
- Mosaddeghi MR, Morshedizad M, Mahboubi AA, Dexter AR, Schulin R. 2009. Laboratory evaluation of a model for soil crumbling for prediction of the optimum soil water content for tillage. Soil Tillage Res. 105:242–250. doi: 10.1016/j.still.2009.08.005
- Müller L, Tille P, Kretschmer H. 1990. Trafficability and workability of alluvial clay soils in response to drainage status. Soil Tillage Res. 16:273–287. doi: 10.1016/0167-1987(90)90101-I
- Pirnazarov A, Sellgren U. 2015. Reduced testing and modelling of the bearing capacity of rooted soil for wheeled forestry machines. J Terramech. 60:23–31. doi: 10.1016/j.jterra.2015.05.002
- Priddy JD, Willoughby WE. 2006. Clarification of vehicle cone index with reference to mean maximum pressure. J Terrramech. 43:85–96. doi: 10.1016/j.jterra.2004.10.001
- Qu J, Li B, Wei T, Li C, Liu B. 2014. Effects of rice-husk ash on soil consistency and compactibility. Catena. 122:54–60. doi: 10.1016/j.catena.2014.05.016
- Salama MA, Yousef KhM, Mostafa AZ. 2015. Simple equation for estimating actual evapotranspiration using heat units for wheat in arid regions. J Radiat Res Appl Sci. 8:418–427. doi: 10.1016/j.jrras.2015.03.002
- Schjønning P, Lamandé M, Keller T, Pedersen J, Stettler M. 2012. Rules of thumb for minimizing subsoil compaction. Soil Use Manage. 28(3):378–393. doi: 10.1111/j.1475-2743.2012.00411.x
- Shumova N. 2009. Crop water supply and its relation to yield of spring wheat in the South Russian plain. J Hydrol Hydromech. 57(1):26–39. doi: 10.2478/v10098-009-0003-3
- Stevens MT, McKinley GB, Vahedifar F. 2016. A comparison of ground vehicle mobility analysis based on soil moisture time series datasets from WindSat, LIS, and in situ sensors. J Terramech. 65:49–59. doi: 10.1016/j.jterra.2016.02.002
- Thompson RB, Gallardo M, Valdez LC, Fernandez MD. 2007. Using plant water status to define threshold values for irrigation management of vegetable crops using soil moisture sensors. Agric Water Manag. 88:147–158. doi: 10.1016/j.agwat.2006.10.007
- Terzaghi K, Peck RB, Mesri G. 1996. Soil mechanics in engineering practice. 3rd ed. New York: John Wiley.
- Topp GC, Davis JL, Annan AP. 1980. Electromagnetic determination of soil water content: measurements in coaxial transmission lines. Water Resour Res. 16:574–582. doi: 10.1029/WR016i003p00574
- Wagner LE, Ambe NM, Barnes P. 1992. Tillage-induced soil aggregate status as influenced by water content. Trans Am Soc Agric Eng. 35(2):499–504. doi: 10.13031/2013.28627
- Yeo YS, Nikraz H, Jitsanguam P. 2012. Tube suction test to measure moisture susceptibility of Australian pavements. Eng J. 16(4):159–168. doi: 10.4186/ej.2012.16.4.159
- Yin Z, Lei T, Yan Q, Chen Z, Dong Y. 2013. A near-infrared reflectance sensor for soil surface moisture measurement. Comput Electron Agr. 99:101–107. doi: 10.1016/j.compag.2013.08.029