
ABSTRACT
Environmental pollution due to uncontrolled e-waste recycling activities has been reported in a number of locations in China. In this study, heavy metal pollution from primitive e-waste processing facilities was investigated. The pollution is due to high concentrations of metals present in the surrounding soils and vegetables. The highest enrichment factor values due to e-waste wastewater and waste discharges were found at Anqiaotou Village and Beian Village. Vegetables from the vicinity of the e-waste processing sites were found to have higher heavy metal pollution index values in comparison with those from the background site. The bioaccessibilities of heavy metals were decreased in the order of Cd > Pb > Sn > Zn > Ni > Cr. The e-waste processing site was badly polluted by Cd, Pb, Zn, Ni and Cr, with its pollution level decreased in the following order: Cd > Pb > Cr > Ni > Zn > Sn. Additionally, the greatest risk among six metals in the e-waste processing areas is caused by Cd and Pb. The risks associated with the consumption of contaminated vegetables grown in e-waste processing regions may be a potential health concern.
Introduction
The management of electronic wastes (e-wastes) has received a great deal of attention among scientists and the general public for several decades (Tanskanen Citation2013). Large numbers of scattered e-waste recycling workshops were abandoned without adequate attention and subsequent management, which in fact has facilitated the release of hazardous chemicals into the surroundings, including heavy metals (Tian et al. Citation2011; Wang et al. Citation2011a, Citation2011b). Dietary intake of heavy metals also poses risk to animals and human health. Heavy metals such as Cd and Pb have been shown to have carcinogenic effects (Trichopoulos Citation1977). High concentrations of heavy metals (Cd, Pb and Cu) in fruits and vegetables were related to high prevalence of upper gastrointerestinal cancer (Turkdogan & Kilicel Citation2002). The operations commonly used in processing e-waste in order to extract precious metals, such as strong acid leaching and the open burning of dismantled components, has led to the release of large quantities of toxic metals and organic pollutants into the surrounding environment. The air, surface water, ground water, soil and river sediment of e-waste processing sites have been severely contaminated by heavy metals, such as Cd, Cu and Pb. The laborers dismantling discarded electronic items and local residents may be seriously affected through direct inhalation and dermal contact with these contaminants. Strikingly a high concentration of 100 μg /L–1 lead was found (Peng et al. Citation2005; Huo et al. Citation2007). E-waste processing sites are usually located in fields adjacent to land used for agricultural purposes (Zhang & Ye Citation2014). Heavy metals released from salvaging useful materials and from the uncontrolled open burning of electronic waste could penetrate the soils where vegetables and crops were grown by contaminating irrigation water and through direct deposition by air (Luo & Liu Citation2011). In this study, we collected soil and vegetable samples from a site where an abandoned e-waste recycling plant in Changzhou, Jiangsu province, the levels of heavy metals were investigated in and near the abandoned e-waste recycling site, the risks associated with the consumption of contaminated vegetables grown in e-waste processing regions may be a potential health concern. The data will be valuable to scientists and policy-makers to comprehend the legislation to deal with the regulation of e-wastes.
Materials and methods
Sample collection and pretreatment
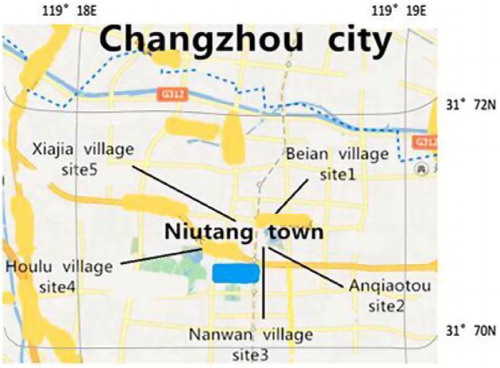
The samples, including soil and five vegetables were collected in August, 2014, from an e-waste recycling site in Niutang town Changzhou, China (between 119°18 and 119°19 E and between 31°70 and 31°72 N), and the five sampling sites are shown in .
Figure 1. Study area and the sampling sites (map scale:1:50).
Heavy metal pollution index (HPI)
To compare the total heavy metal load through vegetables at different sampling locations, heavy metal pollution index (HPI) was calculated using the equation given by Usero and Gonza-Regalado (Citation1997).(1)
where Cf is the concentration of n heavy metals in vegetable samples.
Bioaccessibility of the heavy metals in the soils
Bioaccessibility (BA) of heavy metals was estimated using the in vitro gastrointestinal method with modification (Rodriguez et al. Citation1999; Man et al. Citation2010; Kang et al. Citation2011).The BA (%) of each heavy metal in samples from the e-waste processing areas was calculated using Equation (2) (Lu et al. Citation2011).(2) where CI is the extractable heavy metal in the stomach phase and intestine phase (mg L–1); VI is the volume of the extractant in the reaction vessel (L); Cs is the total heavy metal concentration in the samples (mg kg–1); Ms is the mass of samples extracted (kg).
Risk assessment of soils
The Nemerow pollution index (PN) can reflect the impact of heavy metal pollutants on sediment environment and is widely used for assessing the overall pollution status of sediments with heavy metals (Hu et al. Citation2013). PN was calculated as(3)
(4) where Pi is the pollution index for a single pollutant; Ci and Cb are the measured concentration of a heavy metal in sediment and its background value, respectively. Pimax and Piave are the maximum and average pollution indices of an individual heavy metal, respectively. The degrees of heavy metal pollutions in the sediments can be classified into the following categories: Not polluted: PN ≤ 1.0; Slightly polluted: 1.0 b PN ≤ 2.0; Moderately polluted: 2.0 < PN ≤ 3.0 and Heavily polluted: PN > 3.0.
Estimated daily intake of heavy metals from vegetables
The estimated daily exposure to metals (EDEM) through vegetables was dependent on metal concentrations in vegetables, daily vegetable consumption, as well as body weight, which was calculated with the following formula: EDEM = DIM/BW (5), where DIM is the daily intake of metals and BW the body weight. Where the average daily intake of metals in 345 g of vegetables per day for adult residents was used (Khan et al. Citation2008; Liu et al. Citation2009), and the body weight of an adult and children resident was set to 60 and 30 kg in the present study, respectively.
Health risk assessment
The health risk associated with the consumption of vegetables was defined as the ratio of the estimated daily intake of metals to the reference dose oral (RfDo) for each metal (Granero & Domingo Citation2002; U.S. Citation2002), as in the following equation: RI = EDEM/RfDo (6), where RfDo represents safe levels of exposure by oral intake for a lifetime (U.S. Citation2002). If the risk index was less than 1, no obvious risk is involved. If the risk index was equal to or higher than 1, there is a potential health risk, and related interventions and protective measurements should be taken.
Non-carcinogenic health risk estimation
The non-cancer hazard is expressed as a ratio of the concentration of a toxicant in the environmental matrix to the recommended safety level of that compound, termed as hazard quotient (HQ) (Zhang & Ye Citation2014). The equations to estimate HQ are as follows: HQ = ADD/RfDo (7); ADD = C×IR×ED×EF/BM×AT (8), where the ADD is the average daily dose; RfDo is reference dose; C is the mean metal concentration (mg kg–1); IR is the conservative estimates of ingestion rates (mg day–1); ED is exposure duration (years); BM is the body weight (kg); EF represents the exposure frequency (days year–1) and AT is average exposure time (days).
Toxic equivalency (TEQ)of heavy metals
Toxic equivalency factors (TEFs) are being developed to assess the potency of heavy metals, and are essentially weighting factors. Toxic equivalents (TEQs) can be obtained through the following equation: . HMi is a certain kind of heavy metals; The World Health Organization Consultation recommends the TEF approach, applying the recently established WHO TEFs for estimating the weekly intake in human of heavy metals (Van den Berg et al. Citation2006).
Statistical analysis
The data were statistically analyzed using the statistical package, SPSS19.0 (SPSS, USA). A variance analysis (p < .05) of total metal concentrations among different sampling sites was performed using a one-way ANOVA test (Tukey honestly significant difference). Two-sample t-tests were employed to examine the statistical significance of the differences in the mean concentrations of heavy metals among different vegetable samples. The correlation analysis was conducted by a Pearson correlation, and the level of significance was set at p < .05.
Results and discussion
Heavy metals enrichment in soils
Enrichment factor (EF) is a useful tool in determining the degree of anthropogenic heavy metal pollution. EF is commonly defined as the observed metal-to-aluminum (Al) ratio in the sample of interest divided by the background metal/Al ratio. The EF was simply calculated as EF = (Me/Al)sample/(Me/Al)background. According to Sakan et al. (Citation2009), EF values between 0 and 1 indicate that the metal is entirely from crustal materials or natural processes, whereas EF values higher than 1 suggest that the sources are more likely to be anthropogenic. In the study, the mean EF values of the soils revealed that Zn and Cr < 3, indicating a ‘minor enrichment’. The EF values of Ni was between 3 and 5, indicating a ‘moderate enrichment’. The EF values of Pb, Cd and Sn > 5 indicate a ‘moderately severe to severe enrichment’ in the e-waste processing sites, suggesting an anthropogenic impact on the metal levels in the e-waste processing areas. The highest EF values were found at Anqiaotou village (Site2) and Beian village (Site1) due to e-waste waste discharges.
Heavy metal concentrations in vegetables
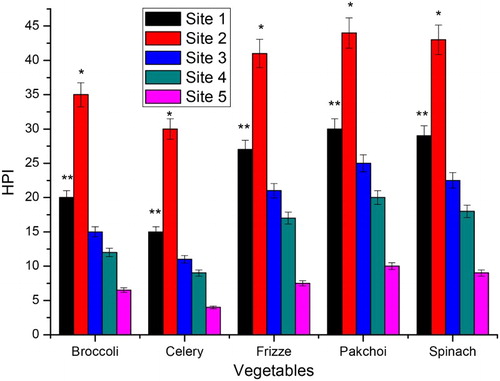
Metal pollution indices for each of the five vegetables were calculated and the results are represented in . Overall, vegetables from the vicinity of the e-waste processing sites were found to have higher HPI values when compared to those from the background site. HPI values ranged from 2.8 to 12.6 in the background vegetables and from 11.5 to 44.3 in those sampled from the vicinity of the e-waste processing sites. E-waste processing sites samples of pakchoi, frizze, broccoli, celery and spinach showed 501%, 356%, 287%, 298% and 496% higher HPI values, respectively, than the background samples. Among different vegetables, pakchoi and spinach exhibited higher HPI values. However, relative increases in HPI in these vegetables with respect to samples were the lowest among test vegetables. This indicates the relatively lower enrichment of metallic species in these vegetables when compared to that in background samples but absolutely higher health risks due to increased metal accumulation. Vegetable samples from Anqiaotou village (Site2) exhibited highest HPI values in all the test vegetables. The Site2 was chosen to be at the lower reach of Xiangyu river, 1.5 km away from the Xiangyu recycled resources Ltd. of Changzhou, and to be in the vicinity of the G312 Expressway. Moreover, large-scale biomass burning is practised at this site due to its sub-urban nature, which could have influenced the observed metal levels. The impact of biomass burning on metallic emissions was vindicated by the comparatively high accumulation of heavy metals in all vegetables from Site2. Of all of the vegetables that were tested, the concentrations of heavy metals in the edible part of leafy vegetables were significantly higher than in the edible portion of roots/tuberous vegetables (p < .05), which was in agreement with previous reports (Stalikas et al. Citation1997; Zheng et al. Citation2007). Leafy vegetables usually grow quickly and have high transpiration rates. This favors the uptake of metals by roots, and the resulting translocation of metals from roots to above ground tissues.
Figure 2. HPI of various vegetables collected in the e-waste sites (n = 6; *p < .05; ** p < .01).
BA of the heavy metals in the soils
The bioaccessibilities of the heavy metals in soil from the e-waste processing areas are shown in , and it can be seen that the bioaccessibilities of heavy metals were decreased in the order of Cd > Pb > Sn > Zn > Ni > Cr. The largest BA of Cd (81.08%) and Pb (72.31%) was found in all samples in the e-waste processing areas. It is known that higher solubility for heavy metals would be found in the acid environment in gastric phase than in neutral or weak alkaline environment in intestinal phase, as they will be assimilated at higher pH, the lower BA of Ni and Cr would be attributed to their higher affinity to pepsin in intestinal juice compared to other heavy metals and metal binding competition between pepsin and carbonates (Poggio et al. Citation2009; Li & Kang Citation2015).
Figure 3. BA of heavy metals in soil from e-waste sites (n = 6; *p < .05).
Risk assessment of soils
The results of Nemerow pollution index are shown in . On the one hand, the Nemerow pollution indices for the Site1 (Beian village), Site2 (Anqiaotou village), Site3 (Nanwan village), Site4 (Houlu village) and Site5 (Xiajia village) from the e-waste processing areas were 1835, 2612, 1938, 1722 and 1567, respectively. The results showed that the pollution levels of the Site1, Site2, Site3, Site4 and Site5 from the e-waste processing areas were seriously polluted and decreased in the order of Site2 > Site3 > Site1 > Site4 > Site5. The results were similar to the above findings. On the other hand, the e-waste processing sites were the most polluted with heavy metals Cd and Pb with the exception of Zn, Ni, Sn and Cr. The e-waste processing site was slightly contaminated with Sn, with a Nemerow pollution index of 0.9. The Nemerow pollution indices of Cd, Pb, Zn, Ni and Cr were 567, 421, 8.3, 12.6, and 31.7, respectively. These Nemerow pollution indices were considerably higher than 3, suggesting that the e-waste processing site was badly polluted with Cd, Pb, Zn, Ni and Cr, and that its pollution level decreased in the following order: Cd > Pb > Cr > Ni > Zn > Sn.
Table 1. Nemerow pollution indices of soils from the e-waste processing sites (n = 6; HP, heavily polluted).
Health risk assessment for vegetable consumption
The accumulation of metals in the edible parts of vegetables could have a direct impact on the health of nearby inhabitants, because vegetables produced from gardens were mostly consumed locally (Luo & Liu Citation2011). Therefore, the concentration of metal contaminants in vegetables could be a concern to the locals, the heavy metals risk for these locals was calculated on the basis of the oral reference dose being 0.5 g kg−1 d−1 for Cd, 3.5 g kg−1 d−1 for Pb, 300 g kg−1 d−1 for Zn, 40 g kg−1 d−1 for Cr (JECFA Citation1993; U.S Citation2002; Luo & Liu Citation2011). The risk index was in the descending order of Cd > Pb > Cr > Ni > Zn > Sn. The risk index for Cd and Pb was higher than 1, while the risk indexes for Cr, Ni, Zn and Sn were less than 1 (). The result indicates that those living around the e-waste processing area were probably exposed to some potential health risks through the intake of Cd and Pb via consuming locally grown vegetables. For Cr, Ni, Zn and Sn, there was no significant risk from the intake of vegetables. When determining the risk index, it was assumed that the intake is equal to the absorbed dose (US Citation1989), which may magnify the effect of the ingested contaminants to some extent because part of the heavy metals that were ingested may be egested (Horiguchi & Oguma Citation2004; Luo & Liu Citation2011). From this point of view, it was reasonable that obvious adverse health effects from exposure to the heavy metals could be observed on those living around the e-waste processing area. Therefore, it may be speculated that the vegetables produced around the studied e-waste recycling sites could be a significant source of Cd and Pb to local residents. The exposure to two or more pollutants from consuming vegetables may result in additive effects (Hallenbeck Citation1993). Since the mere intake of metals through dietary means exerted much negative influence, the potential health risks involved in the consumption of local food should not be ignored.
Table 2. The DMI and the HRI for the vegetables from the e-waste processing sites (n = 6).
Computed daily metal intake (DMI) from e-waste recycling sites vegetables was higher than that from background vegetables for all the metals. A health risk index (HRI) less than 1 indicates that the exposed population could be assumed to be safe. All test vegetables from vicinity of e-waste recycling sites had HRI values higher than the safe limit for Cd and Pb; HRI values for Zn exceeded the safe limit for pakchoi (0.73), frizze (0.68), broccoli (0.85), celery (0.76) and spinach (0.74) samples from e-waste recycling sites. Celery samples from e-waste recycling sites was beyond the HRI safe limits with respect to Cd (1.12), Pb (2.23), Zn (2.36), Ni (1.36), Cr (2.89) and Sn (2.15) while its background samples, alarmingly, violated HRI limits with respect to Cd (3.38), Pb (2.87), Zn (5.36), Ni (2.39), Cr (3.52) and Sn (3.17). Celery (a member of Umbelliferae family) has been shown to accumulate highest amounts of heavy metals in a greenhouse study by Yang et al. (Citation2011). Similarly, in another study by Diego Baderna (Citation2015), celery samples exhibited higher concentrations of Cd, Pb, Zn, Cr and Hg among samples of Cucumber (Cucumis sativus), sorghum (Sorghum saccharatum) and cress (Lepidium sativum) grown along the sites of urban and rural areas in Italian. Such findings indicate that transport of pollutants can also result in considerable pollution at remote/background locations and contribute substantially to health risks. HRI of all vegetables from e-waste recycling sites were within safe limits with reference to Sn. Provisional tolerable daily intakes (PTDIs) of a 70 kg weighing adult for Cd, Cu and Zn are 0.07, 35 and 70 mg, respectively (JECFA Citation1993). The study showed that the contributions of the test vegetables collected from the e-waste recycling sites to the daily intake of Cd, Pb, Zn, Ni, Cr and Sn of the PTDIs were 38.6%, 21.5%, 32.6%, 10.7%, 8.6% and 2.3%, respectively, and that the contributions of the vegetables from the background site to the daily intake of Cd, Pb, Zn, Ni, Cr and Sn of the PTDIs were 5.6%, 1.5%, 2.6%, 0.9%, 0.6% and 0.7%, respectively.
Non-cancer health risk assessment
The potential human health risk was calculated using the HQ from the metal levels in soil heavy. (a) indicates that the greatest risk among six metals in the e-waste processing areas is caused by Cd and Pb. The risk to adults contributed by Cd, Pb and Cr was high (HQ > 10), the risk from Ni was moderate (HQ = 7.1) and the risk from Zn and Sn was minimal (HQ < 1). The HQs for Cd, Pb, Cr, Ni, Zn and Sn were 12.5, 16.3, 10.5, 7.1, 0.4 and 0.06, respectively, in the e-waste processing areas. All six metals except Sn (1 < HQ < 10) posed a high risk to children (HQ > 10) ((b)). The risks caused by Ni and Zn were moderate, the risk caused by Sn was minimal and the risks caused by Cd, Pb and Cr were high. The TEQ values from the six metals were used to determine the potential threat to residents. The TEQ value ranged from 0.03 to 3.4 ng g–1 (mean level of 0.57 ng g–1). The maximum and minimum TEQ values were 3.4 and 0.03 ng g–1, respectively, in the near e-waste processing areas and away from processing areas. The TEQ value in the near e-waste processing area was higher than the tolerable daily intake (TDI) of 2 ng TEQ g–1 bw that was set by the European Commission in 2001 but was equal to the TDI value established by the WHO in 1998 (1–4 ng TEQ g–1 bw) (WHO Citation1998).
Figure 4. Non-carcinogenic exposure risks to adults and children via ingestion of vegetables for adults (a) and children (b) (n = 6; *p < .05).
Acknowledgements
The Priority Academic Program Development of Jiangsu Higher Education Institutions. We are indebted to Jiahong Wang and Wenzhou Lv for exemplary technical assistance and Xingyu Yang for valuable support on statistical analysis.
Disclosure statement
No potential conflict of interest was reported by the authors.
Notes on contributors
Zhaoxiang Han entered Northwest Agriculture and Forest Science and Technology University in 1999 and graduated with a master's and doctor's degree in environmental ecology in 2004. Since then he has been working as a university teacher in School of Chemical Engineering, Huaihai institute of Technology. He has been interested in environmental ecology and environmental toxicology since he was quite young. He is tutor for environmental science field. He has published more than 60 papers, and emceed 2 items at the National Nature Science Foundation of China, served as editor in chief for 1 teaching material, and patented 3 items.
Ning Wang graduated Huaihai institute of Technology in 2011 and then entered Jiangsu University for a master's degree in environmental ecology in 2015.
Hailiang Zhang graduated with a master's and doctor's degree in environmental ecology and he has been working as a university teacher in School of Chemical Engineering, Huaihai institute of Technology. He has been interested in environmental ecology and environmental toxicology since he was quite young. He is tutor for environmental science field.
Xingyu Yang has graduated Huaihai institute of Technology and is going to a master's degree in environmental ecology.
Additional information
Funding
References
- Diego Baderna EL. 2015. Acute phytotoxicity of seven metals alone and in mixture: are Italian soil threshold concentrations suitable for plant protection. Environ Res. 40:102–111. doi: 10.1016/j.envres.2015.03.023
- Granero S, Domingo JL. 2002. Levels of metals in soils of Alcalá de Henares, Spain: human health risks. Environ Int. 28:159–164. doi: 10.1016/S0160-4120(02)00024-7
- Hallenbeck WH. 1993. Quantitative risk assessment for environmental and occupational health. Boca Raton: CRC Press.
- Horiguchi H, Oguma E. 2004. Dietary exposure to cadmium at close to the current provisional tolerable weekly intake does not affect renal function among female Japanese farmers. Environ Res. 95(1):9520–9531. doi: 10.1016/S0013-9351(03)00142-7
- Hu Y, Liu X, Bai J, Shih K. 2013. Assessing heavy metal pollution in the surface soils of a region that had undergone three decades of intense industrialization and urbanization. Environ Sci Pollut Res. 20:6150–6159. doi: 10.1007/s11356-013-1668-z
- Huo X, Peng L, Xu XJ, Zheng LK, Qiu B. 2007. Elevated blood lead levels of children in Guiyu, an electronic waste recycling town in China. Environ Health Perspect. 115:1113–1117. doi: 10.1289/ehp.9697
- Joint FAO/WHO Expert Committee on Food Additives (JECFA). 1993. Evaluation of certain food additives and contaminants: 41st report of the Joint FAO/WHO expert Committee on Food Additives. Geneva: World Health Organization. Technical Reports Series No. 837.
- Kang Y, Chueng KC, Wong MH. 2011. Mutagenicity, genotoxicity and carcinogenic risk assessment of indoor dust from three major cities around the Pearl River Delta. Environ Int. 37:637–643. doi: 10.1016/j.envint.2011.01.001
- Khan S, Cao Q, Zheng YM, Huang YZ, Zhu YG. 2008. Health risks of heavy metals in contaminated soils and food crops irrigated with wastewater in Beijing, China. Environ Pollut. 152:686–692. doi: 10.1016/j.envpol.2007.06.056
- Li N, Kang Y. 2015. Concentration and transportation of heavy metals in vegetables and risk assessment of human exposure to bioaccessible heavy metals in soil near a waste-incinerator site, South China. Sci Total Environ. 521–522:144–151. doi: 10.1016/j.scitotenv.2015.03.081
- Liu CP, Luo CL, Gao Y, Li FB, Lin LW, Wu CA. 2009. Arsenic contamination and potential health risk implications at an abandoned Tungsten mine, Southern China. Environ Pollut. 158:820–826. doi: 10.1016/j.envpol.2009.09.029
- Lu Y, Yin W, Huang L, Zhang G, Zhao Y. 2011. Assessment of bioaccessibility and exposure risk of arsenic and lead in urban soils of Guangzhou City, China. Environ Geochem Health. 33:93–102. doi: 10.1007/s10653-010-9324-8
- Luo CL, Liu CP. 2011. Heavy metal contamination in soils and vegetables near an e-waste processing site, south China. J Hazard Mater.186:481–490. doi: 10.1016/j.jhazmat.2010.11.024
- Man YB, Sun XL, Zhao YG. 2010. Health risk assessment of abandoned agricultural soils based on heavy metal contents in Hong Kong, the world’s most populated city. Environ Int. 36:570–576. doi: 10.1016/j.envint.2010.04.014
- Peng L, Huo X, Xu XJ, Zheng Qiu YB. 2005. Effects of electronic waste recycling disposing contamination on children’s blood lead level. J Shantou Univ Med Coll. 18:48–50.
- Poggio L, Vrščaj B, Schulin R, Hepperle WE, Marsan FA. 2009. Metals pollution and human bioaccessibility of topsoils in Grugliasco. Environ Pollut. 157:680–689. doi: 10.1016/j.envpol.2008.08.009
- Rodriguez RR, Basta NT, Casteel SW, Pace LW. 1999. An in vitro gastrointestinal method to estimate bioavailable arsenic in contaminated soils and solid media. Environ Sci Technol. 33:642–649. doi: 10.1021/es980631h
- Sakan SM, Djordjevic DS, Manojlovic DD, Polic PS. 2009. Assessment of heavy metal pollutants accumulation in the Tisza river sediments. J Environ Manage. 90:3382–3390. doi: 10.1016/j.jenvman.2009.05.013
- Stalikas CD, Chaidou CI, Pilidis GA. 1997. Enrichment of PAHs and heavy metals in soils in the vicinity of the lignite-fired power plants of West Macedonia (Greece). Sci Total Environ. 204:135–146. doi: 10.1016/S0048-9697(97)00156-3
- Tanskanen P. 2013. Management and recycling of electronic waste. Acta Mater. 61:1001–1011. doi: 10.1016/j.actamat.2012.11.005
- Tian M, Chen SJ, Wang J, Shi T, Luo XJ, Mai BX. 2011. Atmospheric deposition of halogenated flame retardants at urban, e-waste, and rural locations in southern China. Environ Sci Technol. 45:4696–4701. doi: 10.1021/es200112m
- Trichopoulos D. 1997. Epidemiology of cancer. In: DeVita VT, editor. Cancer: principles and practice of oncology. Philadelphia (PA): Lippincott Company; p. 231–258.
- Turkdogan MK, Kilicel F. 2002. Heavy metals in soil, vegetables and fruits in the endemic upper gastrointestinal cancer region of Turkey. Environ Toxicol Pharmacol. 13:175–179. doi: 10.1016/S1382-6689(02)00156-4
- US EPA. 1989. Risk assessment guidance for superfund, Human Health Evaluation Manual Part A, Interim Final, vol. I. 7. Washington (DC): United States Environmental Protection Agency. EPA/540/1-89/002.
- U.S. Environmental Protection Agency (USEPA), Region9. 2002. Preliminary remediation goals. Available from: http://www.epa.gov/region09/waste/sfund/prg
- Usero J, Gonza-Regalado E. 1997. Trace metal in the bivalve molluscs Ruditapes decussatus and Ruditapes philippinarum from the Atlantic Coast of Southern Spain. Environ Int. 23(3):291–298. doi: 10.1016/S0160-4120(97)00030-5
- Van den Berg M, Birnbaum LS, Denison M, De Vito M, Farland W, Feeley M, Fiedler H, Hakansson H, Hanberg A, Haws L, et al. 2006. The 2005 world health organization reevaluation of human and mammalian toxic equivalency factors for dioxins and dioxin-like compounds. Toxicol Sci. 93:223–241. doi: 10.1093/toxsci/kfl055
- Wang Y, Luo CL, Li J, Li XD, Zhang G. 2011a. Characterization of PBDEs in soils and vegetations near an e-waste recycling site in South China. Environ Pollut. 159:2443–2448. doi: 10.1016/j.envpol.2011.06.030
- Wang Y, Luo CL, Li J, Yin H, Li XD, Zhang G. 2011b. Characterization and risk assessment of polychlorinated biphenyls in soils and vegetations near an electronic waste recycling site, South China. Chemosphere. 85:344–350. doi: 10.1016/j.chemosphere.2011.06.096
- WHO. 1998. Assessment of the health risk of dioxins: Re-evaluation of the Tolerable Daily Intake (TDI), WHO European Centre for Environment and Health, International Programme on Chemical Safety, WHO Consultation. Geneva: WHO European Centre for Environment and Health.
- Yang YM, Zh G, Nana ZJ. 2011. Bioaccumulation and translocation of cadmium in cole (Brassica campestris L.) and celery (Apium graveolens) grown in the polluted oasis soil, Northwest of China. J Environ Sci. 23(8):1368–1374. doi: 10.1016/S1001-0742(10)60580-3
- Zhang Q, Ye JJ. 2014. Risk assessment of polychlorinated biphenyl s and heavy metals in soils of an abandoned e-waste site in China. Environ Pollut. 185:258–265. doi: 10.1016/j.envpol.2013.11.003
- Zheng N, Wang Q, Zheng D. 2007. Health risk of Hg, Pb, Cd, Zn, and Cu to the inhabitants around Huludao zinc plant in China via consumption of vegetables. Sci Total Environ. 383:81–89. doi: 10.1016/j.scitotenv.2007.05.002