
ABSTRACT
Spatial variations in yield occur in all agricultural fields to some degree. Knowledge of the reasons for these variations, especially temporally stable yield patterns, is needed in order to improve productivity by changing production methods or inputs. This information must be provided in a simple, cost-effective way. This study investigated whether field-scale measurements of penetration resistance (PR) could identify temporally stable yield patterns without complementary measurements of other properties. The PR measurements were also compared with field-scale apparent electrical conductivity (ECa) measurements and correlations between yield and PR and yield and ECa were investigated. Measurements with a newly constructed horizontal penetrometer and a non-invasive proximal electromagnetic induction sensor were carried out in three fields in east-central Sweden. The measurements were made once in each field, apart from one field where PR was measured twice in one season. The sensor measurements were compared with crop yield measured over the course of several years. The horizontal penetrometer was able to identify low-yielding areas in one field. However, single measurements of PR or ECa were insufficient to consistently identify yield variations. Parts of the fields showed more consistent patterns, with stronger correlations between PR, ECa and yield. PR and ECa data were better at explaining yield variations in drier years, but showed diverging patterns in different fields and neither showed a much stronger correlation to yield than the other. In future studies, simultaneous measurement of soil water content is recommended and also PR measurements at a water content drier than field capacity.
Introduction
Crop yield within an arable field is typically not uniform, but shows considerable spatial variation. While some of this within-field variation can be explained by management operations (e.g. fertilisation) and micro-climatic conditions that may vary from year to year, the variation may also show temporally stable patterns. The latter are usually associated with properties and conditions that do not change over seasonal timescales, including elevation, slope, aspect and soil texture (Machado et al. Citation2002; Basso et al. Citation2007). However, yield patterns may also result from (management-induced) differences in soil structure within a field. Temporally stable yield patterns could be caused by differences in subsoil structure (e.g. Keller et al. Citation2012). Cereal yield is affected by subsoil conditions (Håkansson et al. Citation1987). It has been shown that the structure in the subsoil, i.e. below tillage depth, is fairly stable over timescales of decades (Vachaud et al. Citation1985; Schlüter et al. Citation2011; Raczkowski et al. Citation2012). This is evident in studies on subsoil compaction, which report very slow recovery during decades (Peng and Horn Citation2008; Berisso et al. Citation2012, Citation2013) or even centuries (Webb Citation2002). Schlüter et al. (Citation2011) found that the structural properties of subsoils were not affected by different fertilisation treatments in the Bad Lauchstädt long-term experiment even after more than 100 years. Hence, measurements of subsoil structure properties at high spatial resolution within a field could reveal causes of within-field yield variation. This information could then be used to optimise productivity by targeted field management.
A quick and simple measure of the spatial distribution of physical differences in the soil is penetration resistance (Hartge et al. Citation1985). PR is a direct measure of the mechanical impedance experienced by plant roots, and hence provides information on the physical conditions for plant growth. Penetration resistance is therefore considered an integral measure of soil physical status with respect to root growth (Hartge et al. Citation1985), which makes the penetrometer a promising tool for identifying within-field variation in the soil physical conditions encountered by roots.
Measurements of horizontal penetrometer resistance can be combined with crop yield maps for identifying areas where the yield is limited by soil physical constraints. However, field-scale measurements of PR and knowledge of the implications for yield are scarce (Lapen et al. Citation2001; Pringle and Lark Citation2007; Sun et al. Citation2013), and most investigations using field-scale mapping of soil strength focus on finding correlations between PR and other soil physical properties (Vaz et al. Citation2001; Sirjacobs et al. Citation2002; Kilic et al. Citation2004; Boon et al. Citation2005; To and Kay Citation2005; Naderi-Boldaji et al. Citation2013).
A method that is widely used for mapping within-field soil variability is apparent electrical conductivity (ECa) measurements (Banton et al. Citation1997; Corwin and Lesch Citation2005). Similarly to PR, ECa is affected by soil water content (Sheets and Hendrickx Citation1995; Johnson et al. Citation2001; Carroll and Oliver Citation2005), texture, organic matter and bulk density (Khakural et al. Citation1998; Johnson et al. Citation2001; Carroll and Oliver Citation2005). Therefore ECa and PR could be expected to show similar within-field patterns. However, it is not obvious whether ECa and PR measurements provide redundant information or whether they are complementary, i.e. whether combined ECa and PR measurements could help explain within-field yield patterns. In addition, ECa is dependent on salinity and temperature (Freeland Citation1989; Johnson et al. Citation2001). Furthermore, ECa measurements usually integrate over a certain depth and therefore give information on a larger soil volume than PR measurements, making it more difficult to identify the depth and thickness of yield-limiting soil layers. PR, on the other hand, is measured at specific depths, but involves only a relatively small volume of soil.
In a previous investigation on crop yield dependence on different soil physical properties in a field in east-central Sweden, we measured a range of soil physical properties at 20 points within one field and identified penetration resistance as the measurement best explaining yield variation (Bölenius et al. Citation2017). The present investigation expanded that point study to entire fields, and tested the hypothesis that subsoil measurements from one year can be used to explain within-field yield variation over the course of several years.
The objectives of the present study were threefold: 1) to evaluate the capability of a newly constructed horizontal penetrometer for mapping field-scale PR, 2) to investigate whether field-scale measurements of PR can identify yield-limiting field areas and 3) to compare the PR measurements with field-scale ECa measurements. All measurements were conducted in three fields on two different farms in east-central Sweden.
Materials and methods
Studied fields
The field studies were carried out in Uppland county, on a 27 ha field at Kvarnbo farm (59°50′N, 17°32′E) and on two fields (25 ha and 18 ha in size, respectively) at Bona-Wäsby farm (59°24′N, 17°34′E). Mean annual precipitation (standard 30-year average) is approximately 530 mm at Kvarnbo and 480 mm at Bona-Wäsby and mean annual temperature is 5.6°C and 7.1°C, respectively. All precipitation and temperature data were provided by the Swedish Meteorological and Hydrological Institute.
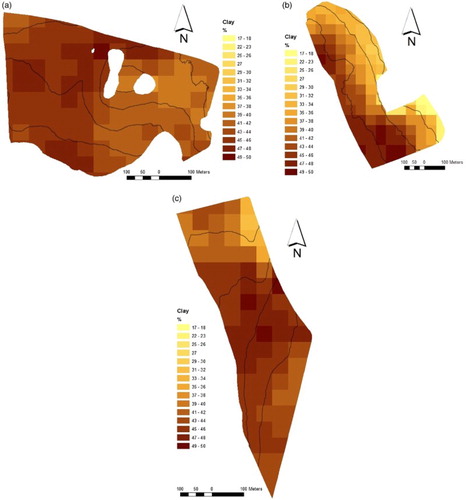
The field at Kvarnbo has a clay soil (field henceforth called Kvarnbo-clay), while at field 1 at Bona-Wäsby has a clay soil (BonaWäsby-clay) and field 2 has clay loam (BonaWäsby-clayloam) (). Soil texture data across the entire fields were obtained from the Digital Soil Map of Sweden (DSMS) (Piikki et al. Citation2017). Kvarnbo-clay has post-glacial clay on most of the field except around non-arable outcrops and in the north-east corner (SGU, Citation2016). BonaWäsby-clay has post-glacial clay except in the south-eastern corner, which has post-glacial sand. BonaWäsby-clayloam has post-glacial clay on the southern half and glacial clay on the northern half (). Elevation data were obtained from Geografiska Sverigedata (GSD), GRID 2 elevation model, which is based on national laser scannings and has a resolution of 2 metres with an accuracy of 0.1 m vertically and 0.3 m horizontally (Lantmäteriet, Citation2016).
Figure 1 Clay content at (a) K cl, (b) BW cl and (c) BW cl l. The 7.5 ha area investigated by Bölenius et al. (Citation2017) within the K cl field is indicated in a) with white lines
All three fields were managed in a reduced tillage regime, both before and during the study period. The rooting depth for cereals in Swedish clay soils is typically 100–140 cm (Wiklert Citation1961). A simple root study was conducted on one of the fields involved in our study (data not published) which confirmed the general rooting depths by Wiklert.
In a previous investigations of crop yield, PR and several other soil physical properties at 20 locations within a 7.5 ha area in the Kvarnbo-clay field, PR best explained yield variation (r = −0.45 to −0.66) (Bölenius et al. Citation2017). Based on these findings, the relationships were examined between yield and PR within an area of several hectares rather than just a number of points. Hence, in the present study crop yield and penetration resistance were measured within the entire 7.5 ha study area.
Horizontal penetrometer
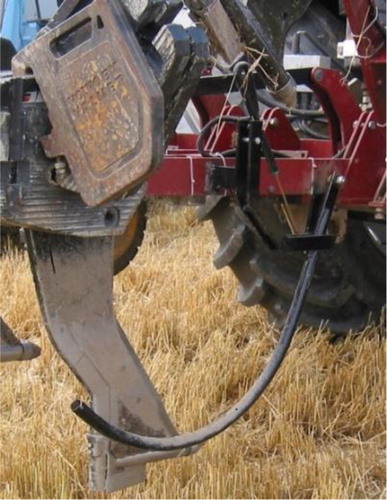
A four-share parallel plough was modified to support three parallel, horizontally mounted, soil penetrating cones (). The cone angle was 60° and the cone diameter 63 mm. The horizontal design was chosen because a horizontal penetrometer allows fast measurements in a large area. Using a penetrometer rather than another soil strength measurement tool, such as draught force measurements, gives the advantage of obtaining a well-known parameter (penetration resistance) at specific depths, while e.g. draught force measurements integrate the forces over a depth range from the soil surface to the tillage depth. The cone in the present case was connected via a rod to a Bosch draught sensor capable of registering forces between −25 kN and + 25 kN. The sensor output voltage was converted to force, based on calibrations performed for each draught sensor separately. The horizontal penetrometer was capable of measuring soil penetration resistance at three depths (10, 30 and 50 cm). Measurements were made at 1000 Hz, but for further analyses the signal was averaged to 1 Hz. Speed and position were recorded every second with a Trimble SweeEight GPS. The penetrometer was equipped with a stone release mechanism and a simple system to record actual working depth every second. A curved metal pipe, following the soil surface (), was connected to a potentiometer attached to the metal frame. Depending on the angle, a voltage was measured and converted to depth by first calibrating the potentiometer against a flat surface. Penetrometer measurements in all three fields were made at a speed of approximately 1.5 m s−1 (5 km h−1).
Figure 2. Detailed picture of a soil penetrating cone, mounted soil penetrating cone and all three soil penetrating cones.
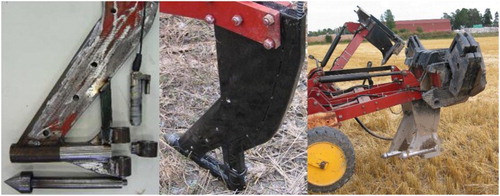
Figure 3. The depth measuring system. The curved metal pipe followed the soil surface and was attached to the metal frame. The angle was measured and from that the depth of the cones could be calculated.
Field measurements
Crop yield
Crop yield was measured by commercial combine harvesters. Yield data were available for 1996–2000 and 2004 for Kvarnbo-clay, 2008 and 2013 for BonaWäsby-clay and 2007, 2008, 2012 and 2013 for BonaWäsby-clayloam. The crops grown on each field are listed in .
Table 1. Crops grown at the three fields; one at Kvarnbo farm (Kcl) and two at Bona-Wäsby farm (BWcl and BWcl l). Crops in italic were not monitored
Horizontal penetrometer measurements
The horizontal penetrometer was tested in the 7.5-ha study area in Kvarnbo-clay in spring 2004. PR measurements were then conducted on the whole Kvarnbo-clay field in April and August 2004. At Bona-Wäsby, the PR measurements were performed in May 2008 BonaWäsby-clay and in May 2009 at BonaWäsby-clayloam. The penetrometer was used at 30 and 50 cm depth. The 30 cm depth was used on all measuring occasions but, because of problems with stones, the 50 cm depth was only included in spring 2004 at Kvarnbo-clay. Measuring at 10 cm was excluded based on unstable measuring results due to soil breakage in front of the cone. PR was measured along transects, 10–12 m apart at Bona-Wäsby and 10–40 m apart at Kvarnbo (different on different measuring occasions). This resulted in approximately 650–700 measurement points per hectare at Bona-Wäsby and 250–400 measurement points per hectare at Kvarnbo. Only PR measurement points with corresponding speed measurements between 4 and 5 km/h and depth measurements of ± 5 cm from intended depth were retained, resulting in about 10% of measurements being discarded. PR measurements from just before sudden stops (usually when hitting stones) were removed manually. The measurements were carried out in the spring at early crop stage or in the autumn after harvest, at water contents close to field capacity. Directly after measuring in the growing crop there was some crop damage, but no effect could be observed later on in the season.
Apparent electrical conductivity measurements
ECa was measured using an EM38 electromagnetic induction sensor (Geonics Ltd, Mississauga, Ontario, Canada). The horizontal dipole orientation was used in all three fields, resulting in approximately 70% of the signal coming from the 0–0.8 m depth. This measurement configuration was chosen so that the PR measurements came from the centre of the depth range of the EM38 device. ECa measurements were carried out in 2004 at Kvarnbo-clay and in 2013 at BonaWäsby-clay and BonaWäsby-clayloam. Measurements were made in transects 10–15 and 20–25 m apart along the entire fields, resulting in 90 and 50 ECa values per hectare, respectively, for Kvarnbo and Bona-Wäsby.
Data analyses: rationale, maps and statistical analyses
Yield data from several years around the time of PR and ECa measurements were compared with the single measurements of PR and ECa. This was considered a viable option since within-field yield variation is usually associated with properties stable over long timescales. PR and E Ca are both heavily influenced by soil texture and the spatial distribution of soil texture in the subsoil is so stable in time that it can be seen as a fingerprint for the field (Sun et al. Citation2013). Measured bulk density, saturated hydraulic conductivity, total porosity and particle size distribution can remain stable over e.g. an eight-year period (Raczkowski et al. Citation2012). The assumption in the present study was that the PR and ECa measurements can be used to explain within-field yield variation over the course of several years.
Maps were produced for yield, PR and ECa by interpolation using ordinary kriging (ESRI 2015 ArcGIS Desktop release 10.4, Environmental Systems Research Institute, Redlands, CA). In order to better compare yield, PR and ECa, data were extracted to a common point grid of 10 m × 10 m. This meant that each point had data from yield, PR and ECa. These data were then used in regression and correlation analyses, which were performed separately for each field using JMP (SAS Institute Inc., Cary, NC, USA). Furthermore, yield, PR and ECa data were analysed against soil texture and elevation using correlation analysis. Only correlation coefficients from significant models (p < 0.05) are presented in this paper.
Results and discussion
The horizontal penetrometer
The horizontal penetrometer was first tested in Kvarnbo-clay, with all three soil penetrating cones mounted, measuring at 10, 30 and 50 cm depth. The cone measuring at 10 cm showed too much soil breakage in front of the cone and was not used thereafter. An attempt was made to use the 50 cm depth on all three fields, but large stones at this depth in all three fields made this impossible.
Kvarnbo-clay
Part of the field used in previous study
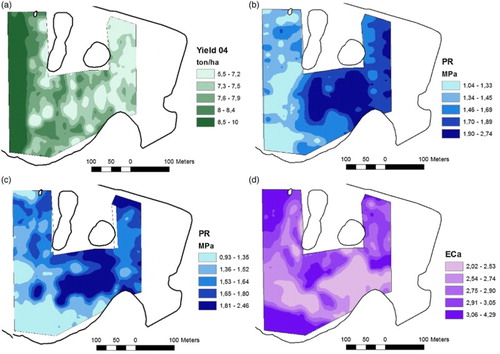
Yield and PR measurements revealed a pattern of higher yield and lower penetration resistance on the west side and lower yield and higher PR on the east side of Kvarnbo-clay (). There were similar opposing patterns between ECa and PR (r = −0.43), with higher PR in areas with lower ECa and lower PR in areas with higher ECa, but the correlation between ECa and yield was weaker (r = 0.26) than that between PR and yield (r = 0.47). It should be noted that yield was very high in 2004. Comparing the only two years with barley in this study, yield was 7397 kg ha−1 in 2004 and 5321 kg ha−1 in 1998, indicating favourable conditions and a lack of strong yield-limiting factors in 2004. The highest ECa readings were found in the southern part of Kvarnbo-clay, which is the lowest part of the field, close to a stream. This same area was characterised by low PR values (). However, for PR the area with low values continued further north, whereas the ECa values quickly decreased.
Figure 4. Spring barley yield 2004 (a), penetration resistance at 50 cm in spring 2004 (b), penetration resistance at 30 cm in august 2004 (c) and ECa, measured spring 2004 (d), within the smaller 7.5 ha area at Kvarnbo. All three maps are displayed using quintiles.
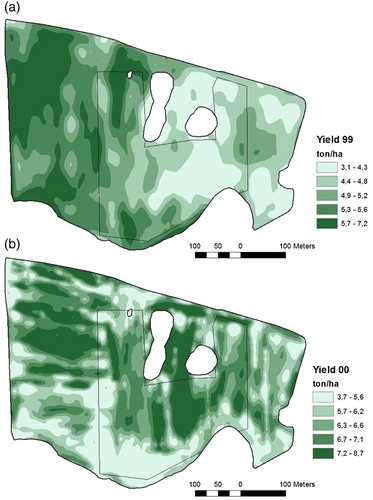
Entire field
presents the yield in 2004 and ECa in the entire Kvarnbo-clay field. Yields were also monitored over the whole field in 1996, 1997, 1998 1999 and 2000. The field had a pattern in yield that was present in all years but one (2000). The yields in 1999 (the driest year) and 2000 (different yield pattern) are shown in . The correlation between yield and penetration resistance was strongest for 1999, with r = −0.67 and that year also displayed the strongest correlation between yield and ECa (r = 0.48). In 2000, very low yield was measured in the lower-lying (southernmost) parts of the field and high yield in the middle, in areas with slightly higher altitude (). For 2000, there were positive correlations between yield and PR and negative correlations between yield and ECa. The difference in pattern and the reverse correlations are most likely due to intensive rain in July that year, as reported by Bölenius et al. (Citation2017). The lower-lying areas became too wet and the higher areas, which tend to be too dry under normal weather conditions, received enough water in 2000.
Figure 5. Yield (a) and ECa (b) on the entire Kvarnbo field in 2004. All maps are displayed using quintiles.
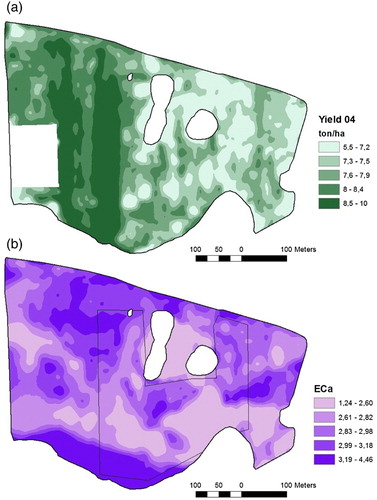
Figure 6. Yield from 1999 (a) and 2000 (b). The smaller area were PR was measured in spring 2004 is indicated in the maps. All maps are displayed using quintiles.
The other three years in which yield was monitored (1996, 1997 and 1998) showed similar patterns to 2004 and 1999. Even though crop yields at Kvarnbo were generally high (typically much above the county mean), with the exception of 1999, we detected some areas where yield was limited with both PR and ECa measurements. PR was slightly better in explaining yield patterns, but both methods were promising in identifying areas that were potentially yield limiting on this clay soil in northern Europe.
Some of the yield patterns in the Kvarnbo-clay field could be explained by texture. Higher clay content () seemed to correspond with lower PR (). A similar corresponding relationship could not be found in ECa. Although PR is normally negatively correlated to clay content (Gupta and Larson Citation1979; Spivey et al. Citation1986), the correlation between PR and clay content did not hold for the southernmost part of the Kvarnbo-clay field. This is the area with the highest organic matter content, and higher soil organic matter content is generally associated with lower bulk density and higher water content, both of which decrease penetration resistance (Spivey et al. Citation1986; Celik et al. Citation2010).
BonaWäsby-clay
In the BonaWäsby-clay field, yield was monitored in two years, 2008 and 2013. The yield showed similar patterns in both years (r = 0.45; ). It is worth noting that this occurred despite the fact that one year had oilseed rape with extremely high yield (226% of county mean) and one year with fairly average-yielding grain. However, both were spring-sown crops. Based on the presence of fairly stable yield patterns, it was anticipated that PR and ECa would show similar patterns with yield. The northern and south-eastern parts of the field showed a similar relationship between PR and yield, with low yield and high PR (). However, no overall correlations between PR and yield were found for the whole field. The ECa map showed no similarities to either the yield or the PR map (). However, ECa measurements showed similar patterns to the clay content map, whereas the variations in PR could not be explained by soil texture (). Since ECa is more influenced by texture than by structure (Banton et al. Citation1997) and PR is more influenced by structure than ECa is, it is possible that soil structure plays a more important part in explaining yield variations in this field, especially in the areas that show a clear pattern with both yield and PR.
Figure 7. Yield from 2008 (a) and 2013 (b), penetration resistance at 30 cm in spring 2008 (c) and ECa (d). All four maps are displayed using quintiles.
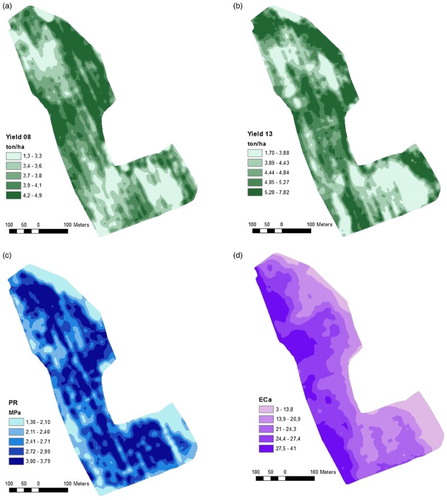
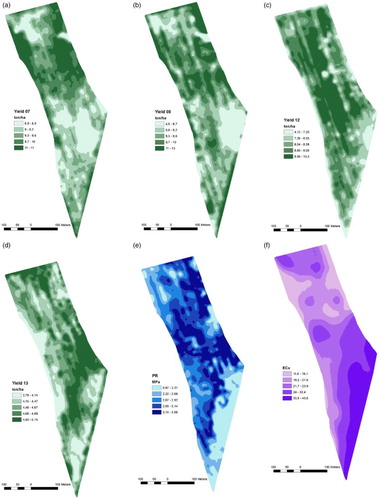
Figure 8. Yield from 2007 (a), 2008 (b), 2012 (c) and 2013 (d), penetration resistance at 30 cm in spring 2009 (e) and ECa. (f). All six maps are displayed using quintiles.
BonaWäsby-clayloam
In the BonaWäsby-clayloam field, yield was monitored in four years; 2007, 2008, 2012 and 2013. Yield, PR and ECa data for BonaWäsby-clayloam are presented in . A within-field pattern in yield was observed in both 2007 and 2008 (winter wheat, r = 0.59) but not in 2012 (also winter wheat) or 2013 (spring barley). 2007 and 2008 had higher yield compared with 2012 and 2013. Unlike in the Kvarnbo-clay and BonaWäsby-clay fields, PR showed a positive correlation with yield and ECa was negatively correlated with yield. However, the correlation between yield and PR was weak for all years except 2012 (r = 0.43). ECa was more strongly correlated to yield in 2007 (r = −0.41) and 2008 (r = −0.39) than was seen for PR, whereas the opposite (i.e. stronger correlation between yield and PR than between yield and ECa) was found for 2012 and 2013. The correlation between ECa and PR in BonaWäsby-clayloam was the strongest observed in all three fields (r = −0.51). The correlation with clay content was less apparent than in the other fields for both PR and ECa ( and ). Correlations between yield and clay were also not found. However, it is worth remembering that the clay content data used in this study were based on a digital soil map and not on soil samples from the actual field. Although the soil map has low average error (5.6% clay), the actual deviation can be both higher and lower in different parts of fields (Piikki et al. Citation2017). The PR and ECa data could not explain yield variations in BonaWäsby-clayloam. Including clay content based on soil samples from the field, organic matter content and soil depth might help explain the variations in this field.
General findings and implications for future studies
In total, all fields had high yield but there were still yield variations within fields. It was difficult to find differences in correlation between years for the different yield levels in each field except for Kvarnbo-clay, where the lowest yielding year (corresponding to the driest year) showed the strongest correlations between PR, ECa and yield. The soil attributes most affecting PR and ECa are all related to soil water supply, so in drier years there will be a stronger correlation between yield and PR and/or ECa.
Areas of several hectares within two out of three fields had consistently high PR and comparatively low yields. On these areas, measures to improve soil physical status could be effective. These low-yielding areas were somewhat easier to identify with PR than with ECa (e.g. r = −0.77 between yield 1999 and PR and r = 0.63 between yield 1999 and ECa in part of Kvarnbo-clay; r = −0.32 between yield 2008 and PR and r = 0.23 between yield and ECa in part of BonaWäsby-clay).
Measurements of PR and ECa from one year could explain within-field yield variations of several years, both before and after the year of PR and ECa measurements. This is possible, since soil physical properties in the subsoil are quite stable (Vachaud et al. Citation1985; Schlüter et al. Citation2011; Raczkowski et al. Citation2012). It is also a prerequisite for these methods being practically applicable to identify yield-limiting areas.
Measurements on PR in both subsoil and topsoil would be preferable. The topsoil strength may very well be more strongly correlated than subsoil PR to yield in a given year (Pringle and Lark Citation2007) since the topsoil is generally more variable from year to year than the subsoil due to soil management (Ley and Laryea Citation1994; Kilic et al. Citation2004). However, since the topsoil varies more between years, sensor measurements are only useful for the year in which they are conducted and the aim in the present study was to examine the reasons for temporally stable patterns, which are considered to be related to subsoil properties.
The great interdependency of soil attributes that affects both PR and ECa makes it easy to find soil physical differences using these methods, which is an advantage. The disadvantage is that it makes it challenging to interpret results from these measurements. However, if either PR or ECa is to be used as a simple tool to identify yield-limiting areas, it must be able to do so without the need to measure several other properties as well, since then it would lose its usefulness in a practical sense. The most important additional measurement needed in order to be able to draw more specific conclusions is a simultaneous measurement of soil water content.
The PR and ECa measurements were not carried out simultaneously, since the idea was to test them individually, but measuring both together by coupled measurements could be the subject of a future study. Combined measurements would improve the explanatory power, primarily since the two methods measure different volumes of soil. The difference in sensitivity to soil texture and soil structure changes between the two methods also suggests that a combination could improve the possibility of correlations to yield under different conditions.
To minimise the influence of soil moisture on PR and ECa, it is often recommended to restrict measurements to conditions of constant soil moisture conditions, e.g. field capacity (Ley and Laryea Citation1994). Considering that ECa is influenced by soil density, particularly in drier soil (Seladji et al. Citation2010), and that PR is more dependent on soil density in drier soil and might even be unaffected by changes in soil density at a high water content (Mulqueen et al. Citation1977), aiming to measure at field capacity is possibly not the best approach when trying to identify areas that are potentially yield-limiting.
One question arising from our study is whether the same areas within a field are limiting in dry conditions as well as in wet conditions, i.e. whether a given (sub)soil structure negatively affects crop production both when it is (too) dry and (too) wet? Another question that deserves further attention is whether the penetrometer and/or the ECa are able to identify the problematic areas under both dry and wet conditions? Measurements over several years including a number of fields covering a wide range of soil textures and preferably in different climates are needed in order to answer those questions.
Acknowledgement
We greatly appreciate the cooperation of Sören Vallgårda at Kvarnbo and Adam Giertta at Bona Wäsby for allowing us to use their fields in this study. We thank Gustav Rogstrand and Mikael Gilbertsson from the Research Institutes of Sweden (RISE) for help with construction of the penetrometer. This project was initiated by the late Professor Johan Arvidsson, without whom this paper would never had been written.
Disclosure statement
No potential conflict of interest was reported by the authors.
Notes on Contributors
Elisabeth Bölenius is a PhD student at the Swedish University of Agricultural Sciences, Department of Soil and Environment, Uppsala, Sweden. Her work is focused on soil compaction, soil management and within-field variability of soil physical properties and yield. She is currently also working at the Swedish board of agriculture with integrated pest management, IPM.
Johanna Wetterlind is Associate Professor at the Swedish University of Agricultural Sciences, Department of Soil and Environment, Skara, Sweden. She received her Ph.D. in Soil Science with emphasis on plant nutrition from the same university and has spent a year as Post.doc. at INRA, Unit InfoSol, France. She works mainly with applied research in Pedometrics and Precision Agriculture with the main research focus on Soil Spectroscopy and Soil Mapping strategies with a clear aim for in-field measurements.
Thomas Keller is a Professor at the Swedish University of Agricultural Sciences in Uppsala, Sweden, and a scientist with the Agroscope research institute in Zürich, Switzerland. He received his PhD in Soil Science from the Swedish University of Agricultural Sciences. His current work is focused on soil compaction, soil structure dynamics due to natural processes and soil management, and plant–soil interactions.
Additional information
Funding
References
- Banton O, Seguin MK, Cimon MA. 1997. Mapping field-scale physical properties of soil with electrical resistivity. Soil Sci Soc Am J. 61:1010–1017. doi: 10.2136/sssaj1997.03615995006100040003x
- Basso B, Bertocco M, Sartori L, Martin EC. 2007. Analyzing the effects of climate variability on spatial pattern of yield in a maize–wheat–soybean rotation. Eur J Agron. 26:82–91. doi: 10.1016/j.eja.2006.08.008
- Berisso FE, Schjonning P, Keller T, Lamande M, Etana A, de Jonge LW, Iversen BV, Arvidsson J, Forkman J. 2012. Persistent effects of subsoil compaction on pore size distribution and gas transport in a loamy soil. Soil Till Res. 122:42–51. English. doi: 10.1016/j.still.2012.02.005
- Berisso FE, Schjønning P, Keller T, Lamandé M, Simojoki A, Iversen BV, Alakukku L, Forkman J. 2013. Gas transport and subsoil pore characteristics: anisotropy and long-term effects of compaction. Geoderma. 195-196:184–191. doi: 10.1016/j.geoderma.2012.12.002
- Bölenius E, Stenberg B, Arvidsson J. 2017. Within field cereal yield variability as affected by soil physical properties and weather variations–A case study in east central Sweden. Geoderma Regional. 11:96–103. doi: 10.1016/j.geodrs.2017.11.001
- Boon NE, Yahya A, Kheiralla AF, Wee BS, Gew SK. 2005. Tractor-mounted, automated soil penetrometer-shearometer unit for mapping soil mechanical properties. Biosyst Eng. 90:381–396. doi: 10.1016/j.biosystemseng.2004.12.004
- Carroll Z, Oliver MA. 2005. Exploring the spatial relations between soil physical properties and apparent electrical conductivity. Geoderma. 128:354–374. doi: 10.1016/j.geoderma.2005.03.008
- Celik I, Gunal H, Budak M, Akpinar C. 2010. Effects of long-term organic and mineral fertilizers on bulk density and penetration resistance in semi-arid Mediterranean soil conditions. Geoderma. 160:236–243. doi: 10.1016/j.geoderma.2010.09.028
- Corwin D, Lesch S. 2005. Apparent soil electrical conductivity measurements in agriculture. Comput Electron Agr. 46:11–43. doi: 10.1016/j.compag.2004.10.005
- Freeland R. 1989. Review of soil moisture sensing using soil electrical conductivity. T Asae. 32:2190–2194. doi: 10.13031/2013.31283
- Gupta S, Larson W. 1979. A model for predicting packing density of soils using particle-size distribution. Soil Sci Soc Am J. 43:758–764. doi: 10.2136/sssaj1979.03615995004300040028x
- Håkansson I, Voorhees WB, Elonen P, Raghavan GSV, Lowery B, Van Wijk ALM, Rasmussen K, Riley H. 1987. Effect of high axle-load traffic on subsoil compaction and crop yield in humid regions with annual freezing. Soil Till Res. 10(3):259–268. doi: 10.1016/0167-1987(87)90032-8
- Hartge KH, Bohne H, Schrey HP, Extra H. 1985. Penetrometer measurements for screening soil physical variability. Soil Till Res. 5:343–350. doi: 10.1016/S0167-1987(85)80002-7
- Johnson CK, Doran JW, Duke HR, Wienhold BJ, Eskridge KM, Shanahan JF. 2001. Field-scale electrical conductivity mapping for delineating soil condition. Soil Sci Soc Am J. 65:1829–1837. doi: 10.2136/sssaj2001.1829
- Keller T, Sutter JA, Nissen K, Rydberg T. 2012. Using field measurement of saturated soil hydraulic conductivity to detect low-yielding zones in three Swedish fields. Soil Till Res. 124:68–77. doi: 10.1016/j.still.2012.05.002
- Khakural B, Robert P, Hugins D. 1998. Use of non-contacting electromagnetic inductive method for estimating soil moisture across a landscape. Commun Soil Sci Plant Anal. 29:2055–2065. doi: 10.1080/00103629809370093
- Kilic K, Ozgoz E, Akbas F. 2004. Assessment of spatial variability in penetration resistance as related to some soil physical properties of two fluvents in Turkey. Soil Till Res. 76:1–11. doi: 10.1016/j.still.2003.08.009
- Lantmäteriet. 2016. Quality description of National Elevation Model, version 1:1, 2016-12-01.
- Lapen DR, Topp GC, Gregorich EG, Hayhoe HN, Curnoe WE. 2001. Divisive field-scale associations between corn yields, management, and soil information. Soil Till Res. 58:193–206. doi: 10.1016/S0167-1987(00)00168-9
- Ley GJ, Laryea KB. 1994. Spatial variability in penetration resistance of a Hardsetting Tropical Alfisol. Soil Till Res. 29:367–381. doi: 10.1016/0167-1987(94)90109-0
- Machado S, Bynum ED, Archer TL, Bordovsky J, Rosenow DT, Peterson C, Bronson K, Nesmith DM, Lascano RJ, Wilson LT, et al. 2002. Spatial and temporal variability of sorghum grain yield: influence of soil, water, pests, and diseases relationships. Precis Agric. 3:389–406. doi: 10.1023/A:1021597023005
- Mulqueen J, Stafford JV, Tanner DW. 1977. Evaluation of penetrometers for measuring soil strength. J Terramechanics. 14:137–151. doi: 10.1016/0022-4898(77)90012-X
- Naderi-Boldaji M, Sharifi A, Alimardani R, Hemmat A, Keyhani A, Loonstra E, Weisskopf P, Stettler M, Keller T. 2013. Use of a triple-sensor fusion system for on-the-go measurement of soil compaction. Soil Till Res. 128:44–53. doi: 10.1016/j.still.2012.10.002
- Peng X, Horn R. 2008. Time-dependent, anisotropic pore structure and soil strength in a 10-year period after intensive tractor wheeling under conservation and conventional tillage. J Plant Nutr Soil Sci. 171:936–944. doi: 10.1002/jpln.200700084
- Piikki K, Söderström M, Stadig H. 2017. Local adaptation of a national digital soil map for use in precision agriculture. Adv Anim Biosci Precis Agric. 8(2):430–432.
- Pringle MJ, Lark RM. 2007. Scale- and location-dependent correlations of soil strength and the yield of wheat. Soil Till Res. 95:47–60. doi: 10.1016/j.still.2006.10.010
- Raczkowski CW, Mueller JP, Busscher WJ, Bell MC, McGraw ML. 2012. Soil physical properties of agricultural systems in a large-scale study. Soil Till Res. 119:50–59. doi: 10.1016/j.still.2011.12.006
- Schlüter S, Weller U, Vogel HJ. 2011. Soil-structure development including seasonal dynamics in a long-term fertilization experiment. J Plant Nutr Soil Sci. 174:395–403. doi: 10.1002/jpln.201000103
- Seladji S, Cosenza P, Tabbagh A, Ranger J, Richard G. 2010. The effect of compaction on soil electrical resistivity: a laboratory investigation. Eur J Soil Sci. 61:1043–1055. doi: 10.1111/j.1365-2389.2010.01309.x
- Sheets KR, Hendricks JM. 1995. Noninvasive soil water content measurement using electromagnetic induction. Water Resour Res. 31:2401–2409. doi: 10.1029/95WR01949
- Sirjacobs D, Hanquet B, Lebeau F, Destain MF. 2002. On-line soil mechanical resistance mapping and correlation with soil physical properties for precision agriculture. Soil Till Res. 64:231–242. doi: 10.1016/S0167-1987(01)00266-5
- Spivey L, Busscher W, Campbell R. 1986. The effect of texture on strength of southeastern coastal plain soils. Soil Til Res. 6:351–363. doi: 10.1016/0167-1987(86)90033-4
- Sun Y, Cheng Q, Lin J, Schellberg J, Schulze Lammers P. 2013. Investigating soil physical properties and yield response in a grassland field using a dual-sensor penetrometer and EM38. J Plant Nutr Soil Sci. 176:209–216. doi: 10.1002/jpln.201200104
- [SGU] Sveriges geoligiska undersökning. 2016. Geokartan. https://apps.sgu.se/geokartan/.
- To J, Kay BD. 2005. Variation in penetrometer resistance with soil properties: the contribution of effective stress and implications for pedotransfer functions. Geoderma. 126:261–276. doi: 10.1016/j.geoderma.2004.08.006
- Vachaud G, Passerat de Silans A, Balabanis P, Vauclin M. 1985. Temporal stability of spatially measured soil water probability density function. Soil Sci Soc Am J. 49:822–828. doi: 10.2136/sssaj1985.03615995004900040006x
- Vaz CM, Bassoi LH, Hopmans JW. 2001. Contribution of water content and bulk density to field soil penetration resistance as measured by a combined cone penetrometer–TDR probe. Soil Till Res. 60:35–42. doi: 10.1016/S0167-1987(01)00173-8
- Webb RH. 2002. Recovery of severely compacted soils in the Mojave Desert, California, USA. Arid Land Res Manag. 16:291–305. doi: 10.1080/153249802760284829
- Wiklert P. 1961. On the relationship between structure, root development and course of drying in soils (In Swedish with English summary). Grundförbättring. 14:221–239.