
ABSTRACT
The objective of this study was to determine drought tolerance characteristics of dryland wheat genotypes based on leaf gas exchange and water-use efficiency in order to identify promising genotypes for drought tolerance breeding. Physiological responses of ten genetically diverse wheat genotypes were studied under non-stressed (NS) and water stressed (WS) conditions using a 2 × 10 factorial experiment replicated 3 times. A highly significant water condition × genotype interaction (P < 0.001) was observed for photosynthetic rate (A), ratio of photosynthetic rate and internal CO2 concentration (A/Ci), ratio of internal and atmospheric CO2 (Ci/Ca), intrinsic (WUEi) and instantaneous (WUEinst) water-use efficiencies suggesting genotypic variability among wheat genotypes under both test conditions. Principal component analysis (PCA) identified three principal components (PC’s) under both test conditions accounting for 84% and 89% of total variation, respectively. Bi-plot analysis identified G339 and G344 as drought tolerant genotypes with higher values of A, T, gs, A/Ci, WUEi and WUEinst under WS condition. The current study detected significant genetic variation for drought tolerance among the tested wheat genotypes using physiological parameters. Genotypes G339 and G344 were identified to be drought tolerant with efficient A, T, gs, A/Ci and water-use under water stressed condition.
Introduction
Wheat (Triticum aestivum L., 2n = 6x = 42) is one of the most important cereal crops cultivated globally (Dube et al. Citation2015) serving as a major staple food for more than one-third of the world’s population (Abdullah et al. Citation2011). It is rich in vitamins and minerals and is a good source of proteins and carbohydrates (FAO Citation2002). Wheat production in arid and semi-arid areas is affected by drought stress combined with other abiotic stress factors such as heat resulting in considerable yield losses (Akhkha Citation2011). Drought occurrences are characterised by prolonged dry periods and erratic rainfalls. This phenomenon is likely to increase due to climate change emphasising the urgent need to develop drought tolerant and water-use efficient wheat genotypes to improve wheat production and productivity under water-limited environments.
Plants growing under water limited conditions have developed mechanisms for maintaining plant water balance in order to sustain plant physiological processes (Bartels et al. Citation1996; Blum Citation1996). Plants are able to avoid the effects of drought stress by lowering leaf water potential and reducing transpirational water loss by closing stomatal apertures (Farooq et al. Citation2009). However, reduced stomatal conductance can lead to reduced photosynthetic rate by limiting CO2 assimilation rate (Silva and Costa Citation2009; Jackson et al. Citation2016; Sourour et al. Citation2017). Nonetheless, reduced stomatal conductance has been reported to improve water-use efficiency under water limited conditions (Blum Citation2005; Dong et al. Citation2008).
Water use efficiency (WUE) at plant level is described as the ability of the plant to produce biomass or yield per unit water used (Blum Citation2005). WUE is an important physiological trait that can improve crop yields under limited water conditions (Deng et al. Citation2006; Silva et al. Citation2013; Varga et al. Citation2015). This trait is considered an important parameter for measuring the level of drought tolerance in crops (Blum Citation2009; Lawlor and Tezara Citation2009). At the leaf level, two WUE components are recognised namely: instantaneous (WUEinst) and intrinsic water-use efficiencies (WUEi). WUEinst is defined as the ratio of photosynthetic rate and transpiration rate, whereas, WUEi is defined as the ratio of photosynthetic rate and stomatal conductance (Ehleringer et al. Citation1993; Tambussi et al. Citation2007). WUEinst and WUEi are considered important short-term physiological measurements of water-use efficiency (Ehleringer et al. Citation1993). In general, leaf gas exchange parameters (e.g. photosynthetic rate, transpiration rate and stomatal conductance) and WUE are important parameters for measuring drought tolerance in crops (Lawlor and Tezara Citation2009; Athar and Ashraf Citation2009; Mashilo et al. Citation2017).
Improved wheat cultivars with drought and heat tolerance are yet to be released for wider production (Yildirim et al. Citation2013). Recurrent drought occurrences necessitate the need for development of improved wheat cultivars for cultivation in dry environments to improve productivity. To improve wheat yield levels in dry environments, the International Wheat and Maize Improvement Center (CIMMYT) is developing candidate genotypes (Lantican et al. Citation2001; Mwadzingeni et al. Citation2016). However, the level of drought tolerance characteristics among these genotypes remains largely unknown. Assessing the level of drought tolerance among diverse wheat populations will aid in the identification and selection of promising genotypes for advancing drought tolerance in improvement programmes. The objective of this study was to determine drought tolerance of dryland wheat genotypes based on leaf gas exchange and water-use efficiency in order to identify promising genotypes for drought tolerance breeding.
Materials and methods
Planting materials
Ten genetically diverse wheat genotypes sourced from the International Maize and Wheat Improvement Center (CYMMIT) were used for the study (). The genotypes were developed for cultivation in dry environments and were selected based on their diverse differential pedigrees. Initially, a set of 100 diverse wheat genotypes were acquired from CYMMIT’s drought tolerance nursery, Mexico. Preliminary field evaluations (data not presented) under South African conditions indicated that the 10 genotypes selected for the current study were agronomically suitable with better yield and yield-related traits.
Table 1. Name and pedigree of the 10 wheat genotypes used in the present study.
Study site
The experiment was conducted at the University of KwaZulu-Natal’s Ukulinga Research Farm, Pietermaritzburg, KwaZulu-Natal Province (29°37′00″S30°23′34″E). The soil at the site is characterised by clay loam soils with the following physical properties: Clay % = 28%; Silt % = 48.94% and Coarse sand = 10.35%. The trial was planted under a rain-out shelter using custom-made plastic mulches which allowed the crops to grow under natural excluding rainfall. Wheat was the only crop previously cultivated at the site.
Experimental design and crop establishment
The experiment was laid out as a 2 × 10 factorial treatment structure arranged in a complete randomised block design with the following factors: water condition (non-stressed [NS] and water stressed [WS] and genotypes (10 levels; see ) and replicated 3 times. Genotypes were established under both NS and WS conditions. Seven to 10 plants were established in single rows of 1.4 m long for each genotype. Two seeds were planted and later thinned to one two weeks emergence. Intra-row and inter-row spacing were 15 and 40 cm, respectively. The total plot size for NS and WS treatments was 88.34 m2. Water stress was imposed at heading stage by withholding irrigation for 10 days. Plants in the NS treatment were watered daily to maintain soil moisture content close to field capacity (30%) until physiological maturity. Soil samples were analyzed at the KwaZulu-Natal’s Department of Agriculture and Rural Development, Research and Technology: Analytical Services Laboratory, South Africa (). Based on soil fertility analysis N, P and K were applied at a rate of 200, 20 and 0 kg/ha, respectively. Weed control was done manually. The experiment was planted on the 11th January 2016 and harvested on the 20th May 2016.
Table 2. Chemical composition of the soil used in the study.
Data collection
Soil moisture content
Volumetric soil moisture content was measured using a handheld soil moisture Thetaprobe (Type ML2X attached to HH2 moisture metre, Delta devices, England). The ThetaProbe is a frequency domain reflectometry sensor (FDR) that is used to determine volumetric water content by generating an electromagnetic field to the soil. Measurements were made every second day after withholding irrigation in both non-stressed and water-stressed treatments. Plants in the WS treatment were re-irrigated after 10 days of water stress and both NS and WS treatments were fully irrigated until physiological maturity stage. Volumetric soil (θ) water content was calculated using the formulae:where
= the square root of the dielectric constant. A third order polynomial of the FDR sensor analog output V (in volts) is used to estimate the square root of the dielectric constant ε (Delta-T Devices, 2013) as
: 4.70V3–6.40V2 + 6.4V + 1.07.
is the square root of the apparent dielectric constant obtained using the ThetaProbe voltage measured in an air-dry soil. The term
is the difference between the square root of the dielectric constant of saturated soil and dry soil divided by the soil water content at saturation.
Leaf gas exchange parameters
The following leaf gas exchange parameters were measured using the LI-COR 6400 XT portable photosynthesis system which was equipped with an LED red/blue light source (6400-02B) (Licor Biosciences, Inc. Lincoln, Nebraska, USA): stomatal conductance (gs) (mol H2O m−2 s−1), photosynthetic rate (A) (μmol CO2 m−2 s−1) transpiration rate (T) (mmol H2O m−2 s−1), intercellular CO2 concentration (Ci) (μmol CO2 mol−1) and the ratio of intercellular and atmospheric CO2 (Ci/Ca). The ratio of net CO2 assimilation rate and intercellular CO2 concentration (A/Ci) was calculated according to Dong et al. (Citation2016). Intrinsic water-use efficiency (WUEi) (μmol (CO2) m−2 (H2O) was calculated as the ratio of A/gs. Instantaneous water-use efficiency (WUEinst) (μmol (CO2) m−2 (H2O) was calculated as the ratio of A/T (Tambussi et al. Citation2007). During measurements, the flow rate of water was maintained at 500 μmol and relative humidity maintained at 43%. The leaf-to-air vapour pressure deficit in the cuvette was maintained at 1.7 kPa to prevent stomatal closure due to the low air humidity effect. Measurements were made after 10 days of withholding irrigation from three randomly selected plants between 11h00 and 14h00 on a clear and cloudless day. Grain yield (in grams) were determined at maturity for all genotypes under NS and WS conditions. Water-use efficiency at the whole-plant level (kg m−3) was calculated as the ratio of grain yield to the water used by the plant according to Chen et al. (Citation2010) as follows:Where:
WUE = water use efficiency
GY = grain yield
ET = evapotranspiration
ET was obtained from the weather station at Ukulinga Research Farm and was calculated based on the water balance equation following the method of Chen et al. (Citation2010) as follows:Where:
ET = evapotranspiration
CR = Capillary rise
P = Precipitation
D = Drainage
R = Runoff
DW (mm) = Change in soil moisture content
Data analysis
The data collected was subjected to analysis of variance (ANOVA) using GenStat (Version 17, VSN International, Hempstead, UK). The replications and blocks were treated as fixed factors whereas genotypes, water treatments and their interactions were considered as random factors. Treatment means were separated using the Least Significant Difference (LSD) at 5% level of significance. Pearson correlation analysis was performed using SPSS 16.0 (SPSS, 2007) to test for associations among the studied parameters. Significance tests of the correlation were determined using the Student t-test. Principal component analysis (PCA) based on the correlation matrix was performed using SPSS 16.0 (SPSS, 2007). Biplot analysis was then used to describe the drought tolerance among wheat genotypes based on the studied traits (Singh and Raja Reddy Citation2011; Mashilo et al. Citation2017).
Results
Soil water content
Volumetric soil moisture content was different between non-stressed and water stressed conditions (). Soil water content under water stressed condition decreased to about 7–6% after irrigation was withheld for 10 days. Signs of leaf rolling and leaf wilting were observed in water-stressed plants at maximum stress (10 days). In contrast, soil water content was maintained at field capacity (∼25%) under non-stressed condition throughout the experiment.
Figure 1. Mean volumetric soil moisture content (%) response of wheat genotypes evaluated under non-stressed and water stressed conditions.
Effect of genotype, water condition and genotype × water condition interaction on leaf gas exchange variables, water-use efficiency and grain yield
Analysis of variance showing mean squares and significance test among the studied parameters of 10 selected wheat genotypes under non-stressed and water stressed conditions is presented in . Highly significant differences (P < 0.001) were observed among the genotypes with regards to A, gs, T, A/Ci, Ci/Ca, WUEi, WUEinst and WUE suggesting genotypic variability among these traits. Highly significant differences (P < 0.001) were observed between water conditions with regards to A, gs, A/Ci, and WUEinst. A significant genotype × water conditions interaction (P < 0.001) was observed on a number of leaf gas exchange parameters such as A, A/Ci, Ci/Ca and water-use efficiency (WUEi, WUEinst and WUE) suggesting varying responses among the tested wheat genotypes under both non-stressed and water stressed conditions ().
Table 3. Analysis of variance showing mean squares and significance test for leaf gas exchange variables, water-use efficiency and grain yield of the 10 wheat genotypes tested under non-stressed and water-stressed conditions.
Effect of water stress on leaf gas exchange parameters, water-use efficiency and grain yield of wheat genotypes
Mean values of gas exchange parameters, water-use efficiency and grain yield of wheat genotypes tested under non-stressed and water stressed conditions are presented in . Significant genotypic differences (P < 0.001) was observed with respect to photosynthesis (A) under both non-stressed and water stressed conditions. Genotypes G120 and G139 showed significantly higher A (>1.94 μmol CO2 m−2 s−1) under non-stressed condition compared to other genotypes. Under water stressed condition, G344 showed significantly (P < 0.05) higher A (2.54 μmol CO2 m−2 s−1) compared to other genotypes. A was low for genotypes G112, G118, G120 and G139 which were further reduced by 81, 66, 87 and 85% due to water stress, respectively. Genotypes G339, G118, G139 and G120 showed significantly (P < 0.05) higher gs (>0.46 mol H2O m−2 s−1) under non-stressed condition. Non-significant (P > 0.05) differences were observed among wheat genotypes with regards to gs under water stressed condition. Non-significant (P > 0.05) differences were also observed among genotypes with respect to transpiration rate (T) under non-stressed condition. However, highly significant genotypic differences (P < 0.001) were observed under water stressed condition. Genotype G343 had a significantly lower T under water stressed condition (8.05 mmol H2O m−2 s−1) and a 31% reduction due to water stress. On the contrary, genotypes G339, G141 and G139 showed significantly higher T values (>10.74 mmol H2O m−2 s−1) under water stressed condition. Non-significant (P > 0.05) differences were observed among wheat genotypes under non-stressed condition with respect to internal CO2 concentration (Ci). However, significant genotypic differences were detected under water stressed condition. Genotype 344 showed significantly lower Ci value (246.2 μmol CO2 mol−1) compared to genotypes such as G120 and G139 which showed significantly (P < 0.05) higher Ci values (>258.1 μmol CO2 mol−1).
Table 4. Mean values of leaf gas exchange parameters, water-use efficiency and grain yield of wheat genotypes evaluated under non-stressed and water stressed conditions.
Significant (P < 0.05) genotypic differences were observed with respect to ratio of photosynthetic rate and internal CO2 concentration (A/Ci) under non-stressed condition. Genotypes G120 and G139 showed higher A/Ci values (0.009 and 0.017 μmol mol−1, respectively), whereas G115 showed lower (0.002 μmol mol−1) A/Ci value under non-stressed condition. Under water stressed condition, genotype G344 showed significantly higher A/Ci value (0.010 μmol mol−1) whereas G112 showed significantly (P < 0.05) lower A/Ci value (0.001 μmol mol−1). Genotype 139 significantly showed a low ratio of internal CO2 concentration and atmospheric CO2 (Ci/Ca) value (0.89) under non-stressed condition, whereas the rest of the genotypes showed significantly higher Ci/Ca values (0.92–0.94 respectively). With regards to intrinsic water-use efficiency (WUEi), highly significant differences (P < 0.001) were observed among the tested wheat genotypes under non-stressed condition. Genotypes G344, G112, G120 and G139 recorded significantly higher WUEi values (>3.38 μmol (CO2) m−2 (H2O) compared to G339 which recorded the lowest WUEi value (1.63 μmol (CO2) m−2 (H2O) under non-stressed condition.
Under water stressed condition, most of the tested wheat genotypes showed significantly (P < 0.05) lower WUEi values (0.99–1.82 μmol (CO2) m−2 (H2O) except G344 which had a higher WUEi value (8.81 μmol (CO2) m−2 (H2O). Furthermore, water stressed reduced WUEi of genotypes G112, G139 and G120 by 77, 83 and 60%, respectively. Significant genotypic response with respect to instantaneous water-use efficiency (WUEinst) was observed under both non-stressed and water stressed conditions. Genotypes G120 and G139 showed significantly (P < 0.001) higher WUEinst (>0.16 μmol (CO2) m−2 (H2O) under non-stressed condition compared to other genotypes which showed lower WUEinst values (0.07–0.16 μmol (CO2) m−2 (H2O). Under water stressed condition, genotype G344 showed significantly (P < 0.05) higher WUEinst value (0.26 μmol (CO2) m−2 (H2O) than genotypes G115 and G118 which recorded the lowest WUEinst values (0.03 and 0.04 μmol (CO2) m−2 (H2O), respectively. Water stressed reduced WUEinst of genotypes G112 and G139 by 75 and 82% respectively, whereas the lowest reduction of 40% and 38 were recorded for G109 and G141, respectively. Highly significant (P < 0.001) differences were observed under both non-stressed and water stressed condition with respect to whole-plant water-use efficiency (WUE). Genotype G115 showed significantly (P < 0.001) higher WUE value (0.07 kg m3) under non-stressed condition. Under water stressed condition, G112 showed a low WUE value of 0.04 kg m3 compared to G115 which showed significantly higher value (0.06 kg m3) than G112 under water stressed condition. Non-significant differences (P > 0.05) were observed among the tested wheat with respect grain yield (GY) under both test conditions.
Associations among variables
Correlation coefficients (r) describing the level of associations among the studied traits under non-stressed and water stressed conditions are presented in . Under non-stressed condition (lower diagonal), positive and significant correlations were observed between A with A/Ci (r = 0.74; P = 0.031), WUEinst (r = 0.99; P < 0.001), and WUEi (r = 0.98; P < 0.001). Stomatal conductance (gs) was significantly and positively correlated with T (r = 0.79; P = 0.007) under non stressed condition. A/Ci was positively correlated with WUEinst (r = 0.73, P = 0.015) and WUEi (r = 0.72, P = 0.017) under non-stressed condition. Intrinsic water-use efficiency (WUEi) was positively and significantly correlated with WUEinst (r = 0.99; P < 0.001) under non-stressed condition. Non-significant correlations were observed between WUE and other traits under non-stressed condition.
Table 5. Pearson’s correlation co-efficient (r) describing the association between leaf gas exchange parameters, water-use efficiency and grain yield of 10 selected wheat genotypes under non-stressed (lower diagonal) and water stressed (upper diagonal) conditions.
Under water stressed condition (upper diagonal), positive and significant correlations were observed between T and gs (r = 0.91; P < 0.001). A/Ci was significantly and positively correlated with gs (r = 0.76; P = 0.010) and T (r = 0.76; P = 0.010) under water stressed condition. A was significantly and negatively correlated with Ci/Ca (r = −0.83; P = 0.003) under water stressed condition. Instantaneous water-use efficiency was positively and significantly correlated with A (r = 0.98; P < 0.001) and negatively correlated with Ci/Ca (r = −0.90; P < 0.001) under water stressed condition. WUEi was positively correlated with A (r = 0.96; P < 0.001) and WUEinst (r = 0.99; P < 0.001) and negatively correlated with Ci/Ca (r = −0.94; P < 0.001) under water stressed condition. There were negative and significant correlations between grain yield with A (r = −0.80; P = 0.005), WUEinst (r = −0.76; P < 0.001) and WUEi (r = −0.72; P = 0.081) under water stressed condition.
Principal component analysis
Principal component analysis (PCA) showing eigenvectors, eigenvalues, and percent variance of the studied parameters of selected 10 wheat genotypes under non-stressed and water stressed conditions is presented in . Under non-stressed condition, PCA revealed three principal components (PC’s) which accounted for 84% of the total variation. A, A/Ci, WUEinst and WUEi were positively correlated with PC1 which accounted for 43% of the total variation. Stomatal conductance (gs) and T where positively correlated with PC2; whereas Ci/Ca was negatively correlated with PC2 which accounted for 24% of the total variation. WUE and GY were positively correlated with PC3 which accounted for 18% of the total variation.
Table 6. Principal component analysis showing eigenvectors, eigenvalues, and percent variance of leaf gas exchange, water-use efficiency and grain yield of selected 10 wheat genotypes under non-stressed and water stressed conditions.
Under water stressed condition, PCA revealed three PC’s which accounted for 89% of the total variation. A, WUEi and WUEinst were positively correlated with PC1; whereas Ci/Ca was negatively correlated with PC1 which accounted for 49% of the total variation. T, gs and A/Ci where positively correlated with PC2 which accounted for 27.1% of the total variation. Ci was positively correlated with PC3; whereas WUE was negatively correlated with PC3 which accounted for 14% of the total variation.
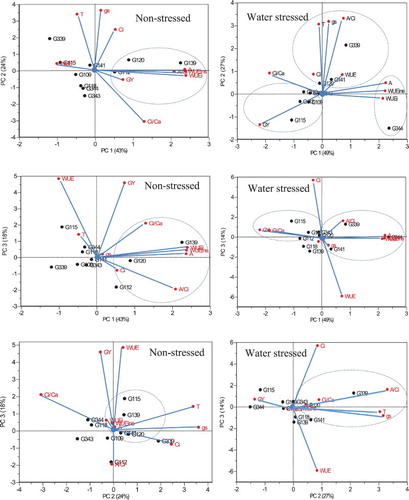
Principal component bi-plots based on PCA showing percent explaining variance of PC1 vs PC2, PC1 vs PC3 and PC2 vs PC3 superimposed with the studied parameters were constructed to visualise the relationship among the selected wheat to identify drought tolerant genotypes (). Under non-stressed condition, genotypes G120 and G139 was differentiated by high values of A, gs, T, Ci, A/Ci, WUEi, WUEinst. Under water stressed condition, genotypes G339 and G334 were differentiated from the other genotypes by high values of A, T, gs, A/Ci, WUEi and WUEinst. Genotypes G120, G141 and G339 were grouped together based on the high values of T, gs and A/Ci.
Figure 2. Rotated principal component scores and percent explained variance of PC1 vs PC2, PC1 vs PC3 and PC2 vs PC3 showing the grouping of wheat genotypes based on leaf gas exchange parameters, water-use efficiency and grain yield under non-stress and water stress conditions. A = Photosynthetic rate; gs = stomatal conductance; T = Transpiration rate; Ci = internal CO2 concentration; A/Ci = ratio of photosynthetic rate and internal CO2 concentration; Ci/Ca = ratio of internal CO2 concentration and atmospheric CO2; WUEi = intrinsic water-use efficiency; WUEinst = instantaneous water-use efficiency; WUE = water-use efficiency at whole-plant level; GY = grain yield.
Discussion
Breeding high-yielding wheat genotypes for dry environments requires identification of drought tolerant and water-use efficient germplasm for use in improvement programmes. The current study determined drought tolerance of dryland wheat genotypes based on leaf gas exchange and water-use efficiency in order to identify promising genotypes for drought tolerance breeding. Results of the current study showed that water stress reduced photosynthetic rate (A), stomatal conductance (gs) and transpiration rate (T). Stomatal closure due to water stress has been reported to cause a decline in A and internal CO2 concentration (Ci) (Moud and Yamagish Citation2006). However, in the current study, Ci was high under water stressed condition despite a reduction in A, gs and T (). The increase in Ci is an indication that A, gs and T were predominantly reduced by non-stomatal limitation such as reduced adenosine triphosphate (ATP) and activity ribulose-1,5- bisphosphate (RubP) carboxylase/oxygenase under water stressed condition (Tezara et al. Citation1999; Parry et al. Citation2002; Santos et al. Citation2009; Jackson et al. Citation2016). The mean reduction in A due to water stress was 50.00% which was more than the mean decline in gs (20.45%) suggesting the role of non-stomatal limitations to reduction in A. Furthermore, results of the present study showed that A was poorly correlated with gs further confirming the role of non-stomatal limitations to A (Cornic Citation2000; Dong et al. Citation2016).
On the contrary, Flexas et al. (Citation2009) reported that stomatal limitation is characterised by a daily maximum value of gs of greater than 0.05–0.10 mmol H2O m−2 s−1, whereas non-stomatal limitation is characterised by a value of gs of less than this threshold. The mean stomatal conductance under water stressed condition in the current study was 0.35 mol H2O m−2 s−1 suggesting stomatal limitations to A. Singh and Raja Reddy (Citation2011), suggested that gs value above 0.04 mol H2O m−2 s−1 is the main cause of reduced A under water stressed condition. A gs below (0.04 mol H2O m−2 s−1) suggest that the reduction in A is due to non-stomatal limitations. Photosynthesis requires diffusion of CO2 from the atmosphere into the leaf through the stomata to the intercellular air spaces then across the mesophyll and to the site of carboxylation in the chloroplast stroma (Flexas et al. Citation2007). Stomatal limitations to photosynthesis results from the low CO2 availability caused by limited diffusion through the stomata and mesophyll cells (Hu et al. Citation2010). A number of studies have reported similar results where a reduction in A was a result of low gs (Chaves et al. Citation2003; Ripley et al. Citation2007; Xu and Zhou Citation2008). It is possible that the reduction in A observed in the current study could have been due to both non-stomatal and stomatal limitations (e.g. mesophyll conductance) (Jackson et al. Citation2016).
Stomatal closure reduces the rate of transpiration under water stress condition leading to improved water-use efficiency; however, this can lead to a reduced CO2 influx into the leaves (Lawson and Blatt Citation2014). Water-use efficiency is an important physiological adaptation mechanism that may improve yield and drought tolerance of crops under limited water conditions (Medrano et al. Citation2015). In the present study, water stress significantly reduced intrinsic water-use efficiency (WUEi) by 28.72% across all wheat genotypes. However, genotype G344 and 339 showed higher WUEi values (8.81 and 3.93 μmol (CO2) m−2 (H2O respectively)). Similarly, instantaneous water-use efficiency (WUEinst) was reduced by 42.86% across all wheat genotypes; however, genotypes G344 and G339 showed higher values (0.26 and 0.14 μmol (CO2) m−2 (H2O), respectively) under water stressed condition. In addition, these genotypes maintained higher A values (2.54 and 1.64 μmol CO2 m−2 s−1) under water stressed condition suggesting maintenance of WUE improved photosynthetic rates of these genotypes under water stressed condition. Maintenance of high WUEi and A rates by G344 and G339 suggests these genotypes are drought tolerant and can be successfully grown in drought-prone environments. The high WUEi and WUEinst of genotypes G344 and G339 under water stressed condition could be due to efficient control of gs (0.28 and 0.43 mol H2O m−2 s−1) resulting in high A (2.54 and 1.65 μmol CO2 m−2 s−1). Important physiological traits for improving WUE at the leaf level is A and gs. Therefore, the selection of wheat genotypes with higher A and a low gs under water stress will lead to improved WUE (Singh and Raja Reddy Citation2011). Increased WUE enables the absorption of carbon due to reduced water loss (Farquhar et al. Citation1989). Additionally, genotype G344 showed a higher WUE at the whole plant level (0.6 kg m3) compared to other genotypes under water stressed condition. Low WUE indicates a high water-use or consumption by the plant and a high WUE indicates less water consumption (Farooq et al. Citation2009). Furthermore, low water-use under water stressed condition is indicative of drought tolerance. Results of the present study suggest that genotype G344 is water-use efficient and drought tolerant suitable for improving yields in dry environments. Michihiro et al. (Citation1994) also reported that wheat genotypes with high WUE under water stress condition are drought tolerant, whereas drought sensitive genotypes have low WUE. The wheat genotypes such as G344 and G339 which showed high WUEi and WUEinst under water stressed condition showed no significant differences in terms of grain yield compared to other genotypes. This is possibly because after water stress relief, plants were able to recover from the effect of water stress quickly and resume normal plant physiological functioning.
Associations among important indicators of drought tolerance is important for strategic breeding for drought tolerance improvement. In the current study, highly significant and positive correlations were observed between gs and T (r = 0.91; P < 0.001) under water stressed condition. This indicates that transpiration rate was greatly influenced by stomatal conductance. Similar findings have been reported on various C3 plants under water stress condition (Monneveux et al. Citation2006; Silva and Costa Citation2009; Silva et al. Citation2013). Ci/Ca negatively correlated with WUEi (r = −0.90; P < 0.001) and WUEinst (r = −0.94; P < 0.001) under water stressed condition (). Studies have reported that Ci/Ca is the inverse of WUEi (Brodribb Citation1996), which suggest that as the rate of WUEi increases, the rate of Ci/Ca decreases. Furthermore, WUEi and WUEinst were highly correlated with A under water stressed condition (), suggesting improved WUE increased A in the current study. Similar studies where A was correlated with WUE under water stressed condition have been reported (Singh and Raja Reddy Citation2011; Medrano et al. Citation2015). Water-use efficiency at the plant level was poorly and negatively correlated with WUE at the leaf level (WUEi and WUEinst). This indicates that the relationship that existed between WUEi and WUEinst (r = 0.99; P < 0.001) did not have an influence on WUE at the whole-plant level (). Medrano et al. (Citation2015) reported negative and non-significant association between WUE at the leaf level with WUE at the whole-plant level. This further suggested that improved water-use efficiency at the leaf level does not improve whole-plant water-use efficiency.
Principal component analysis under water stressed condition indicated that A, gs, T, A/Ci, Ci/Ca, WUEinst and WUEi explained most of the variation (PC1 and PC2) in the current study (). Principal component analysis biplot allowed the identification of drought tolerant genotypes such as G344 and G339 based on their high values of A, gs, T, A/Ci, WUEi and WUEinst under water stressed condition (). Several other studies associated leaf gas exchange parameters and water-use efficiency as indicators of drought tolerance in different crop species (Lawlor and Tezara Citation2009; Silva and Costa Citation2009; Silva et al. Citation2013; Mashilo et al. Citation2017). In conclusion, the current study detected significant genetic variation for drought tolerance among the tested wheat genotypes using physiological parameters. Genotypes G339 and G344 were identified to be drought tolerant with efficient photo-assimilation rate, transpiration rate, stomatal conductance, carboxylation efficiency and water-use under water stressed condition.
Acknowledgements
The College of Agriculture, Engineering and Science of the University of KwaZulu-Natal (UKZN) and the National Research Foundation (NRF) of South Africa are acknowledged for financial support of this study. CIMMYT is sincerely thanked for supplying the wheat germplasm used in the study.
Disclosure statement
No potential conflict of interest was reported by the authors.
Notes on contributors
Nkhathutsheleni Maureen Tshikunde is an MSc student in Plant Breeding at the University of KwaZulu-Natal, African Centre for Crop Improvement, South Africa.
Albert Odindo is a Lecturer and Researcher in Crop Science & Plant Physiology in the Crop Science Discipline, University of KwaZulu-Natal, South Africa.
Hussein Shimelis is Professor of Plant Breeding and the Deputy Director for African Centre for Crop Improvement (ACCI) at the University of KwaZulu-Natal, South Africa.
Jacob Mashilo is a Crop Scientist at the Limpopo Department of Agriculture and Rural Development, under Research Services, Limpopo Province, South Africa.
Additional information
Funding
References
- Abdullah F, Hareri M, Naaesan M, Ammar MA, Kanbar OZ. 2011. Effect of drought on different physiological characters and yield components in different varieties of Syrian durum wheat. J Agric Sci. 3:127–133.
- Akhkha A, Boutraa T, Alhejely A. 2011. The rate of photosynthesis, chlorophyll content, dark respiration, proline and Abscicic acid (ABA) in wheat (Triticum durum) under water deficit conditions. Int J Agric Biol. 13:215–221.
- Athar HR, Ashraf M. 2009. Strategies for crop improvement against salinity and water stress: an overview. In: Ashraf M, Ozturk M, Athar HR, editors. Salinity and water stress: improving crop efficiency. Germany: Spinger-Verlag; p. 1–16.
- Bartels DA, Furini JI, Salamini F. 1996. Responses of plants to dehydration stress: a molecular analysis. Plant Growth Reg. 20:111–118. doi: 10.1007/BF00024007
- Blum A. 1996. Crop responses to drought and the interpretation of adaptation. Plant Growth Reg. 20:135–148. doi: 10.1007/BF00024010
- Blum A. 2005. Drought resistance, water-use efficiency, and yield potential—are they compatible, dissonant, or mutually exclusive? Austr J Agric Res. 56:1159–1168. doi: 10.1071/AR05069
- Blum A. 2009. Effective use of water (EUW) and not water-use efficiency (WUE) is the target of crop yield improvement under drought stress. Field Crops Res. 112:119–123. doi: 10.1016/j.fcr.2009.03.009
- Brodribb T. 1996. Dynamics of changing intercellular CO2 concentration (Ci) during drought and determination of minimum functional Ci. Plant Physiol. 111:179–185. doi: 10.1104/pp.111.1.179
- Chaves MM, Maroco J, Pereira JS. 2003. Understanding plant response to drought-from genes to the whole plant. Funct Plant Biol. 30:239–264. doi: 10.1071/FP02076
- Chen C, Wang E, Yu Q. 2010. Modelling the effects of climate variability and water management on crop water productivity and water balance in the North China Plain. Agric Water Manag. 97:1174–1183.
- Cornic G. 2000. Drought stress inhibits photosynthesis by decreasing stomatal aperture, not by affecting ATP synthesis. Trends Plant Sci. 5:187–188. doi: 10.1016/S1360-1385(00)01625-3
- Deng XP, Shan L, Zhang HP, Turner NC. 2006. Improving agricultural water use efficiency in arid and semiarid areas of China. Agric Water Manag. 80:23–40. doi: 10.1016/j.agwat.2005.07.021
- Dong B, Liu M, Shao H, Li Q, Shi L, Du F, Zhang Z. 2008. Investigation on the relation between leaf water use efficiency and physio-biochemical traits of winter wheat under rained condition. Coll Surf B. 62:280–287. doi: 10.1016/j.colsurfb.2007.10.023
- Dong C, Shao L, Wang M, Liu G, Liu H, Xie B, Li B, Fu Y, Liu H. 2016. Wheat carbon dioxide responses in space simulations conducted at the Chinese Lunar Palace-1. Agron J. 108:32–38. doi: 10.2134/agronj15.0265
- Dube E, Mare-Patose R, Kilian W, Barnard A, Tsilo TJ. 2015. Identifying high-yielding dryland wheat cultivars for the summer rainfall area of South Africa. S Afr J Plant Soil. 33:77–81. doi: 10.1080/02571862.2015.1061712
- Ehleringer JR, Hall AE, Farguhar GD. 1993. Introduction: water use in relation to productivity. In: Ehleringer JR, Hall AE, Farguhar G.D, editors. Stable isoptopes and plant carbon-water relations. San Diego: Academic Press; p. 3–7.
- FAO. 2002. Plant production and protection series. No. 30. [accessed 10 November 2015]. www.fao.org/docrep/006/y4011e/y4011eoo.htm#.
- Farooq M, Wahid A, Kobayashi N, Fujita D, Basra SMA. 2009. Plant drought stress: effect, mechanism and management. Agron Sust Develop. 29:185–212. doi: 10.1051/agro:2008021
- Farquhar GD, Ehleringer JR, Hubick KT. 1989. Carbon isotope discrimination and photosynthesis. Ann Rev Plant Physiol. 40:503–537. doi: 10.1146/annurev.pp.40.060189.002443
- Flexas J, Barón M, Bota J, Ducruet JM, Gallé A, Galmés J, Jiménez M, Pou A, Ribas-Carbó M, Sajnani C, et al. 2009. Photosynthesis limitations during water stress acclimation and recovery in the drought-adapted Vitis hybrid Richter-110 (V. berlandieri×V. rupestris). J Exp Bot. 60:2361–2377. doi: 10.1093/jxb/erp069
- Flexas J, Ortuno MF, Ribas-Carbó M, Diaz-Espejo A, Florez-Sarasa ID, Medrano H. 2007. Mesophyll conductance to CO2 in Arabidopsis thaliana. New Phytol. 175:501–511. doi: 10.1111/j.1469-8137.2007.02111.x
- Hu LX, Wang ZL, Huang BR. 2010. Diffusion limitations and metabolic factors associated with inhibition and recovery of photosynthesis from drought stress in a C3 perennial grass species. Acta Physiol Plant. 139:93–106. doi: 10.1111/j.1399-3054.2010.01350.x
- Jackson P, Basnayake J, Inman-Bamber G, Lakshmanan P, Natarajan S, Stokes C. 2016. Genetic variation in transpiration efficiency and relationships between whole plant and leaf gas exchange measurements in Saccharum spp. and related germplasm. J Exp Bot. 67:861–871. doi: 10.1093/jxb/erv505
- Lantican M, Pingali P, Rajaram S. 2001. Growth in wheat yield potential marginal environments. In: Reeves J, McNab A, Rajaram S, editors. Proceedings of the Warren E. Kronstad Symposium, Ciudad Obregón, Sonora, Mexico. p. 73–79.
- Lawlor DW, Tezara W. 2009. Causes of decreased photosynthetic rate and metabolic capacity in water-deficient leaf cells: a critical evaluation of mechanisms and integration of processes. Ann Bot. 103:561–579. doi: 10.1093/aob/mcn244
- Lawson T, Blatt MR. 2014. Stomatal size, speed, and responsiveness impact on photosynthesis and water use efficiency. Plant Physiol. 164:1556–1570. doi: 10.1104/pp.114.237107
- Mashilo J, Odindo AO, Shimelis HA, Musenge P, Tesfay SZ, Magwaza LS. 2017. Drought tolerance of selected bottle gourd [Lagenaria siceraria (Molina) Standl.] landraces assessed by leaf gas exchange and photosynthetic efficiency. Plant Physiol Biochem. 120:75–87. doi: 10.1016/j.plaphy.2017.09.022
- Medrano H, Tomasa M, Martorell S, Flexas J, Hernandez E, Rossello J, Poub A, Escalona JS, Bota J. 2015. From leaf to whole-plant water use efficiency (WUE) in complex canopies: limitations of leaf WUE as a selection target. Crop J. 3:220–228. doi: 10.1016/j.cj.2015.04.002
- Michihiro W, Lui JCB, Garvalho GC. 1994. Cultivar difference in leaf photosynthesis and grain yield of wheat under soil water deficit conditions. Jap J Crop Sci. 63:339–344. doi: 10.1626/jcs.63.339
- Monneveux P, Rekika D, Acevedo E, Merah O. 2006. Effect of drought on leaf gas exchange, carbon isotope discrimination, transpiration efficiency and productivity in the field grown durum wheat genotypes. Plant Sci. 170:867–872. doi: 10.1016/j.plantsci.2005.12.008
- Moud AAM, Yamagishi T. 2006. Gas exchange responses of different wheat (triticum aestivum L.) cultivars to water stress condition. Int J Agric Biol. 1:102–105.
- Mwadzingeni L, Shimelis H, Tesfay S, Tsilo TJ. 2016. Screening of bread wheat genotypes for drought tolerance using phenotypic and proline analyses. Front Plant Sci. 7:1–12. doi: 10.3389/fpls.2016.01276
- Parry MAJ, Andralojc PJ, Khan S, Lea PJ, Keys AJ. 2002. Rubisco activity: Effects of drought stress. Ann Bot. 89:833–838. doi: 10.1093/aob/mcf103
- Ripley BS, Gilbert ME, Ibrahim DG, Osborne CP. 2007. Drought constraints on C4 photosynthesis: stomatal and metabolic limitations in C3 and C4 subspecies of Alloteropsis semialata. J Exp Bot. 58:1351–1363. doi: 10.1093/jxb/erl302
- Santos MG, Ribeiro RV, Machado EC, Pimentel C. 2009. Photosynthesis parameters and leaf water potential of five common bean genotypes under mild water deficit. Biol Plant. 53:229–236. doi: 10.1007/s10535-009-0044-9
- Silva ALC, Costa WAJM. 2009. Varietal variation in stomatal conductance, transpiration and photosynthesis of commercial sugarcane varieties under two contrasting water regimes. Trop Agric Res Ext. 12:97–102. doi: 10.4038/tare.v12i2.2798
- Silva MA, Jifon JL, Santos CM, Jadoskki CJ, Silva JAG. 2013. Photosynthetic capacity and water use efficiency in sugarcane genotypes subjected to water deficit during early growth phase. Braz Arch Biol Technol. 56:735–748. doi: 10.1590/S1516-89132013000500004
- Singh SK, Raja Reddy K. 2011. Regulation of photosynthesis, fluorescence, stomatal conductance and water-use efficiency of cowpea (Vigna unguiculata [L.]Walp.) under drought. J Photochem Photobiol B. 105:40–50. doi: 10.1016/j.jphotobiol.2011.07.001
- Sourour A, Afel O, Mounir R, Mongi BY. 2017. A review: morphological, physiological, biochemical and molecular plant responses to water deficit stress. Int J Eng Sci. 6:01–04. doi: 10.9790/1813-0601010104
- Tambussi EA, Bort J, Araus JL. 2007. Water use efficiency in C4 cereal under Mediterranean conditions: a review of some physiological aspects. CIHEAM (Options Mediterranean’s: Series B. 57:189–203.
- Tezara W, Mitchell VJ, Driscoll SD, Lawlor DW. 1999. Water stress inhibits plant photosynthesis by decreasing coupling factor and ATP. Nature. 401:914–917. doi: 10.1038/44842
- Varga B, Vida G, Varga-László E, Bencze S, Veisz O. 2015. Effect of simulating drought in various phenophases on the water use efficiency of winter wheat. J Agron Crop Sci. 201:1–9. doi: 10.1111/jac.12087
- Xu Z, Zhou G. 2008. Response of leaf stomatal density to water status and its relationship with photosynthesis in a grass. J Exp Bot. 59:3317–3325. doi: 10.1093/jxb/ern185
- Yildirim A, Sönmezoğlu ÖA, Sayaslan A, Koyuncu AM, Güleç T, Kandemir N. 2013. Marker-assisted breeding of a durum wheat cultivar for γ-gliadin and LMW-glutenin proteins affecting pasta quality. Turk J Agric For. 37:527–533. doi: 10.3906/tar-1207-75