
ABSTRACT
Cowpea (Vigna unguiculate L.) is an important legume crop due to its nutritional value and it has the potential to contribute to the alleviation of malnutrition in the world. The study objectives were to determine the variability among 70 cowpea genotypes for the concentration of mineral elements and phytochemical contents, identify superior genotypes for mineral elements and phytochemical contents, and to determine the correlation among traits. Data were collected from 70 cowpea genotypes planted in two different locations during the 2017/18 and 2018/19 cropping seasons in South Africa. Grain samples were analysed for selected minerals such as Fe, Zn, Ca, Cu, K, Mg, Mn, Na, P, and phytochemical contents including total phenolic and flavonoid. Genotype, locations, seasons, and their interaction effects were highly significant (p < 0.001) for all traits. Best linear unbiased predictors identified superior genotypes for all traits in both locations. There were significant (p < 0.05) correlations among most of the traits evaluated. The high negative association of total phenolics with most of the minerals indicated that selecting for total phenolics may unintentionally reduce the content of minerals. These results will contribute to the development of improved cowpea cultivars for nutritional value towards alleviating malnutrition in the world.
Introduction
Cowpea (Vigna unguiculate L.) is one of the most important food legume crops. The crop is mainly cultivated in sub-Saharan Africa and other parts of the world (Ng and Padulosi Citation1988; Padulosi et al. Citation1997) for human consumption and production of animal fodder due to its nutritional and food security value. Its grain contains 15–25% protein content, 50–60% carbohydrate, and 1% fat (Lambot Citation2002; Agbogidi and Egho Citation2012; Gerrano et al. Citation2019). Due to its high amount of protein, fibre, and vitamin and mineral contents, it contributes to a major part of the daily diet of vegetarians (Belane and Dakora Citation2011). In addition, cowpeas have phytochemicals such as phenolics and flavonoid, which are antioxidants, with the potential to reduce the risk of heart diseases and cancer, amongst others. Cowpea improves nutritional status due to lower cholesterol and higher fibre level (Frota et al. Citation2014). It was reported that Africa is the only continent that faces serious nutritional related challenges (Global Nutrition Citation2017). In South Africa, about a 21% malnutrition rate has been reported (Global Nutrition Citation2017). Therefore, there is a high demand for good nutritional value of food and feed to address malnutrition related challenges. Cowpea, due to its nutritional value, it has the potential to address malnutrition challenges and contribute to the economy of the country.
Previous studies (Carnovale et al. Citation1990; Gerrano et al. Citation2015, Citation2017, Citation2019) investigated genetic variability among cowpea genotypes for mineral elements and protein content. Carnovale et al. (Citation1990) investigated the variability in nutritional characteristics in cowpea genotypes and found that the mean concentrations for Ca, Zn, P and K contents in grains were 37.00, 4.70, 430.00 and 125.00 mg 100 g−1, respectively. In South Africa, Gerrano et al. (Citation2015) investigated the variability in cowpea seeds for mineral content and found that the mean concentrations for Ca, Cu, Fe, K, Mg, Mn, Na, P, Zn, and protein contents were 3.66, 11.07, 471.03, 1.54, 0.05, 178.37, 179.12, 0.31, 35.23 mg. kg−1, and 25.4%, respectively. Gerrano et al. (Citation2017) reported the mineral content in cowpea seeds and found that the mean concentrations K, Ca, P, Mg, Na, Fe, Mn, B, Al, Zn, Cu, and protein 19,743.74, 4175.18, 4525.56, 3588.18, 231.76, 71.43, 30.55, 26.54, 30.78, 39.29, 6.53 mg. kg−1, and 25.30%. Gerrano et al. (Citation2019) reported the mineral content in cowpea seeds and found that the mean concentrations for Ca, Cu, Fe, K, Mg, Mn, Na, P, Zn, and protein contents were 0.11, 5.85, 74.64, 13,247, 2,064,11.68, 361.6, 5315, 40.16 mg. kg−1 and 26.07%, respectively. These studies reported significant differences among cowpea genotypes for minerals and protein content. However, these studies (Gerrano et al. Citation2015, Citation2017, Citation2019) used not more than 25 genotypes which is a small portion of the germplasm collection, further highlighting the need to comprehensively investigate the magnitude and nature genetic variability among cowpea genotypes for mineral elements and phytochemical traits. In addition, genetic variability among cowpea genotypes for phytochemical (total phenolics and flavonoids) traits has not yet investigated in South Africa, hence, this is the first report.
Studies on comprehensive characterisation and evaluation for nutritional value of diverse cowpea genotypes on the basis of grain mineral elements and phytochemical contents is of fundamental importance in the identification of potential parental genotypes that can be used to develop nutritionally improved cowpea cultivars (Souza and Sorrels Citation1991; Gerrano et al. Citation2019). While the advantages of characterisation and evaluation of germplasm pool are known, there is a limited data to validate the amount of genetic variability present among cowpea germplasm collection in South Africa. This is mainly attributed to the newly developed cultivars and imported cowpea genotypes. Therefore, understanding the genetic variability present in germplasm collection will aid in development of improved cowpea genotypes for nutritional value and will contribute to alleviating nutritional deficiency in African countries. The objectives of this study were to determine the variability among 70 cowpea genotypes for the concentration of mineral and phytochemical traits, identify superior genotypes for mineral and phytochemical traits, and to determine the correlation among mineral and phytochemical traits.
Materials and methods
Experimental material and locations
The 70 cowpea genotypes included in this study () originated from South Africa, Tanzania, and Nigeria and were obtained from the ARC gene bank, South Africa, and planted at two locations (Potchefstroom and Rustenburg). The trials were conducted over two seasons in 2017/18 and 2018/19 at Potchefstroom, while the Rustenburg trial was planted only in season 2017/18. Potchefstroom (1344 m altitude; 26°43.16″S, 27°47.71″E) location received an average annual rainfall of 618.88 mm and with average minimum and maximum temperature were 9.61°C and 25.48°C, respectively. The soils are generally sandy clay loams with a pH of 5.6. The Rustenburg (1170 m altitude; 25°39″S, 27°14.4″E) location received an average rainfall of 513 mm with average minimum and maximum temperature of 20.7°C and 30.5°C, respectively. The soils at Rustenburg are predominantly sandy with low pH of 4.5–5.2.
Table 1. The description of cowpea genotypes used in the study and their origin.
Experimental design and trial management
The experimental design used was an alpha lattice design with three replications. Two rows of 4 m length were used. The distances between plants and between rows were 0.4 and 1 m, respectively. The distance between replications was 1.5 m. Both rows were used for data collection and analysis. Two seeds were hand sown per hole and the plants were thinned to one after seedlings’ emergence. All agronomic management practices such as plot preparation for planting, weeding, disease and pest control were done when required and supplementary irrigation was applied when the amount of rainfall during the cropping season was not enough for optimal growth and development (Gerrano et al. Citation2015).
Data collection
The mature cowpea seeds were harvested from each genotype at 12.5% moisture contents. The seeds were manually sorted and cleaned to remove any extraneous materials. The seeds were then oven dried at 80°C for 24 h to reduce the moisture content. The dried seeds were ground using a laboratory seed grinder and then sieved using a 0.5 mm sieve. From the milled seeds, 0.5 g flour was sampled for analysis. Mineral content analysis was conducted at the ARC analytical laboratory, Pretoria, South Africa. The concentrations of nine mineral elements (Ca, Cu, Fe, K, Mg, Mn, Na, P and Zn) were determined using an Inductively Coupled Plasma – Optical Emission Spectroscopy (ICP-9820, Shimadzu) and measured in mg.100 g−1. Total phenolic content was quantified as described by Makkar (Citation1999). Gallic acid was used for the calibration curve and the results were expressed in milligram gallic acid equivalent per gram dry weight (mg GAE/g DW). Flavonoids content was quantified using aluminium chloride spectrophotometric method as described by Zhishen et al. (Citation1999). Flavonoids content was described in milligram catechin equivalent per gram dry weight (mg CE/g DW) following the use of catechin in plotting the calibration curve. Each determination was done in triplicate.
Data analysis
Data for all nutritional traits were analysed using linear mixed models of Statistical Analysis System (SAS Institute Citation2019). Data analysis included combined analysis of variance (ANOVA) across locations over the seasons. Genotypes were assumed to be fixed while locations, and seasons were assumed to be random. The genotypes were considered fixed because their genetic background is unique in the available germplasm collection. Locations represent a random sample of all possible locations representing cowpea growing environments in South Africa. Seasons representing a random sample of the combined effect of year-to-year variability.
The best linear unbiased prediction (BLUP) analysis was used to accurately determine superior genotypes for nutritional value traits. The main advantage of BLUP over other statistical methods is that it can accommodate a highly unbalanced data. BLUP analysis was done using the linear mixed model described (Mbuma et al. Citation2019).
Pearson’s correlation coefficient analysis was done (SAS Institute Citation2019) using Proc CORR to determine the inter-relationships among cowpea genotypes for nutritional traits in both locations and seasons. Two principal component analysis (PCA) biplots were constructed, the first one is based on all the genotypes, however, visualisation of the performance of genotypes was not clear due to the large number of genotypes involved in the study (data not shown). To facilitate less congested graphical presentation of genotype performance. The second PCA was done based on the top 10 performing genotypes selected for Zn and Fe, separately. Amongst micronutrients, the Fe and Zn are of interest, as both are the essential micronutrients for all higher organisms. Hence, we focused on the micronutrient’s traits association based on genotypes selected for Zn and Fe.
Results
Analysis of variance for combined locations, combined seasons and across locations and seasons
ANOVA per single trails showed significant (p < 0.05) differences for all traits measured (data not shown). Combined ANOVA for Potchefstroom and Rustenburg in season 2017/18 showed highly significant (p < 0.001) differences for genotype (G), location (L), and genotype by location (GL) interaction effects for all mineral elements and phytochemical traits (). Combined ANOVA for Potchefstroom in two seasons 2017/18 and 2018/19 showed highly significant (p < 0.001) differences for G, season (S), and genotype by season (GS) interaction effects for all traits. Across three trials [Rustenburg (2017/18) and Potchefstroom (2017/18 and 2018/19)], G, GL and GS effects showed highly significantly (p < 0.001) differences for all traits measured. The GLS effect was not estimated for all traits due to the imbalanced data.
Table 2. Mean squares for genotype (G), location (L), season (S), B (block), and R (Replication) for mineral contents and phytochemicals for all genotypes planted in Potchefstroom (2017/18 and 2018/19) and Rustenburg (2017/18).
Cowpea genotypes showed variation at Potchefstroom and Rustenburg locations in season 2017/18 for Fe, Zn, Ca, Cu, K, Mg, Mn, Na, P, total phenolics and flavonoids content ranging from 0.18–25.77 mg.100 g−1, 1.94–5.57 mg.100 g−1, 42.20–125.00 mg.100 g−1, 0.38–4.34 mg.100 g−1, 362.80–1150.67 mg.100 g−1, 70.41–224.80 mg.100 g−1, 0.17–2.17 mg.100 g−1, 16.59–131.73 mg.100 g−1, 182.71–884.67 mg.100 g−1, 1.77–11.04 mg GAE/g, and 0.38–6.91 mg CE/g, respectively (). Cowpea genotypes ARC034, TVU13953, ARC014, Glenda, ARC013, ARC035, ARC046, ARC014, ARC014, and ARC005 produced the highest concentrations of Fe, Zn, Ca, Cu, K, Mg, Mn, Na, P, total phenolics and flavonoids, respectively
Table 3. Means of genotypes performance for mineral elements and phytochemical traits planted in Potchefstroom and Rustenburg during the 2017/18 cropping season.
Genotype BLUPs
Best linear unbiased predictors (BLUPs) are estimates of random effects of individual genotypes relative to the grand mean of the population. The BLUP values can be positive or negative indicating that genotypes produced higher or lower values compared to the population mean, respectively. BLUP values were used to identify genotypes with significantly (p < 0.05) higher BLUP values than the population mean. The example of BLUP estimates and their related statistics for only Ca is shown in . The summary of genotypes that produced high BLUP values for cowpea mineral contents and phytochemicals traits for both Potchefstroom and Rustenburg trials over seasons is represented in . For Fe (ARC013 and ARC024), Zn (ARC014, ARC020, ARC044, ARC046, ARC050, and TVU13953), Ca (ARC005, ARC014, ARC018, ARC026, ARC033, ARC035, ARC040, FAHARI, IT93K-1294, and PAN311) produced significant (p < 0.05) positive BLUP values in both Potchefstroom and Rustenburg compared to the population mean (). For Cu (ARC019, ARC021, ARC022, ARC026, ARC044, ARC043, and TVU6345), K (ARC005, ARC013, ARC024, ARC035, and ARC037), Na (ARC012 and ARC014), P (98K5301, ARC013, ARC014, and ARC026), Mg (ARC005, ARC013, ARC014, ARC018, and ARC035), and Mn (ARC005, ARC043, ARC044, ARC045, ARC050, and TVU12637) produced significant (p < 0.05) positive BLUP values in both Potchefstroom and Rustenburg compared to the population mean. For total phenolics (ARC014) and flavonoids (ARC005, ARC032, and TVU13953) produced significant (p < 0.05) positive BLUP values in both Potchefstroom and Rustenburg compared to the population mean.
Table 4. Sample (example) output of best linear unbiased predictions (BLUPs) and related statistics for the Rustenburg for calcium (Ca).
Table 5. Summary of superior cowpea genotypes for mineral contents and phytochemicals traits identified and selected based on BLUP values.
The proportions of genotypes that produced significantly higher BLUP values compared to the population mean varied among the traits (). In Potchefstroom, Ca had the highest (30.00%) while Na had the lowest (5.71%) proportion of genotypes that produced high BLUP values compared to the population mean. In Rustenburg, Cu had the highest (35.71%) proportion of genotypes with high BLUP values, while Fe and Na had the lowest (17.14%). Fe and Ca produced higher proportions of genotypes with high BLUP values in Potchefstroom than in Rustenburg. Zn, Cu, K, Na, P, Mg, Mn, total phenolics, and flavonoids produced higher proportions of genotypes with high BLUP values in Rustenburg than in Potchefstroom.
Table 6. Proportions of superior genotypes selected based on the best linear unbiased prediction (BLUPs) analysis for mineral elements and phytochemical contents.
Correlations
Pearson correlation measures the strength of a linear relationship between two variables but does not determine the cause and effect of the association (Hauke and Kossowski Citation2011). Across locations (), Fe was significantly (p < 0.01) positively correlated with Cu (r = 0.38). Zn content was significantly (p < 0.001) positively correlated with all the mineral elements. Total phenolics showed significant (p < 0.05) positive correlation with Ca (r = 0.12), and negative correlations with Cu (r = −0.34), Fe (r = −0.12), Mn (r = −0.14), and Zn (r = −0.21). Flavonoids were significantly (p < 0.001) positively correlated with total phenolics (r = 77), and negatively correlated with Cu (r = −0.28), Fe (r = −0.24), and Zn (r = −0.11).
Table 7. Pearson phenotypic correlations among cowpea mineral and phytochemical contents in two locations during 2017/18 cropping season.
Principal component analysis (PCA)
Genotypes selected for PCA analysis were the top ranking 10 genotypes for Fe and Zn separately. These genotypes were used to visualise the relationship between mineral elements and phytochemical contents and determine the association of genotypes based on mineral elements and phytochemical contents. Considering a minimum threshold eigenvalue of one, the 11 measured characteristics were reduced to three PCs that explained 78.22% of the total variation observed in the cowpea genotypes (). Hence, the first three PCs, each with eigenvalues ≥ 1.00 explained 78.22% of the total variation among the studied cowpea genotypes for mineral elements and phytochemical contents. Only PC1 and PC2 were interpreted since they explained most of the variation in the data set (). All traits produced less than average (0.5) eigenvector values for PC1. In PC1, Cu, Fe, Mn, Na, and P significant had high positive loadings, while P, Ca, and Mg had significant high negative loadings. In PC2, Zn, P, Mg, and K significant had positive loadings, while F significant had high negative loadings. Genotypes BENSOGLA, ARC024, ARC049, ARC005, and ARC009 were specifically associated with Mg, Ca, and K. However, all these genotypes that were associated with high Mg, Ca, and K had low Fe and Mn ().
Figure 1. Biplot analysis for principal component 1 (PC1) on the x-axis plotted against principal component 2 (PC2) on the y-axis for the top 10 cowpea genotypes selected based on iron (Fe) mean values. See the names of the genotypes in .
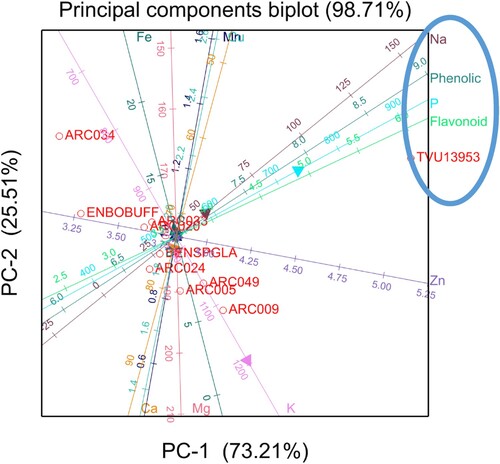
Table 8. Eigenvectors from principal component (PC) analysis for top the 10 cowpea genotypes selected based on iron (Fe) mean values.
Table 9. Eigenvectors from principal component (PC) analysis for the top 10 cowpea genotypes selected based on iron (Zn) mean values.
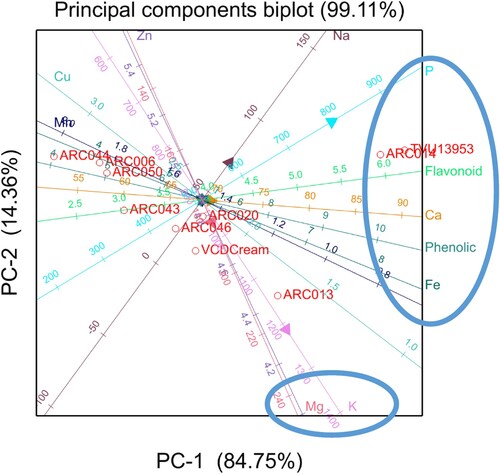
Considering a minimum threshold eigenvalue of one, the 11 measured characteristics were reduced to three PCs that explained 85.97% of the total variation observed in the cowpea genotypes (). Hence, the first three PCs, each with eigenvalues ≥ 1.00 explained 85.97% of the total variation among the studied cowpea genotypes for mineral elements and phytochemical contents. Only PC1 and PC2 were interpreted since they explained most of the variation in the data. All traits produced less than average (0.5) eigenvector values for PC1 and PC2. In PC1, flavonoids, K, P, and total phenolics had high positive loadings, while Cu, and Mn had significant high negative loadings. In PC2, Fe, Na, P, and Zn significant had positive loadings. The PCA of the top 10 genotypes selected based on Zn showed that genotypes TVU13953 and ARC014 were specifically associated with Fe, Ca, total phenolics, P, and flavonoids (). Genotypes ARC013, VCDC, ARC046, and ARC020 were specifically associated with Mg and K. However, all these genotypes that were associated with high Mg and K had low Zn, Cu, and Mn.
Figure 2. Biplot analysis for principal component 1 on the x-axis plotted against principal component 2 on the y-axis for the top 10 cowpea genotypes selected based on iron (Zn) mean values. See the names of the genotypes in .
Discussion
Significant differences among genotypes for all mineral elements and phytochemical contents indicated genetic variability among cowpea genotypes. This variability showed that genotypes produce different magnitudes of minerals and phytochemicals, further suggesting that superior genotypes can be identified for breeding (). The amount of genetic diversity among cowpea genotypes for the different minerals is vital to improve its nutritional quality through breeding (Ng’uni et al. Citation2012). Significant genotype by location interactions indicated the existence of location specific variability among genotypes for mineral elements and phytochemical contents and further highlighted the importance of testing cowpea genotypes in different environments for nutritional value improvement. Gerrano et al. (Citation2020) also reported genotype by environment interactions and suggested the existence of different patterns of genetic associations across locations. Genotypes showed variation at two locations for Fe, Zn, Ca, Cu, K, Mg, Mn, Na, P, total phenolics and flavonoids content ranging from 0.18–25.77 mg.100 g−1, 1.94–5.57 mg.100g−1, 42.20–125.00 mg.100 g−1, 0.38–4.34 mg.100 g−1, 362.80–1150.67 mg.100 g−1, 70.41–224.80 mg.100 g−1, 0.17–2.17 mg.100 g−1, 16.59–131.73 mg.100 g−1, 182.71–884.67 mg.100 g−1, 1.77–11.04 mg GAE/g, and 0.38–6.91 mg CE/g, respectively (). Similarly, Gerrano et al. (Citation2019) found variation among cowpea genotypes for the concentration of mineral elements. Significant differences were observed among the varieties for selected nutritional components and sensory attributes of cowpea leave (Ahenkora et al. Citation1998).
Significant genotype by season interactions for Potchefstroom trials indicated the existence of season specific variability among genotypes for these mineral elements and phytochemical contents and further highlighted the importance of testing cowpea genotypes in different environments for nutritional value improvement (). This also indicated potential effect of seasonal weather variability on mineral elements and phytochemicals. However, seasonal effect and its interactions are confounded and unpredictable and, therefore, not useful for guiding breeding and selection strategies (Mbuma, Gerrano, et al. Citation2020; Mbuma, Zhou, et al. Citation2020).
Cowpea genotypes ARC034, TVU13953, ARC014, Glenda, ARC013, ARC035, ARC046, ARC014, ARC014, and ARC005 produced the highest concentrations of Fe, Zn, Ca, Cu, K, Mg, Mn, Na, P, total phenolics and flavonoids, respectively (). Gerrano et al. (Citation2019) reported that Encore in Mn and Zn, while genotype TVU13953 was higher in Fe and Zn. Genotypes with high concentrations of micro-nutrients in their grain could be used as potential parents for future breeding and crossing thereby enhancing the nutritional value of cowpea in South Africa.
BLUP was used to determine the genetic values of genotypes. BLUP was used because it can accommodate imbalanced data due to missing plots, thereby increasing the accuracy of determining the genetic values. Results () have shown that cowpea genotypes for Fe (ARC013 and ARC024), Zn (ARC014, ARC020, ARC044, ARC046, ARC050, and TVU13953), Ca (ARC005, ARC014, ARC018, ARC026, ARC033, ARC035, ARC040, FAHARI, IT93K-1294, and PAN311), total phenolics (ARC014) and flavonoids (ARC005, ARC032, and TVU13953) produced significantly higher BLUP values compared to the population mean in Potchefstroom and Rustenburg. Such genotypes would be ideal for enhancing breeding for multiple nutritional quality traits in cowpea breeding programme. Genotypes with significantly higher BLUP values for several traits suggested that there is a potential to improve several minerals and phytochemical traits. Genotypes that produced significantly higher BLUP values for minerals and phytochemicals can potentially be used as parents for future crossing in cowpea breeding. Thus, during crossing, several traits can potentially be combined in the progeny. This suggested that it is possible to create populations combining several desirable traits in cowpea breeding, thereby enhancing nutritional quality of cowpea. The number of genotypes with high BLUP values were more in Rustenburg compared to Potchefstroom (), which implied that higher genetic gains are expected in Rustenburg than in Potchefstroom.
Significant positive correlations were observed among most of the measured mineral traits (), which indicated that when selection is applied for one of these traits, an indirect improvement could be observed in the other traits. Zn and Fe were positively correlated with other minerals indicating that nutritional value in cowpea would be enhanced through selection and help the breeders for simultaneous selection in the breeding programme (Gerrano et al. Citation2019). Total phenolics and flavonoids were strongly correlated. This may be because these nutrients have important similar roles in plant development, particularly in lignin and pigment biosynthesis. They also provide structural integrity and scaffolding support to plants (Bhattacharya et al. Citation2010). Hence, the selection of any one of these traits will lead to an increase in the concentration of the phytochemicals, thereby enhancing the health benefits of cowpea.
However, minerals showed significant negative correlations with total phenolics (), which indicated that selecting for total phenolics might unintentionally reduce the content of minerals. These results will contribute to the development of improved cowpea cultivars particularly for nutritional value towards alleviating malnutrition in South Africa. Gerrano et al. (Citation2019) reported significant positive association of some micronutrient traits in South Africa.
PCA was done to visualise the performance of genotypes for nutrients and phytochemicals in both Potchefstroom and Rustenburg. A typical eigenvector (loadings) value is equal to 1, hence, an eigenvector of ±0.3 (Hair et al. Citation1998) can be considered to meaningfully explain variation ( and ). The positive and negative sign in the biplots are an indication of the direction of the correlation between the components on the PCA biplots and the variables in the quadrats (Johnson Citation1998). The PCA of top 10 genotypes selected based on Fe showed that genotype TVU13953 was specifically associated with Na, total phenolics, P, and flavonoids and these traits showed positive association with each other (). The results indicated that an increase of one of the traits in genotype TVU13953 will simultaneously improve the breeding of the other traits. Results also indicated that enhancing one of these traits i.e. Mg, Ca, and K in genotypes BENSOGLA, ARC024, ARC049, ARC005, and ARC009 would result in a decrease or reduction of Fe and Mn content. Fe is one of the most important micronutrients for development of human body and it has other related health benefits, thus, it would be ideal to breeding for high Fe at the expense of other micronutrients such as Mg, Ca, and K. The PCA of top 10 genotypes selected based on Zn showed that genotypes TVU13953 and ARC014 was specifically associated with Fe, Ca, total phenolics, P, and flavonoids (). Even though the correlation analysis showed negative association among the nutrients and phytochemical traits, the PCA results showed positive association between Fe content and phytochemicals (total phenolics and flavonoids) for TVU13953 and ARC014, indicating that these traits would be simultaneously improved for these two specific genotypes. Cowpea genotypes such as TVU13953 and ARC014 which had high levels of minerals and phytochemicals could be of significant value in cowpea improvement and can be used as parents for future crossing and introgression breeding. Results also showed that an increase in Mg and K for cowpea genotypes ARC013, VCDC, ARC046, and ARC020 will reduce the amount of Zn, Cu, and Mn concentrated in these genotypes due to negative association among the traits. Knowledge on trait association could be exploited during crossing combination of desirable traits and, thereby, enhancing the breeding efficiency in cowpea programme.
In conclusions, significant differences among the cowpea genotypes and across locations and seasons were observed, which indicated the potential of identifying superior genotypes for high mineral elements and phytochemicals. The study also showed the importance of evaluating cowpea genotypes in several locations and seasons. BLUP analysis successfully identified genotypes that produced significantly higher trait values than the rest of the entries and such genotypes can be used for future crossing which will enhance the nutritional value of cowpea. PCA showed that genotype TVU13953 and ARC014 were associated with high Ca, Fe, flavonoids, and total phenolics, values. Such genotype can potentially be used as a parent in cowpea breeding to develop high nutritional value genotypes that can possibly address the alleviating malnutrition through biofortification in African countries.
Acknowledgements
The authors would like to thank the University of the Free State Central Research Fund (CRF), South Africa for funding the project. We thank the Agricultural Research Council, South Africa for providing the germplasm, trial management and data collection.
Disclosure statement
No potential conflict of interest was reported by the author(s).
Additional information
Funding
Notes on contributors
Ntombokulunga W. Mbuma
Ntombokulunga W. Mbuma is a lecturer and researcher at the University of the Free State in the Department of Plant Sciences and is also leading a Plant Breeding research on development of improved cowpea genotypes based on grain yield and nutritional value.
Abe Shegro Gerrano
Abe Shegro Gerrano is a researcher at the Agricultural Research Council. Currently, he is developing superior cowpea genotypes for biofortification and high yield and nutritional value.
Ntjapa Lebaka
Ntjapa Lebaka is a researcher at South African Breweries Hop Farms.
Stephen Amoo
Stephen Amoo is a researcher at the Agricultural Research Council.
Alina Mofokeng
Alina Mofokeng is a researcher at the Agricultural Research Council. Currently, she is developing superior cowpea genotypes for biofortification, and high yield and nutritional value.
Maryke Labuschagne
Maryke Labuschagne is currently professor of Plant Breeding in the Department of Plant Sciences at the University of the Free State and is also leading the NRF SARChI Chair in Diseases and Quality of Field Crops.
References
- Agbogidi OM, Egho EO. 2012. Evaluation of eight varieties of cowpea [Vigna unguiculata (L.) Walp] in Asaba agro-ecological environment, Delta State, Nigeria. Eur J Sustain Dev. 12:303–314.
- Ahenkora K, Adu Dapaah HK, Agyemang A. 1998. Selected nutritional components and sensory attributes of cowpea (Vigna unguicula [L.] Walp) leaves. Plant Foods Hum Nutr. 52:221–229.
- Belane AK, Dakora FD. 2011. Levels of nutritionally-important trace elements and macronutrients in edible leaves and seed of 27 nodulated cowpea (Vigna unguiculata L. Walp.) genotypes grown in the Upper West Region of Ghana. Food Chem. 125:99–105.
- Bhattacharya A, Sood P, Citovsky V. 2010. The roles of plant phenolics in defence and communication during Agrobacterium and Rhizobium infection. Mol Plant Pathol. 11:705–719. doi:10.1111/j.1364-3703.2010.00625.x.
- Carnovale E, Marletta L, Marconi E, Brosio E. 1990. Nutritional and hydration properties in cowpea. In: Ng NQ, Monti LM, editors. Cowpea genetic resources. Ibadan: IITA; p. 111–118.
- Frota KMG, Filho RDS, Ribeiro VQ, Arêas JAG. 2014. Cowpea protein reduces LDL-cholesterol and apolipoprotein B concentrations, but does not improve biomarkers of inflammation or endothelial dysfunction in adults with moderate hypercholesterolemia. Nutr Hosp. 31:1611–1619.
- Gerrano AS, Adebola PO, van Rensburg WS, Venter SL. 2015. Genetic variability and heritability estimates of nutritional composition in the leaves of selected cowpea genotypes [Vigna unguiculata (L.) Walp.]. HortScience. 50:1435–1440.
- Gerrano AS, van Rensburg WSJ, Adebola PO. 2017. Nutritional composition of immature pods in selected cowpea (Vigna unguiculata (L.) Walp.) genotypes in South Africa. Aust J Crop Sci. 11:134–141.
- Gerrano AS, van Rensburg WSJ, Venter SL, Shargie NG, Amelework BA, Shimelis H, Labuschagne MT. 2019. Selection of cowpea genotypes based on grain mineral and total protein content. Acta Agric Scand B Plant Soil Sci. 62:155–166.
- Gerrano AS, van Rensburg WSJ, Mathew I, Shayanowako AIT, Bairu MW, Venter SL, Swart W, Mofokeng A, Mellem J, Labuschagne M. 2020. Genotype and genotype x environment interaction effects’ on the grain yield performance of cowpea genotypes in dryland farming system in South Africa. Euphytica. 216:80. doi:10.1007/s10681-020-02611-z.
- Global Nutrition. 2017. Global nutrition report. [accessed 2019 Nov 12]. https://globalnutritionreport.org/reports/2017-global-nutrition-report/.
- Hair JF, Andrson JR, Tatham RE, Black WC. 1998. Multivariate data analysis. 5th ed. London: Prentice-Hall International, Inc.
- Hauke J, Kossowski T. 2011. Comparison of values of Pearson’s and Spearman’s correlation coefficients on the same sets of data. Quastiones Geogr. 30:97–93.
- Johnson DE. 1998. Applied multivariate method for data analysis. Pacific Grove (CA): Duxbury Press.
- Lambot C. 2002. Industrial potential of cowpea. In: Fatokun CA, Tarawali PM, Singh PM, Kormawa M, Tarmo M, editors. Challenges and opportunities for enhancing sustainable cowpea production. Ibadan: International Institute of Tropical Agriculture; p. 367–375.
- Makkar HPS. 1999. Quantification of tannins in tree foliage: a laboratory manual for the FAO/IAEA co-ordinated research project on ‘use of nuclear and related techniques to develop simple tannin assay for predicting and improving the safety and efficiency of feeding ruminants on the tanniniferous tree foliage’. Vienna: Joint FAO/IAEA Division of Nuclear Techniques in Food and Agriculture.
- Mbuma NW, Zhou MM, van der Merwe R. 2019. Comparing family with individual genotype breeding parameters for cane yield in sugarcane populations. S Afr J Plant Soil. 36:11–19.
- Mbuma NW, Gerrano AS, Lebaka N, Mofokeng A, Labuschagne M. 2020. The evaluation of a Southern African cowpea germplasm collection for seed yield and yield components. Crop Sci. doi:10.1002/csc2.20336.
- Mbuma NW, Zhou MM, van der Merwe R. 2020. Family by environment interactions for sugarcane yield and its components in South Africa. Crop Sci. doi:10.1002/csc2.20025.
- Ng NQ, Padulosi S. 1988. Cowpea genepool distribution and crop improvement. In: Ng NQ, Perrino P, Attere F, Zedan H, editors. Crop genetic resources of Africa. Vol. 2. p. 161–174. Rome: International Board for Plant Genetic Resources (IBPGR).
- Ng’uni D, Geleta M, Hofvander P, Fatih M, Bryngelsson T. 2012. Comparative genetic diversity and nutritional quality variation among some important southern African sorghum accessions [Sorghum bicolor (L.) Moench]. Aust J Crop Sci. 6:56–64.
- Padulosi S, Ng QN, Perrino P. 1997. Origin, taxonomy, and morphology of Vigna unguiculata (L.) Walp. In: Singh BB, Raj M, editors. Advances in cowpea research. Ibadan, Nigeria: IITA; p. 1–12.
- SAS Institute. 2019. SAS/STAT user’s guide, version 9.2. Cary (NC): SAS Institute.
- Souza E, Sorrels ME. 1991. Relationships among 70 American oat germplasm. I. Cluster analysis using quantitative characters. Crop Sci. 31:599–605.
- Zhishen J, Mengcheng T, Jianming W. 1999. The determination of flavonoid contents in mulberry and their scavenging effects on superoxide radicals. Food Chem. 64:555–559.