
 ?Mathematical formulae have been encoded as MathML and are displayed in this HTML version using MathJax in order to improve their display. Uncheck the box to turn MathJax off. This feature requires Javascript. Click on a formula to zoom.
ABSTRACT
This study investigated the agronomic response and economic return of wheat grown in compacted and non-compacted soils to represent the conditions of non-controlled (non-CTF) and controlled traffic (CTF) systems, respectively. Yield-to-nitrogen responses were derived after application of urea, DMPP-treated urea, and UAN at rates between 0 and 300 kg ha−1 N. Soil properties were measured to guide parametrisation of APSIM, which was used to assess long-term (50 years) effects of CTF and non-CTF soil conditions on crop productivity, rainfall-use efficiency (RUE) and surface runoff. Grain yield and yield components were significantly higher in CTF compared with non-CTF. When N inputs were optimised, N use efficiency (NUE) was more than double in CTF (≈23%) compared with non-CTF (≈9%). RUE was about 15% higher in CTF, which concurrently reduced the amount of surface runoff compared with non-CTF. For years with average rainfall (240-mm in-crop), yield penalties of up 12% may be expected in non-CTF. APSIM simulations showed that increased productivity, and inter-annual yield stability, can increase gross margin of wheat by AUD30-50 ha−1 depending on in-crop rainfall and the tillage method used. In non-CTF systems, improvements in NUE and RUE are constrained by soil compaction. Enhanced efficiency fertilizers cannot compensate for other stresses caused by compaction and therefore cannot achieve the same NUE and RUE as the CTF system. Adoption of CTF in water-constrained environments improves profitability and resource-use efficiency.
| Nomenclature | ||
| AE | = | Agronomic efficiency (kg kg–1): yield increase (ΔY, kg ha–1) of harvested product due to an increment of applied N (ΔN, kg ha–1) of a specified N fertiliser form (Equation (5)). The increment in applied N is calculated as the difference between a given N rate and nil applied N (Antille and Moody Citation2021). |
| APSIM | = | Agricultural Production Systems Simulator (https://www.apsim.info/, Keating et al. Citation2003; Holzworth et al. Citation2014). |
| CLL | = | Crop lower limit (m3 m–3) (Dalgliesh et al. Citation2016). |
| CTF, non-CTF | = | Controlled traffic farming (CTF): a mechanisation system in which all load-bearing wheels are confined to the least possible area of permanent traffic lanes. Non-controlled traffic farming (non-CTF): a mechanisation system in which varying equipment operating and track widths translate into random or disorganised field traffic patterns. |
| DMPP | = | Urea treated with 3,4-dimethyl pyrazole phosphate (46% N). |
| DUL | = | Drained upper limit (m3 m–3) (Dalgliesh et al. Citation2016). |
| η | = | Total porosity of soil (%, v/v). |
| GI | = | Gross income (AUD ha–1): grain yield (kg ha–1) multiplied by price of grain (AUD kg–1). |
| GM | = | Gross margin (AUD ha–1): difference between GI and total variable costs. |
| HI | = | Harvest index (%, w/w): calculated as grain yield divided by aboveground biomass. |
| = | Instantaneous infiltration rate at time t (mm h–1). | |
| KSAT | = | Saturated hydraulic conductivity (mm day–1). |
| MERN | = | Most economic rate of nitrogen (kg ha–1). |
| NUE | = | Nitrogen (N) use efficiency, expressed as apparent N recovery in grain (%, Equation (4)) (Baligar et al. Citation2001; Antille and Moody Citation2021). |
| = | Soil bulk density (g cm–3). | |
| RUE | = | Rainfall use efficiency: the ratio of grain yield (kg ha–1) to total in-crop rainfall (mm) (Hochman et al. 2009). |
| SAT | = | Soil water content at saturation (m3 m–3) (Ngo-Cong et al. Citation2020). |
| SD | = | Standard deviation. |
| ST | = | Shallow tillage (150 mm deep or less). |
| TGN | = | Total nitrogen in grain (%, w/w). |
| TGW | = | Thousand-grain weight (g). |
| TVC | = | Total variable costs (AUD ha–1). |
| UAN | = | Urea-ammonium nitrate (32% N, solution). |
| ZT | = | Zero-tillage. |
Introduction
Over the past few decades, the development and adoption of large farm machinery have contributed to increased work rates and improved timeliness of field operations, which have reduced labour requirements (Jørgensen Citation2012). A drawback of this trend has been the associated increase in farm machinery weight (Chamen et al. Citation2003). Coupled with high traffic intensities (e.g. 40 Mg km−1 ha−1; Botta et al. Citation2007), as commonly observed in mechanised agricultural systems, this has resulted in increased risk of soil damage due to compaction (Tobias et al. Citation2001; Alakukku et al. Citation2003). Soil compaction is often persistent, particularly in the subsoil (Radford et al. Citation2007; Berisso et al. Citation2012), and its effects intensify with repeated passes (Seehusen et al. Citation2019). The effectiveness of natural processes in alleviating soil compaction varies widely depending on soil type, and the extent of wetting and drying cycles (Dexter Citation1991), but the rate of amelioration of compaction by such processes decreases with an increase in soil depth (McHugh et al. Citation2009). Given high traffic intensities and lack of opportunities for amelioration of soil by natural processes, deep tillage is sometimes required between crop cycles (Spoor and Voorhees Citation1986). If subsequent field traffic is not confined to permanent traffic lanes, a vicious cycle of compaction followed by (deep) tillage and re-compaction can be created, which is energy-demanding and therefore expensive (Botta, Antille, et al. Citation2019). This reinforces the need to avoid compaction, particularly in the subsoil (Spoor et al. Citation2003).
Compaction induced by vehicle traffic increases soil strength, and may reduce water and nutrient uptake by plants as root development and penetration into the soil may be impaired. These effects can lead to reduced crop yield and profitability (Wolkowski Citation1990; Unger and Kaspar Citation1994). Several studies have demonstrated negative effects of compaction on soil physical and hydraulic properties, and therefore on important soil processes and function, including: gaseous exchange between the soil and the atmosphere (Archer and Smith Citation1972), water infiltration into soil, water retention and transmission (internal drainage) within the soil (Horton et al. Citation1994), and increased emission of greenhouse gases (Antille, Chamen, et al. Citation2015; Tullberg et al. Citation2018). Such effects, together with impacts on crop yield, have been observed in both dryland (Sadras et al. Citation2005; Li et al. Citation2007) and irrigated cropping systems (McGarry Citation1990; Braunack et al. Citation1995), and across a wide range of soil types (from lighter to heavier) and environmental conditions (e.g. Hadas et al. Citation1985; Radford et al. Citation2001). Concerns over the long-term sustainability of arable cropping associated with progressive deterioration of the soil resource have contributed to the development of more efficient field traffic management strategies; namely, controlled traffic farming systems (Tullberg et al. Citation2007; Chamen Citation2015). Controlled traffic farming (CTF) is a mechanisation system in which permanent traffic lanes and crop beds are distinctly and permanently separated to simultaneously optimise soil conditions for trafficability with farm machinery as well as for crop growth (ACTFA, https://www.actfa.net/; Antille, Chamen, et al. Citation2015).
Much of the past research has shown how different nitrogen (N) fertiliser formulations, including enhanced efficiency fertilisers (Shoji et al. Citation2001), can increase N use efficiency (NUE) and yield (e.g. Watson et al. Citation1994; Halvorson and Bartolo Citation2014; Antille, Hoekstra, et al. Citation2015), but little attention has been given to the underlying effect of soil compaction, with some exceptions (e.g. Ruser et al. Citation2006; Gregorich et al. Citation2014). A recent study by Hussein et al. (Citation2018) on grain sorghum (Sorghum bicolor L., Moench) suggested that CTF systems may have the potential to either reduce N fertiliser inputs without compromising crop yield or increase crop yield for a given fertiliser input. Millington et al. (Citation2017) showed enhanced structural conditions in soils established under CTF, which supported earlier observations made by Lipiec and Stępniewski (Citation1995) showing increased water and nutrient uptake by the crop in the absence of traffic compaction. However, there appear to be no detailed studies reporting on the effects of compaction on the actual yield-to-nitrogen response relationship of enhanced efficiency fertilisers, and the implications for NUE and RUE in CTF systems. For Australian grain cropping systems, where CTF is practiced in about 40% of the grain cropped land (Mitchell et al. Citation2019), this is an important consideration for N management and rainfall-use efficiency because of the continuous commitment of the industry to increasing NUE and RUE without compromising yield or profitability (Angus and Grace Citation2017). The dataset reported here is relevant to other industries (e.g. cotton, sugar), which are also committed to reducing the environmental footprint of both N and water use by crops (Kirkegaard et al. Citation2014; Hedayati et al. Citation2019). In those industries, adoption of CTF is still small, and slowly increasing (Bluett et al. Citation2019), but these effects are not well documented. As such, this work is central to the objectives of the Australian Government’s ‘More Profit from Nitrogen Program’ (http://www.crdc.com.au/more-profit-nitrogen), which aims to increase farm profitability with reduced environmental impact by increasing NUE of intensive cropping and pasture systems (Antille and Moody Citation2021). The work reported in this article takes a system’s view on possible limitations on improving NUE and RUE in rainfed cropping when soil is affected by compaction.
Objectives and scope
The objectives of this work were to: (1) determine the effects of controlled (CTF) and non-controlled traffic (non-CTF) management on the yield-to-nitrogen (N) response relationship of wheat (Triticum aestivum L.) for a range of N fertiliser formulations, (2) determine the effect of soil compaction on RUE and fertiliser NUE to enable differences between the two traffic systems to be quantified, (3) parametrise the Agricultural Production Systems Simulator (APSIM) model (Keating et al. Citation2003; Holzworth et al. Citation2014) to aid the interpretation and generalisation of experimental findings by: (i) developing functions that capture the effects of N fertilisation and traffic compaction on long-term crop productivity, RUE and surface runoff, and (ii) conducting technical-economic analyses to quantify the effects of traffic-induced soil compaction on crop gross margin and economic return from fertiliser used on crops. These results should help determine the most economic rate of N application for the two traffic systems.
Materials and methods
Experimental site
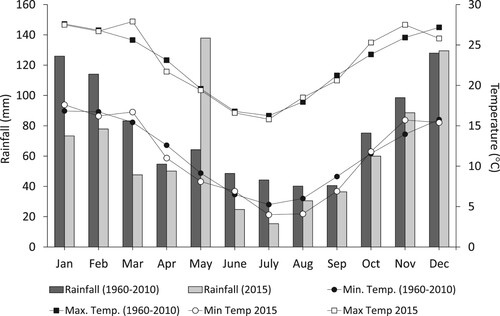
The experiment was conducted at the research grounds of the Centre for Agricultural Engineering at the University of Southern Queensland (27°36ʹ35.70ʺS, 151°55ʹ49.38ʺE, elevation: 692-m above-sea-level), in Toowoomba (Queensland, Australia), during the 2015 winter season. Rainfall and temperature records for the experimental site are shown in . Total rainfall in May 2015 (138 mm) was much higher than long-term (1960–2010) records for this month (57 mm). However, rainfall was relatively lower in June-July and October 2015, respectively. Overall, mean air temperatures did not depart significantly from the long-term records, but minimum temperatures were slightly below average, particularly in early spring.
Figure 1. Monthly rainfall, maximum and minimum temperatures for 2015, and long-term (1960–2010) records for Toowoomba, Queensland, Australia (data sourced from BOM 2017, http://www.bom.gov.au/).
The soil at the site is described in Isbell (Citation2002) as a Red Ferrosol (Oxisol in the NRCS-USDA Soil Taxonomy) and is commonly used in Queensland for grain cropping. The soil is moderately well-drained and has a gentle, uniform slope of less than 0.5%. Soil textural analyses (Gee and Bauder Citation1986) for the bulked 0–200 mm layer were: 69% clay (<0.002 mm), 11% silt (0.002–0.02 mm), and 20% sand (0.02–2 mm). For the bulked 200–500 mm depth interval, soil textural analyses reported 68% clay, 6% silt, and 26% sand. The site had been used for cereal cropping for at least three years before the experiment was established.
The experiment was conducted in two adjacent field strips referred to as CTF and non-CTF, respectively; there were 30 plots per strip (plot’s dimensions: 5-m × 3.25-m) and 13 plant rows per plot. Plots within each strip were laid-out in a completely randomised design and subject to the fertiliser treatments described here. The entire site was subsoiled to a depth of 350 mm to remove any pre-existing compaction-induced variability at the site, and a powered rotary harrow was subsequently used to smooth and level off the surface. No further operations were conducted in soil representing the CTF system, but 9 adjacent wheel-beside-wheel passes of a Belarus 920 tractor operated at 5 km h−1 (front tyres, 11.2–20 at 0.20 MPa; rear tyres 18.4R30 at 0.10 MPa) were needed after tillage to represent ‘random’ traffic on the non-CTF plots. This operation achieved a uniform soil bulk density that was about 13% higher than the CTF treatment and ensured that compaction × fertiliser N effects on the crop were not influenced by pre-existing compaction. A similar approach was used by Godwin et al. (Citation2015) prior to establishing long-term experiments investigating tillage × traffic effects on crop performance and soil properties, albeit with different machinery. While the tractor employed in our study was lighter than other tractors and farm vehicles commonly used in grain cropping systems in Australia, the required compaction was achieved by performing multiple passes at low speed (Soane et al. Citation1980–Citation1981; Patel and Mani Citation2011). This was consistent with observations made in other studies that investigated the effect of light-weight vehicles traffic on soil compaction (e.g. Botta, Bienvenido, et al. Citation2019; McPhee et al. Citation2020). The percentage increase in soil bulk density, chosen in this work to represent the mechanical condition of soil affected by compaction in non-CTF, falls within the range reported by previous studies that investigated compaction under conventional traffic systems (e.g. Ansorge and Godwin Citation2007; Botta et al. Citation2007). Mean ± standard deviation (SD) soil water content at the time of traffic was 18% ± 1% (w/w) and 21% ± 0.6% (w/w) at the 0–200 mm and 200–400 mm depth intervals, respectively. Expressed volumetrically, this soil water content range corresponds, approximately, to a suction of 600 cm (J. E. McPhee, unpublished data, Personal Communication).
Wheat (Triticum aestivum L. c.v. Sunmate) was sown on 12 June 2015 to achieve about 100 plants m−2 (Angus and Fischer Citation1991), according to standard agronomic practice in southern Queensland, using a minimum-tillage planter fitted with Janke press wheels and knife points at 250-mm row-spacing. Knife points were preferred to disc openers to allow for small amount of soil disturbance within the seed zone, which ensured good seed-to-soil contact and satisfactory plant emergence in both traffic treatments (Aikins et al. Citation2019, Citation2020). The disturbance caused by knife point openers was shallow and did not have any effect on soil loosening below the planting depth. Plant stand, as determined by visual assessment of the crop during its establishment, was uniform across traffic treatments. Therefore, traffic treatment effects on crop performance reflect differences in soil mechanical conditions (plant population was similar in both traffic treatments). Phenological stages (Zadoks et al. Citation1974) were recorded during the crop cycle together with measurements of aboveground biomass. Supplementary irrigation was applied after sowing (≈25 mm) to ensure crop establishment was satisfactory, and within the recommended timeframe for winter cereal crops in southern Queensland. A blanket fertiliser application (40 kg ha−1) of Granulock® Starter-Z fertiliser (11% N, 22% P2O5, 4% SO3, 1% ZnO) was applied to all plots at sowing to assist crop establishment.
Three types of fertiliser were used: urea (46% N), urea treated with 3,4-dimethyl pyrazole phosphate (DMPP), commercially known as ENTEC® urea (46% N), and urea ammonium nitrate (UAN, 32% N, solution). DMPP is a nitrification inhibitor and is used in Australia because of its potential to mitigate denitrification losses (e.g. Wallace et al. Citation2018). Fertilisers were hand-applied in a band (≈50 mm wide, ≈50 mm deep) next to the plant row at field equivalent rates between 0 (control) and 300 kg ha−1 N at regular increments of 100 kg ha−1 N. The full N application rate for each treatment was halved, and the splits applied at tillering (7 August 2015) and subsequently at early stem elongation (20 August 2015), respectively, with 3 replicates of each treatment. A summary of the experimental design is given below:
Three fertiliser types (urea, DMPP-treated urea, urea ammonium nitrate) × 3 fertiliser levels (100, 200, 300 kg ha−1 N) × 3 replicates plus 3 control plots without fertiliser: 30 plots.
Two traffic treatments (CTF and non-CTF).
Total number of plots: 30 × 2 = 60.
Soil measurements and analyses
Soil physical and hydraulic properties were measured to guide parameterisation and application of APSIM and model the long-term impact of simulated soil conditions of CTF and non-CTF on crop productivity, surface runoff, and RUE. Soil bulk density (ρb) was determined for the 0–300 mm depth layer at regular increments of 100 mm by taking 50-mm diameter cores using a hydraulic soil corer. Measurements were taken three times (n = 3) before and after the traffic treatments were imposed, and ρb was determined as per Blake and Hartge (Citation1986) (). Maximum dry bulk density derived from the Standard Proctor test (Australian Standard Citation2003) reported a value of 1.70 g cm−3 at a soil water content of 21.2% (w/w). Total porosity of soil (η) was derived from density properties (McKenzie et al. Citation2002) using a nominal particle density (ρp) of 2.65 g cm−3, which was appropriate for the soil type investigated (Hurlbut and Klein Citation1977). Soil penetration resistance was measured at 25 mm depth increments with a RIMIK® CP200 recording penetrometer (125 mm2 base area, 30° apex angle) to a depth of 500 mm and at constant speed (0.05 m s−1). Gravimetric soil water content was simultaneously determined and used as a co-variate of penetration resistance (ASABE Citation2019). Measurements of soil water content and soil penetration resistance were conducted ten times (n = 10) in each traffic strip. Unconfined, saturated infiltration rates were measured with the double-ring infiltrometer method (Parr and Bertrand Citation1960). Infiltration rates were obtained by differentiating Kostiakov’s equation (Equation (1)) with respect to time to describe the relationship between the rate of infiltration and time (Equation (2)). Measurements were replicated three times (n = 3) for each traffic treatment.
(1)
(1)
(2)
(2) where Ft is cumulative infiltration (mm) at time t (h), a and n are constants, and It is instantaneous infiltration rate (mm h−1) at time t (h).
Table 1. Soil bulk density (ρb), total porosity of soil (η), crop lower limit (CLL), drained upper limit (DUL), soil water content at saturation (SAT), and saturated hydraulic conductivity (KSAT) used in APSIM simulations for CTF and non-CTF conditions for a Red Ferrosol in Toowoomba (Queensland, Australia).
Saturated hydraulic conductivity (KSAT) of soil was measured for both CTF and non-CTF plots using the constant head method (Klute Citation1965). For this, undisturbed soil samples were collected using 2-inch diameter by 2-inch long cylinders. The outflow leachate was collected in beakers at the bottom of the column. Measurements of leachate and timing of the duration required to obtain the leachate enabled KSAT to be determined. The KSAT for a vertical soil core under constant head is given by Equation (3) (after Hillel Citation2004).
(3)
(3) where V is the volume of solution (mm3), L is the length of the soil core (mm), A is the area of the soil core (mm2), H is the water head from base of core to top of solution (mm), and t is the time (h) for V to flow through.
Soil pH1:5 and electrical conductivity of soil (EC1:5) were 6.22 and 0.07 dS m−1, respectively, based on Rayment and Lyons (Citation2011).
Crop measurements and analyses
The crop was harvested by hand-cutting 2-m length from each of the two central rows of each plot at approximately 20 mm above the soil surface on 11 November 2015. After drying (60°C, 72 h) these samples were used to determine grain yield, expressed as kg ha−1 at 14% (w/w) moisture content, and the following yield components: harvest Index (HI), the ratio grain weight-total aboveground biomass (Donald and Hamblin Citation1976); thousand-grain weight (TGW) and number of grains per square meter (MAFF Citation1986, Method No.: 73). Cumulative dry matter (aboveground biomass) was also determined at major phenological stages (Zadoks et al. Citation1974) from one-linear meter samples per plot collected from the second plant row from the edge of the plot. Total N in grain (MAFF Citation1986, Method No.: 48) was used to estimate apparent N recovery in grain by the difference method, subsequently used to denote NUE. Differences in yield between fertilised and non-fertilised crops, relative to N applied as fertiliser, were used to denote agronomic efficiency (AE). These relationships are shown in Equations (4) and (5), respectively (Baligar et al. Citation2001; Antille and Moody Citation2021):
(4)
(4)
(5)
(5) where NUE is N use efficiency (%) based on apparent N recovery in grain, UF and UF = 0 are N recovered in grain (kg ha−1) from fertilised- and non-fertilised (control) crops, respectively, and NRATE is N application rate (kg ha−1). U is determined as:
, where Y is grain yield (kg ha−1) and
is grain-N concentration (%). AE is agronomic efficiency (kg kg−1), YF and YF=0 are grain yields (kg ha−1) corresponding to fertilised- and non-fertilised (control) crops, respectively.
Yield-to-nitrogen response relationships were examined by applying nonlinear regression analyses, and by fitting quadratic functions (Equation (6)) to the data. The approach used in this work is adopted from other studies (James and Godwin Citation2003; Antille et al. Citation2017) dealing with cereal crop responses to applied N fertiliser, and assumes a quadratic-plateau relationship.
(6)
(6) where y is grain yield (kg ha−1) and x is nitrogen applied (kg ha−1), and a, b and c are regression coefficients.
The gross margin (GM) was estimated as the difference between gross income (GI) and total variable costs (TVC). The GM analysis uses the most economic rate of N (MERN, kg ha−1) to estimate the fertiliser cost. Therefore, GM reflects the gross profitability of the crop when the fertiliser N input is optimised. The MERN value is obtained when the first differential of the quadratic function is equated to the price ratio (Kachanoski Citation2009; Antille and Moody Citation2021). Price ratio (PR) is defined as the price of N (PN, AUD kg−1) divided by the price of grain (PG, AUD kg−1). These relationships are shown in Equations (7) and (8).
(7)
(7) and
(8)
(8)
The price ratio (PR) is equivalent to the breakeven ratio and indicates the extra return of the grain that just covers the extra unit of N added. At this point, the economic return from N applied as fertiliser is maximised. Price ratio and MERN calculations were based, respectively, on PN and PG for the corresponding year of harvest. A simplification of these analyses was made by assuming that variable costs, other than fertiliser cost, were identical in both traffic treatments. Further studies should be undertaken to account for differences in machinery and energy-related costs (e.g. Tullberg Citation2000), which were not the focus of this study. In well-designed CTF systems in Australia, the area subject to traffic typically occupies 15% (or less) of the cultivated field area, particularly when permanent zero-tillage is practised. By contrast, where CTF is not practised, the field cropped area affected by traffic is often greater than about 45% when zero-tillage is practised, about 65% in shallow or reduced tillage systems, and 85% or more in conventional tillage systems that rely on primary tillage operations for crop establishment (Antille, Peets, et al. Citation2019; Antille, Chamen, et al. Citation2019).
In Australia, both tillage systems (shallow and zero-tillage) are commonly used in grain cropping (Dang et al. Citation2018), so GM calculations were adjusted to reflect the yield effect of the areas affected or not affected by traffic compaction in typical CTF and non-CTF systems. For shallow or reduced tillage (ST), it was assumed that 65% of the cultivated field area in non-CTF systems was subject to traffic compaction, but this was 45% for zero-tillage (ZT) and 15% for CTF + zero-tillage system. This is a conservative estimate as the traffic footprint in CTF + ZT systems can be as low as 10–12% of the field cropped area. Hence, the corresponding GI for each traffic system was obtained by adjusting the corresponding grain yield for NRATE = MERN, that is YMERN in Equations (9)–(11) by these percentages, assuming the balance of field area to be non-compacted. This was considered to be a fair assumption based on earlier studies (e.g. Galambošová et al. Citation2017). Thus,
(9)
(9)
(10)
(10)
(11)
(11) where YMERN is crop yield for NRATE = MERN (kg ha−1); 0.65 and 0.35 are trafficked and non-trafficked areas in non-CTF when shallow tillage (ST) is practised, respectively; 0.45 and 0.55 are trafficked and non-trafficked areas in non-CTF when zero-tillage (ZT) is practised, respectively; 0.15 and 0.85 are trafficked and non-trafficked areas in the CTF system, respectively. This assumption is considered to be fair as ZT is practised by most growers who have converted to CTF (Tullberg et al. Citation2007), with some exceptions (e.g. Dang et al. Citation2018).
APSIM modelling
Simulations were conducted using the Agriculture Production System Simulator (APSIM, https://www.apsim.info/) model (Keating et al. Citation2003; Holzworth et al. Citation2014), and involved dryland wheat cropping, grown on a Red Ferrosol under CTF and non-CTF conditions. APSIM simulations were conducted to determine grain yield of winter (June-November) grown wheat, rainfall-use efficiency (RUE) and surface runoff. The simulations were conducted on a continuous basis for 50 years (1960–2010) and enabled generalisation and extrapolation of experimental measurements. Simulated results were grouped as rainfall categories; namely: driest 30%, wettest 30%, and average 40% years to investigate the effect of inter-season rainfall variability on crop performance, RUE, and establish surface runoff-rainfall relationships. Climatic data were obtained from the Australian Bureau of Meteorology (http://www.bom.gov.au/) from weather station No.: 41529 (Toowoomba, Queensland) via patched point dataset (Jeffrey et al. Citation2001). A process modelling approach was chosen to quantify the likely impact of soil compaction on crop productivity as described in Antille et al. (Citation2016); except that the SoilWat module in APSIM was used to represent soil water processes instead of SWIM3 (Huth et al. Citation2012).
Soil properties, and their use in APSIM, were obtained as outlined here:
Saturated hydraulic conductivity (KSAT) was measured to a depth of 150 mm in both CTF and non-CTF soils (Equation (3)). Below that depth (150–1800mm), representative values of KSAT were taken from Connolly et al. (Citation2001) who provided parameter ranges for macropores and micropores for Red Ferrosols after various cropping histories. Values of KSAT for CTF soil (not affected by compaction) included a macropore component. Given that compaction causes a reduction in KSAT, the contribution from macropores after compaction is therefore reduced. Hence, KSAT values were estimated to reflect the micropore values given by Connolly et al. (Citation2001) and the relative change in ρb assumed for a given depth. This approach had been employed in the study of Antille et al. (Citation2016) to define changes in KSAT as a result of compaction in degraded Vertisols with similar clay contents (albeit with different clay mineralogy) to the Red Ferrosol used in the present study.
Soil bulk density (ρb) was measured for the 0–150 mm and 150–300 mm depth intervals in both CTF and non-CTF soils. Density data below that depth (300–1800mm) were retrieved from the APSoil database (https://www.apsim.info/apsim-model/apsoil/) for similar Red Ferrosols to represent the condition of the soil without compaction (CTF). For non-CTF soil, it was assumed that ρb would increase by approximately 0.1 g cm−3 for the 300–600 mm depth interval, as shown by Antille et al. (Citation2016) for soil affected by compaction. Traffic-induced soil stresses are highest within that depth band (Chamen Citation2015; McPhee et al. Citation2020). Below that depth (600–1800mm), the impact of compaction decreased progressively. Previous studies showed a near-linear decrease in soil displacement with an increase in soil depth for vehicles with wheel loads up to 12.5 Mg (e.g. Ansorge and Godwin Citation2007, Citation2008; Antille et al. Citation2013). Because soil tends to be denser at depth and is confined, soil displacement due to wheeling is proportionally smaller than at shallower depths (0–600 mm).
Pedotransfer functions were used to estimate soil water contents at the drained upper limit (DUL) and crop lower limit (CLL) for all depth intervals (from 0 to 1800mm). DUL is the highest water content of a soil after it had been thoroughly wetted and allowed to drain until drainage becomes practically negligible (Ratliff et al. Citation1983). CLL is the amount of water remaining after a given crop has extracted all the water available to it from the soil. Water held between DUL and CLL is the plant available water capacity (PAWC), and it is water that moves only slowly by diffusion. Water held below CLL is unavailable to plants. The pedotransfer functions used to estimate DUL and CLL rely on particle size analysis and ρb, and the formulae were compiled in a spreadsheet, which is available by request from the corresponding author. When DUL and CLL are measured under controlled laboratory conditions using a suction plate and a pressure chamber, they are taken to be equivalent to soil water retained at suctions of 100 cm and 15 bar, and are referred to as DUL100 and LL15, respectively (Marshall Citation1959).
Saturated water (SAT) content is the maximum amount of water a soil can store, and we considered it to be 97% of total porosity of soil
(Ngo-Cong et al. Citation2020). Water held between SAT and DUL drains under the influence of gravity and although this water is available to plants, often much of it may drain before it can be used (Ringrose-Voase et al. Citation2003). Total porosity was derived from density properties as shown earlier (McKenzie et al. Citation2002).
A runoff curve number (that is surface runoff as a function of total daily rainfall), which describes runoff potential for bare-soil (Huffman et al. Citation2011; Williams et al. Citation2012), was set at 73 units for CTF and this was increased by 7 units for the non-CTF soil (Li et al. Citation2009; Owens et al. Citation2016). Default soil evaporation parameters were set according to Kodur (Citation2017) and these parameters are available in the APSoil database. Soil properties and input parameters used in the model are presented in .
Table 2. The most economic rate of nitrogen (MERN) application for wheat as derived from the yield-to-nitrogen response curves for both CTF and non-CTF, respectively.
Wheat was sown every year on a defined sowing rainfall (at least 20 mm over a 5-day period) between 15 May and 15 July. If the defined rainfall did not occur, the model was forced to sow a crop on 31 July so that cropping could occur every year. Wheat was sown at 100 plants m−2 and received a N application rate of 112 kg ha−1 N, which corresponded with the average optimum N application rate (MERN) in the form of urea (). Nitrogen was applied 30 days after sowing (early tillering) to be consistent with standard agronomic practice in southern Queensland. The initial soil moisture content used in the first year of the simulations was 95% of PAWC (); this initial value was obtained by prior running the model for 10 years. The APSIM-Wheat module within APSIM has been broadly tested across different soil and climate conditions in Australia and internationally for a range of experimental conditions (e.g. Carberry et al. Citation2013; Holzworth et al. Citation2014). However, to further represent the conditions of the current field, the simulated yield data for CTF and non-CTF were calibrated and validated against the field data. The difference in yield between CTF and non-CTF under modelled conditions (13%) was similar to those observed under field conditions (12%). Rainfall-use efficiency (RUE) is defined in this study as the ratio of grain yield (kg ha−1) to total in-crop rainfall (Hochman et al. Citation2009).
Statistical analyses
The statistical package GenStat Release® 19th Edition (VSN International Ltd. Citation2013) was used to analyse the experimental data, and involved analysis of variance (ANOVA). The ANOVA model used in GenStat® is shown below (Equation (12)):
(12)
(12) where ‘Traffic system’ refers to CTF and non-CTF, ‘Control and Treatment’ are non-fertilised (no nitrogen applied) and fertilised (nitrogen applied) plots, respectively; ‘Fertiliser source’ refers to N source (UAN, ENTEC®, urea) and ‘Fertiliser rate’ is N application rate (0, 100, 200, 300 kg ha−1 N).
The least significant differences (LSD) were used to compare means using a 5% probability level. Statistical analyses were graphically assessed by means of residual plots and normalisation of data was not required. Yield-to-nitrogen responses were investigated by means of nonlinear (quadratic) regression analyses. Nonlinear regression analyses were used to describe the relationships between NUE and AE versus N application rate. From these relationships, the corresponding NUE and AE values at the most economic rate of N (MERN) were derived. Analytical values are reported as the mean ± standard deviation (SD). A two-way ANOVA testing the effect of traffic treatment and soil depth was conducted for soil penetration resistance and soil water content data (n = 10). The same two-way analysis was applied to water infiltration data (n = 3).
Results
Soil physical, mechanical and hydraulic properties
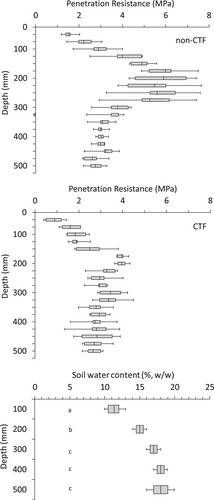
Overall, there were significant differences (P < 0.05) in soil cone Index between the two traffic systems, particularly in the 50–300 mm depth interval, where penetration resistance was up to 40% higher in non-CTF (). Mean values of cone Index in the 0–500 mm depth range were 2.56 and 4.32 MPa (LSD 5% level: 1.32) for CTF and non-CTF, respectively. No differences in penetration resistance were observed below 350 mm deep. Differences in cone Index between wheeled and non-wheeled soil were consistent with differences observed in ρb for the same depth interval (). Overall differences in (gravimetric) soil water content between the two traffic treatments were not significant (P > 0.05).
Figure 2. Soil penetration resistance and gravimetric soil water content observed at the experimental sites for the two traffic treatments representing controlled (CTF) and non-controlled traffic farming (non-CTF) systems, respectively. For soil penetration resistance: P < 0.05, LSD = 1.32 (traffic treatments), LSD = 0.812 (depth). Soil water content: P > 0.05 (traffic treatments), P < 0.05 (depth), LSD = 3.98; different letters indicate that mean values of soil water content (%, w/w) are significantly different. Each box-plot shows Min, Q1, Mean, Q3, and Max, respectively; n = 10 for both penetration resistance and soil water content.
Water infiltration rates for CTF and non-CTF showed the following relationships: and
, respectively. Infiltration rates were significantly lower in non-CTF compared with CTF at any given time ‘t’ (P-values < 0.05). On average, steady-state infiltration rates (t ≥5 h) observed in CTF were approximately three times higher than non-CTF. These results were consistent with measurements of KSAT (), which were about 20 times higher (P < 0.05) in CTF compared with non-CTF (1000 mm day−1 vs. 50 mm day−1, respectively, for the 0–150 mm depth interval) reflecting significant disruption of pore connectivity in compacted soil.
Grain yield and yield components
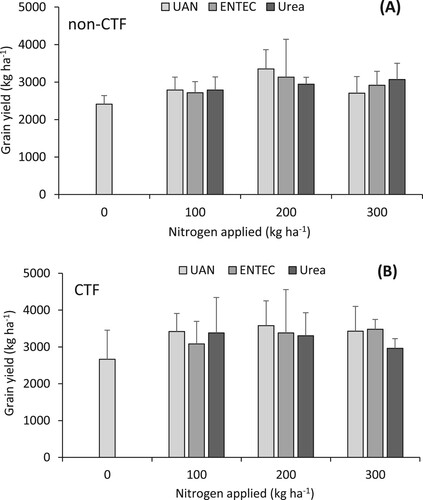
There were significant differences in grain yield between CTF and non-CTF (P < 0.016) (). Comparisons between zero-N treatments showed that grain yield was approximately 250 kg ha−1 higher in CTF compared with non-CTF (P < 0.05). For fertiliser-treated crop, grain yield was approximately 400 kg ha−1 (≈12%) higher in CTF compared with non-CTF. Overall, the N rate effect was significant, but there were no fertiliser type (N source) or fertiliser type × N rate effects on grain yield (P-values > 0.05). The optimum N application rates (MERN), and corresponding grain yields (YMERN), were 122 and 3336 kg ha−1, and 108 and 2887 kg ha−1 for CTF and non-CTF, respectively ().
Figure 3. Fertiliser effects on grain yield for two traffic treatments representing (A) non-controlled (non-CTF) and (B) controlled traffic farming (CTF) systems, respectively. Error bars denote the standard deviation of the mean (n = 3). Traffic treatments: P = 0.016, LSD = 312.7; Fertiliser type: P = 0.782, LSD = 403.7; Nitrogen rate: P = 0.026, LSD = 403.7; Fertiliser type × Nitrogen rate: P = 0.832, LSD = 988.9. Grain yield is reported at 14% moisture content.
Thousand-grain weight (TGW) and number of grains per m2 showed significant differences between traffic treatments (P-values < 0.05), and therefore were consistent with grain yield results (Supplementary data: Figure 1S). Difference in TGW between CTF’s control and non-CTF’s control was also significant (P < 0.05). There were significant differences in aboveground biomass between traffic treatments, and between fertiliser-treated crop and controls in both traffic treatments (P-values < 0.05), but there was no fertiliser type effect (P > 0.05) on aboveground biomass (Supplementary data: Figure 2S).
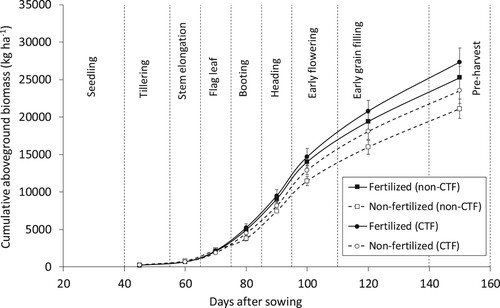
Overall, cumulative aboveground biomass was higher in CTF compared with non-CTF, which reflected enhanced response to applied fertiliser-N in the absence of soil compaction (). Traffic treatment effects on aboveground biomass were significant after tillering, consistent with differences in dry matter accumulation throughout the crop cycle and dry matter partitioning, but a N rate effect (P < 0.10) on cumulative aboveground biomass was only observed after the flag leaf was displayed.
Figure 4. Cumulative aboveground biomass recorded for two traffic treatments representing non-controlled (non-CTF) and controlled traffic farming (CTF) systems, respectively. Error bars denote the standard deviation of the mean (n = 3). Crop growth stages are based on Zadoks et al. (Citation1974). Nitrogen was applied 30 days after sowing (early tillering). Aboveground biomass is reported as dry matter.
Overall differences in harvest Index (HI) were generally small (≤4%) and there was no traffic treatment or fertiliser type effect (P-values > 0.05), which was consistent with changes in grain yield and total aboveground biomass (Figure 3S). Harvest Indices were slightly higher when N was applied at rates of 100 and 200 kg ha−1, which accords with estimates of MERN derived from the yield-to-nitrogen responses.
Nitrogen uptake and fertiliser nitrogen use efficiency
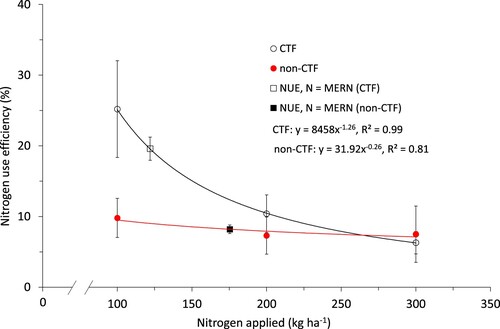
Apparent N recoveries in grain are shown in Figure 4S. Total grain-N was slightly higher in CTF compared with non-CTF (P < 0.05), with an overall difference between traffic treatments of approximately 6% (1.88% vs. 1.77% w/w, respectively). Nitrogen contents were approximately 5% lower in controls compared with fertilised-treated crop (average across N rates). The CTF treatment showed that NUE, expressed as apparent N recovery in grain, can be significantly increased compared with non-CTF (P < 0.01) for N application rates up to about 250 kg ha−1 (). Fertiliser type showed no significant effect on N recovered in grain (P > 0.05) and confirmed a significantly greater effect of compaction on NUE. These results suggested that improvements in NUE in non-CTF are constrained by compaction. Thus, improved soil structural conditions are a pre-requisite for improving NUE and this should be considered when using more expensive fertiliser formulations. The value of NUE that corresponds with the optimum N application rate (MERN) was derived from the NUE-to-N response relationships shown in . This value of NUE represents the traffic systems’ ‘average’ NUE when N inputs are optimised, and in these experiments it was found to be approximately 60% higher in CTF compared with non-CTF. Increased NUE will likely have significant economic implications for growers and potentially for the quality of the environment (readers are referred to the next section and where the optimum economic rates are presented and discussed).
Figure 5. Relationship between nitrogen (N) use efficiency (NUE) and N applied recorded for the two traffic treatments representing controlled (CTF) and non-controlled traffic farming (non-CTF) systems, respectively. The symbols (□) and (▪) represent NUE of the CTF and non-CTF treatments, respectively, for N = MERN. Error bars denote SD of the mean, P < 0.05 and n = 6; except for N = MERN (n = 3).
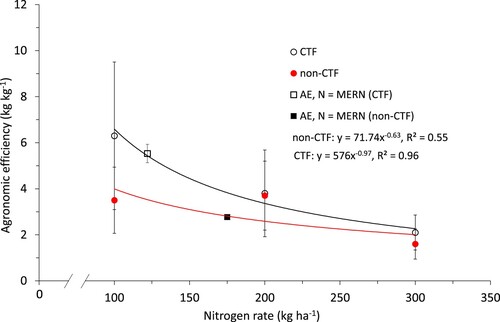
Overall, and across all N application rates, agronomic efficiency (AE) calculations reported a 35% increase in CTF compared with non-CTF (≈4 vs. 3 kg kg−1, respectively) (). When the values of MERN were used to estimate AE, this difference increased to almost 50% (P-values < 0.01). There was no fertiliser type effect on AE.
Figure 6. Relationship between agronomic efficiency (AE) and nitrogen (N) applied recorded for the two traffic treatments representing controlled (CTF) and non-controlled traffic farming (non-CTF) systems, respectively. The symbols (□) and (▪) represent AE of the CTF and non-CTF treatments, respectively, for N = MERN. Error bars denote SD of the mean, P < 0.05 and n = 6; except for N = MERN (n = 3).
Most economic rate of nitrogen and gross margin analysis
The most economic rate of N (MERN), the corresponding yield (YMERN), and price ratios (RP) for the year of harvest are presented in . In general, N responses were significant when a quadratic function was fitted to the data (P < 0.1), except for UAN and ENTEC® in non-CTF. Despite this, all responses showed acceptable fits (R2 > 0.75) for all fertiliser types in both traffic treatments. Quadratic models provide a satisfactory biological description of the yield-to-nitrogen response and therefore may be used despite of non-statistical significance of the quadratic term (Shaohua et al. Citation1999; Antille et al. Citation2017).
For both traffic treatments, the variable cost of ≈AUD145 ha−1 used for the gross margin (GM) analyses () included the costs of seed and seed treatment, field operations (fuel and oil, and repairs and maintenance), and agrochemicals used for crop protection. Average GM calculations across all fertiliser types were approximately 8% higher in CTF compared with non-CTF combined with shallow tillage, and about 4% higher for zero-tillage systems (P > 0.05). Differences in GM between fertiliser types were mainly due to differences in the cost of N, particularly for ENTEC® (AUD0.96 kg−1 N, which compares to AUD0.75 kg−1 N for urea or UAN) (). The impact of N fertiliser cost on GM was therefore higher in non-CTF because of the lower yield attained in this system.
Table 3. Gross income (GI), total variable cost (TVC), and gross margin (GM) estimated for wheat based on N application rates equivalent to MERN and the corresponding YMERN presented in .
APSIM modelling
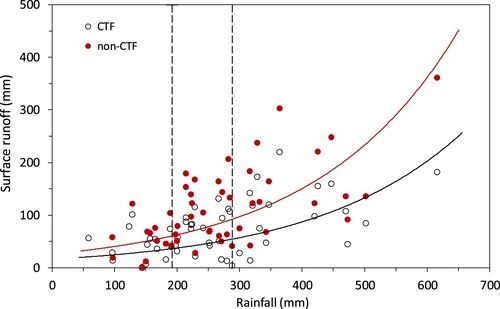
Modelled yield and RUE for CTF and non-CTF conditions as a function of long-term rainfall are shown in and , respectively. Modelled results showed that soil compaction in non-CTF can reduce grain yield and RUE by 13% and 15%, respectively, compared with CTF. While yield penalties were prominent across all rainfall conditions, yield reductions were greater in below-average rainfall years (<30th percentile, in-season rainfall ≈190 mm) compared with above-average rainfall years (>70th percentile, in-season rainfall ≈290 mm) (). These simulations predicted a decrease in RUE with increased annual rainfall, which was observed in both traffic systems. In below-average rainfall years, RUE was 25% and 20% higher than above-average rainfall years in CTF and non-CTF, respectively (). The effects of soil compaction on surface runoff are shown in . On average (50-year mean), APSIM simulations showed 38% increase in surface runoff and 7% reduction in plant available water content at sowing in non-CTF compared with CTF. Soil water content at sowing and surface runoff both tended to increase with an increase in rainfall, but in wetter years, the soil water content at sowing in non-CTF increases only a little because of the lower infiltration rate and higher runoff in that soil.
Figure 7. Long-term (1960–2010) simulation of grain yield for wheat-fallow cropping on a Red Ferrosol in Toowoomba (Queensland, Australia) for controlled (CTF) and non-controlled traffic farming (non-CTF) systems as a function of rainfall. Continuous lines show the best fit to predicted data. Dotted vertical lines show the 30th (left) and 70th (right) percentiles rainfall, respectively.
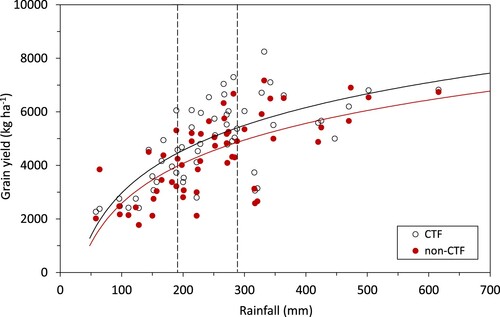
Figure 8. Long-term (1960–2010) simulation of rainfall-use efficiency (RUE) wheat-fallow cropping on a Red Ferrosol in Toowoomba (Queensland, Australia) for controlled (CTF) and non-controlled traffic farming (non-CTF) systems as a function of rainfall. Continuous lines show the best fit to predicted data. Dotted vertical lines show the 30th (left) and 70th (right) percentiles rainfall, respectively.
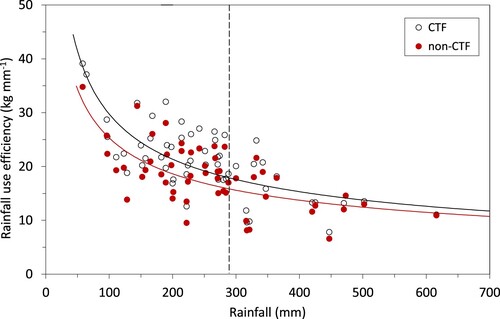
Figure 9. Long-term (1960–2010) simulation of surface runoff for wheat-fallow cropping on a Red Ferrosol in Toowoomba (Queensland, Australia) for controlled (CTF) and non-controlled traffic farming (non-CTF) systems as a function of rainfall. Continuous lines show the best fit to predicted data. Dotted vertical lines show the 30th (left) and 70th (right) percentiles rainfall, respectively.
Discussion
Effect of compaction on soil properties and water economy
Degradation of soil structure due to field traffic alters the physical, hydraulic and mechanical properties of soils (Raper Citation2005). Compacted soil, represented by non-CTF, showed higher bulk density (therefore lower total porosity) and cone Index than untrafficked soil, represented by CTF. Values of soil cone Index within this study were consistent with soil bulk density data. When compaction was applied to establish the non-CTF treatment, the soil exhibited a slightly lower moisture content than the value obtained with the Proctor test (21.2%, w/w) for maximum dry density (ρb = 1.70 g cm−3). Consequently, the susceptibility of the soil to compaction was below the maximum for that soil, particularly at shallow depths. The required soil bulk density in non-CTF was then achieved by performing multiple tractor passes (Botta et al. Citation2009, Botta, Bienvenido, et al. Citation2019).
The CTF soil stored significantly more water and exhibited improved infiltration rates and hydraulic conductivity compared with non-CTF soil as shown by other studies (e.g. Chyba et al. Citation2017). Risk of deep drainage in CTF soil is mitigated by increased water retention within the plant available water range (tensions between 10 and 1500 kPa) (Ngo-Cong et al. Citation2021) and improved soil structure (McHugh et al. Citation2009; Millington et al. Citation2017). In the absence of mechanical constraints, the ability of the crop to extend a deeper root system also reduces the risk of drainage losses (Kaczorowska-Dolowy et al. Citation2019). Steady-state (saturated) infiltration rates of 80 mm h−1 have been reported for bare virgin Vertisols in Queensland (Connolly et al. Citation1997), and this compares to 4 to 20 mm h−1 found for similar soil types under long-term cultivation (>20 years) (e.g. Silburn and Connolly Citation1995). Data derived from APSIM simulations in our study were consistent with findings from those earlier studies and help explain differences in yield and yield components, RUE and fertiliser NUE between CTF and non-CTF.
Our predictions of surface runoff for years with average rainfall () agreed with observations made in earlier studies, albeit on different soils, in which tractor wheeling was conducive to soil structural damage, reduced infiltration and therefore increased runoff (e.g. Horton et al. Citation1989; Tullberg et al. Citation2001; Li et al. Citation2007, Citation2009). When soil undergoes compaction, pore size and size distribution and the soil pore connectivity are significantly affected, thus reducing water infiltration rates and the saturated hydraulic conductivity (Pagliai et al. Citation2004). Reported reductions in pore space due to traffic are between 10% and 70% at 0.5 m depth, even with relatively light (e.g. 5 Mg wheel load) farm equipment (e.g. Chamen Citation2006). Such reductions in pore volume mean that there is less space for water and that water is held more tightly through capillary attraction. Soils therefore may return to field capacity sooner, but equally, they would also run out of plant available water relatively quicker (Hartge and Horn Citation2016). Under waterlogged or near-saturated conditions, the net result will be increased risk of N loss through denitrification (Melland et al. Citation2017; Tullberg et al. Citation2018).
Modelled RUE and surface runoff showed high sensitivity to small changes in soil compaction. Simulated surface runoff was about 45% higher in non-CTF compared with CTF and increased significantly when in-crop rainfall was higher than about 300 mm (>70th percentile). Simulations for the CTF system reported up to 15% higher RUE compared with non-CTF (≈21 vs. 17 kg mm−1 for CTF and non-CTF, respectively). Given the seasonal rainfall pattern of southern Queensland, with about 60% to 70% of the total annual rainfall occurring between October and March, changes in soil conditions conducive to increased soil water storage capacity will have a positive impact on yield potential of winter-grown crops (Fischer Citation1979). This is an important consideration for rainfed cropping systems where water is the main limiting factor affecting yield (Hochman et al. Citation2013). RUE may be used to predict crop yield potential given available soil water at sowing (French and Schultz Citation1984a), which may be then used to inform fertiliser decisions, particularly for nitrogen (James and Godwin Citation2003). French and Schultz (Citation1984b) established a ‘best yield’ benchmark for wheat of 20 kg ha−1 for every mm of water used by the crop. Our simulations showed that this benchmark could be achieved if the crop was managed under CTF, but not without CTF. Furthermore, improved soil water balance in CTF systems may increase the opportunities for double-cropping and inter-cropping. For example, Yule and Radford (Citation2003) and Antille, Chamen, et al. (Citation2015) reported that the cropping frequency in non-CTF systems with conventional tillage could be increased from 0.7 (or less) to about 1.2 crops a year when CTF is practiced in conjunction with no-tillage.
Effect of compaction on grain yield, yield components, and fertiliser nitrogen use efficiency
Wheat grain yield mainly depends on two yield components, namely: number and weight of grains. These two components are affected by the size of the canopy and the post-anthesis crop × environment interaction, respectively, which define the rate and duration of the grain-filling phase (Slafer Citation2003). When water stress is not a limiting factor, yield potential is positively correlated with number of grains per square meter that result from increased number of grains per ear (Slafer and Andrade Citation1993). Grain weight, although important, contributes relatively less to yield formation than number of grains (Gallagher et al. Citation1987). Yield potential is also positively correlated with aboveground biomass (Foulkes et al. Citation2007) so that higher grain yields are achieved by crops that can accumulate greater biomass at maturity (Austin Citation1982).
Total aboveground biomass at harvest, TGW and number of grains per square meter found within this work all showed significant differences between the two traffic treatments, which explained overall differences in grain yield between CTF and non-CTF. In non-CTF, compaction effects on yield and yield components reflect the sensitivity of the crop to changes in the soil biophysical environment, which impair N and water uptake and therefore affect their use efficiency. Barraclough and Weir (Citation1988) attributed reduced water and nutrient uptake to the effect of subsoil compaction on root growth. Nitrogen source (fertiliser formulation) did not appear to have any clear effect on yield or yield components when compaction was present; thus, compaction may be regarded as the primary factor affecting the yield-to-nitrogen response. Abbate et al. (Citation1995) showed that persistent N deficiency from early stages of the crop correlates well with reduced number of grains per ear, because of sub-optimal N levels in spikes at anthesis, which also depends on the intensity and duration of such deficiency (Jeuffroy and Bouchard Citation1999). In non-CTF soil, the rate of N uptake is likely to have been sub-optimal throughout the main part of the growing cycle, even after N was applied as fertiliser. At later stages of crop development, reduced N uptake may not affect numbers of ears, but number of grains per ear will be reduced because of flower abortion or total spikelet number (Whingwiri and Kemp Citation1980), which is aggravated by water stress (Doyle and Fischer Citation1979; Sadras Citation2020).
Mean harvest Indices of fertiliser-treated crop observed in these experiments (range: from 48% to 52%) were comparable to those reported by other studies (e.g. Donald and Hamblin Citation1976; White and Wilson Citation2006; Antille et al. Citation2017) for a range of wheat varieties. Co-limitation of water and N uptake in non-CTF reduced the size of the canopy (aboveground biomass) and yield because of the effect on the plant’s photosynthetic capacity (Lamptey et al. Citation2017; Yeboah et al. Citation2017). Thus, harvest Index changed little when compared with the crop grown under CTF.
Both NUE metrics, either expressed as apparent N recovery in grain or agronomic efficiency (AE), were significantly lower in non-CTF compared with CTF at any given N application rate ( and , respectively). Avoidance of traffic compaction and management of the crop and soil under a CTF system can potentially lead to improvements in both metrics of about 40% to 50% compared to a non-CTF system. As demonstrated by these experiments, this may be possible because of the significantly higher yield achieved with CTF, and despite the small increase in MERN (from 108 to 122 kg ha−1 N) relative to non-CTF. Increasing grain yield without compromising N content in grain requires a concurrent increase in crop-N accumulation (Sinclair Citation1998). This reflects challenges in simultaneously increasing N recovery in grain and grain yield (Barraclough et al. Citation2010), more so in CTF compared with non-CTF. However, this could be managed by applying foliar urea or UAN at milk development or solid N to soil when flag leaf is visible. This would lift grain N content, and potentially yield, provided soil water or rainfall were not limiting towards the end of the crop cycle (Gaju et al. Citation2014).
APSIM modelling
Long-term (1960–2010) simulations of wheat production showed that yield penalties in non-CTF were dependent on in-crop rainfall. The model predicted yield reductions of 9% or less in high rainfall seasons (280–600 mm), between 12% and 15% in low rainfall seasons (60–280 mm), and about 12% in average rainfall seasons (256 mm), respectively. These simulated results were within the range reported by previous compaction studies (e.g. Radford et al. Citation2007), and other work that compared CTF with non-CTF (e.g. Galambošová et al. Citation2017; Shaheb et al. Citation2018), and confirmed that the impact of compaction on crop performance depends on the seasonal effect of weather (McKyes et al. Citation1979). Increased strength in compacted soil reduces the ability of the crop to extend a root system to access water and nutrients (Bengough and Mullins Citation1990). A study by Antille et al. (Citation2016) showed a reduction in median rooting depth (≈350 mm) of wheat grown in compacted soil (ρb ≥ 1.45 g cm−3) that was fairly consistent across seasons (115 years), but in years with rainfall above-average, increased water availability did not constrain crop yield significantly. In average- and below-average rainfall years, reduced soil water availability both at sowing and throughout the season, coupled with reduced rooting depth in compacted soil (Antille et al. Citation2016), significantly constrained crop yield. Functional relationships between soil compaction and surface runoff, with the associated impact on crop yield, were also shown in earlier studies by Li et al. (Citation2007, Citation2009). While our modelling work captured well seasonal differences in crop performance and soil water dynamics due to compaction, it relied on the selected runoff curve number (Li et al. Citation2009; Owens et al. Citation2016). Field investigations are needed to further adjust the selection of the appropriate runoff curve number, or otherwise verify it for Red Ferrosols, and in accord with the extent of soil compaction (including surface sealing properties).
Economic considerations and drivers for adoption of CTF
Average gross margin (GM) calculations across all fertiliser types showed an additional AUD50 ha−1 may be realised in CTF + zero-tillage (ZT) compared with non-CTF + shallow tillage, and about AUD30 ha−1 when non-CTF + ZT is practiced (). Differences in GM between the two traffic systems will widen or narrow depending on the seasonal effect of weather, as predicted by the long-term yield-to-rainfall relationship (). However, a limitation of these analyses, not captured by the model, is the progressive recovery of soil structure when (‘random’) traffic compaction is effectively eliminated from the system, as shown in other studies (e.g. McHugh et al. Citation2009; Millington et al. Citation2017). In regions where rainfall is not reliable, such as the site chosen for this work, improved soil water conservation reduces the risk of crop failure. This is facilitated by better structural conditions in CTF soil. Increased frequency of successful crops (e.g. double- and inter-cropping) and lower inter-annual crop yield variability (Yule and Radford Citation2003) have financial implications for the whole-of-farm system (Chamen et al. Citation2015). Other benefits of CTF over non-CTF not captured by our simulations are improved in-field efficiency, trafficability (e.g. Bochtis et al. Citation2010) and timeliness of field operations (planting, fertiliser spreading, crop protection, harvesting), and reduced energy-use (Antille, Peets, et al. Citation2019; Antille, Chamen, et al. Citation2019). For example, in Queensland (Australia), substantial fuel savings have been reported in grain cropping systems managed under CTF (Tullberg Citation2000). In Western Australia, adoption of CTF may increase farm profitability of grain enterprises by at least AUD40 ha−1 per year, if a conservative 5% increase in yield could be realised after conversion to CTF (Kingwell and Fuchsbichler Citation2011).
The cost of full conversion to CTF, and the associated repayment period, may be determined as a function of the yield differential (ΔY) between CTF and non-CTF. Based on analyses conducted by Blackwell et al. (Citation2013), and long-term ΔY found in our work (9–15%), the repayment period for full conversion to CTF would be between 2 and 7 years if the cost of conversion to fully match all equipment was between AUD100,000 and AUD600,000, respectively. If additional economic benefits could be realised, for example as a result of increased grain quality, the repayment period could be reduced by up to 50% (Blackwell et al. Citation2013). This should be possible as compacted permanent traffic lanes enable more timely field operations (e.g. spraying, harvest) facilitating better crop husbandry. Acknowledgement of the multiplicative effects that result from integrating CTF and zero-tillage are likely to drive further adoption of CTF in Australia, particularly if the perceived economic and environmental benefits continue to be demonstrated at commercial-scale farming and through on-farm research (Antille, Chamen, et al. Citation2015; Bluett et al. Citation2019).
In summary, increased productivity, RUE and NUE in CTF were mainly explained by avoidance of traffic compaction, but not by the choice of N formulation. The overall fertiliser type effect on yield was small relative to the effect of traffic. This was confirmed by differences in all agronomic indicators of crop performance (grain yield, yield components, yield-to-nitrogen response) observed in the two traffic treatments. Fertiliser NUE and RUE may not be significantly increased if the mechanisation system does not protect soil from compaction, regardless of the N formulation used. Enhanced efficiency fertilisers, such as DMPP-treated urea, may provide little or no benefit to improving NUE if soil compaction is not appropriately managed. Controlled traffic farming appears to be a more effective practice to help mitigate environmental losses of N compared with other mechanisation systems where field traffic in not organised. The impact of soil compaction on grain yield is dependent on in-crop rainfall; this being higher in years with rainfall below-average and vice-versa. Reduced infiltration and water retention in soil, increases the risk of surface runoff, which has implications for soil water availability and therefore crop yield while reducing the opportunities for crop establishment.
Long-term simulations suggested that productivity of wheat in subtropical Queensland could be improved by 9% to 15% if the crop was managed under CTF, depending on rainfall. Based on the assumptions made in the analyses, the estimated median increase in long-term yields (540 kg ha−1) represents an additional gross income of about AUD155 per ha compared with non-CTF.
Supplementary_Data.docx
Download ()Acknowledgements
Technical assistance provided by colleagues and members of staff from the Centre for Agriculture Engineering at USQ and CSIRO Agriculture and Food at Toowoomba is gratefully acknowledged. Comments and suggestions provided by anonymous reviewers from CSIRO Agriculture and Food at Canberra during the preparation of this article are also appreciated.
Disclosure statement
No potential conflict of interest was reported by the authors.
Additional information
Funding
Notes on contributors
Mahmood A. Hussein
Dr Mahmood A. Hussein Lecturer, College of Agriculture and Forestry, University of Mosul, Iraq, and former PhD Scholar, Centre for Agricultural Engineering, University of Southern Queensland (Australia).
Diogenes L. Antille
Dr Diogenes L. Antille Senior Research Scientist (Soil Physics), CSIRO Agriculture and Food, and Adjunct Senior Research Fellow (Conservation Agriculture) Centre for Agricultural Engineering, University of Southern Queensland (Australia).
Shreevatsa Kodur
Dr Shreevatsa Kodur Former Research Fellow (Biophysical Modelling), Centre for Agricultural Engineering, University of Southern Queensland (Australia).
Guangnan Chen
Dr Guangnan Chen Associate Professor, Centre for Agricultural Engineering, University of Southern Queensland (Australia).
Jeff N. Tullberg
Dr Jeff N. Tullberg Adjunct Associate Professor, Centre for Agricultural Engineering, University of Southern Queensland (Australia).
References
- Abbate PE, Andrade FH, Culot JP. 1995. The effects of radiation and nitrogen on number of grains in wheat. J Agric Sci. 124(3):351–360. doi:10.1017/S0021859600073317.
- Aikins KA, Antille DL, Jensen TA, Blackwell J. 2019. Performance comparison of residue management units of no-tillage sowing systems: a review. Eng Agric Environ Food. 12(2):181–190. doi:10.1016/j.eaef.2018.12.006.
- Aikins KA, Barr JB, Ucgul M, Jensen TA, Antille DL, Desbiolles JMA. 2020. No-tillage furrow opener performance: a review of tool geometry, settings and interactions with soil and crop residue. Soil Res. 58(7):603–621. doi:10.1071/SR19153.
- Alakukku L, Weisskopf P, Chamen WCT, Tijink FGJ, van der Linden JP, Pires S, Sommer C, Spoor G. 2003. Prevention strategies for field traffic-induced subsoil compaction: a review. Part 1: machine/soil interactions. Soil Tillage Res. 73(1-2):145–160. doi:10.1016/S0167-1987(03)00107-7.
- Angus JF, Fischer RA. 1991. Grain protein responses to nitrogen applied to wheat growing on a red earth. Aust J Agric Res. 42(5):735–746. doi:10.1071/ar9910735.
- Angus JF, Grace PR. 2017. Nitrogen balance in Australia and nitrogen use efficiency on Australian farms. Soil Res. 55(6):435–450. doi:10.1071/SR16325.
- Ansorge D, Godwin RJ. 2007. The effect of tyres and a rubber track at high axle loads on soil compaction, part 1: single axle-studies. Biosystems Eng. 98(1):115–126. doi:10.1016/j.biosystemseng.2007.06.005.
- Ansorge D, Godwin RJ. 2008. The effect of tyres and a rubber track at high axle loads on soil compaction – part 2: multi-axle machine studies. Biosystems Eng. 99(3):338–347. doi:10.1016/j.biosystemseng.2007.11.014.
- Antille DL, Ansorge D, Dresser ML, Godwin RJ. 2013. Soil displacement and soil bulk density changes as affected by tire size. Trans ASABE. 56(5):1683–1693. doi:10.13031/trans.56.9886.
- Antille DL, Chamen T, Tullberg JN, Isbister B, Jensen TA, Chen G, Baillie CP, Schueller JK. 2019. Chapter 10: Controlled traffic farming in precision agriculture. In: Stafford JV, editor. Precision agriculture for sustainability, part 2: delivery systems. Burleigh Dodds Series in Agricultural Science No.: 52. Cambridge (UK): Burleigh Dodds Science Pub. Ltd; p. 239–270. doi:10.19103/AS.2017.0032.11.
- Antille DL, Chamen WCT, Tullberg JN, Lal R. 2015. The potential of controlled traffic farming to mitigate greenhouse gas emissions and enhance carbon sequestration in arable land: a critical review. Trans ASABE. 58(3):707–731. doi:10.13031/trans.58.11049.
- Antille DL, Godwin RJ, Sakrabani R, Seneweera S, Tyrrel SF, Johnston AE. 2017. Field-scale evaluation of biosolids-derived organomineral fertilizers applied to winter wheat in England. Agron J. 109(2):654–674. doi:10.2134/agronj2016.09.0495.
- Antille DL, Hoekstra NJ, Lalor STJ. 2015. Field-scale evaluation of calcium ammonium nitrate, urea, and urea treated with N-(n-butyl) thiophosphoric triamide applied to grassland in Ireland. Commun Soil Sci Plant Anal. 46(11):1345–1361. doi:10.1080/00103624.2015.1033540.
- Antille DL, Huth NI, Eberhard J, Marinoni O, Cocks B, Poulton PL, Macdonald BCT, Schmidt EJ. 2016. The effects of coal seam gas infrastructure development on arable land in southern Queensland, Australia: field investigations and modeling. Trans ASABE. 59(4):879–901. doi:10.13031/trans.59.11547.
- Antille DL, Moody PW. 2021. Nitrogen use efficiency indicators for the Australian grains, cotton, sugar, dairy, and horticulture industries. Environ Sustain Indic. 10: Article number: 100099. doi:10.1016/j.indic.2020.100099.
- Antille DL, Peets S, Galambošová J, Botta GF, Rataj V, Macák M, Tullberg JN, Chamen WCT, White DR, Misiewicz PA, et al. 2019. Review: soil compaction and controlled traffic farming in arable and grass cropping systems. Agronomy Res. 17(3):653–682. doi:10.15159/AR.19.133.
- Archer J, Smith P. 1972. The relation between bulk density, available water capacity, and air capacity of soils. J Soil Sci. 23(4):475–480. doi:10.1111/j.1365-2389.1972.tb01678.x.
- ASABE. 2019. ASAE Standard EP542.1 NOV2019: procedures for using and reporting data obtained with the soil cone penetrometer. St. Joseph (MI): American Society of Agricultural and Biological Engineers.
- Austin RB. 1982. Crop characteristics and the potential yield of wheat. J Agric Sci. 98(2):447–453. doi:10.1017/S002185960004199X.
- Australian Standard. 2003. Standard AS-1289.5.2.1-2003: methods of testing soils for engineering purposes Method 5.2.1: Soil compaction and density tests – Determination of the dry density/moisture content relation of a soil using modified compactive effort. Sydney (NSW): ©Standards Australia.
- Baligar VC, Fageria NK, He ZL. 2001. Nutrient use efficiency in plants. Commun Soil Sci Plant Anal. 32(7-8):921–950. doi:10.1081/CSS-100104098.
- Barraclough P, Weir A. 1988. Effects of a compacted subsoil layer on root and shoot growth, water use and nutrient uptake of winter wheat. J Agric Sci. 110(2):207–216. doi:10.1017/S0021859600081235.
- Barraclough PB, Howarth JR, Jones J, Lopez-Bellido R, Parmar S, Shepherd CE, Hawkesford MJ. 2010. Nitrogen efficiency of wheat: genotypic and environmental variation and prospects for improvement. Eur J Agron. 33(1):1–11. doi:10.1016/j.eja.2010.01.005.
- Bengough AG, Mullins CE. 1990. Mechanical impedance to root growth: a review of experimental techniques and root growth responses. J Soil Sci. 41(3):341–358. doi:10.1111/j.1365-2389.1990.tb00070.x.
- Berisso FE, Schjønning P, Keller T, Lamandé M, Etana A, De Jonge LW, Iversen BV, Arvidsson J, Forkman J. 2012. Persistent effects of subsoil compaction on pore size distribution and transport in a loamy soil. Soil Tillage Res. 122:42–51. doi:10.1016/j.still.2012.02.005.
- Blackwell P, Hagan J, Davies S, Riethmuller G, Bakker D, Hall D, Knight Q, Lemon J, Yokwe S, Isbister B. 2013. ‘Pathways to more grain farming profit by controlled traffic farming in WA’. 2013 Western Australia crop updates. Barton, ACT, Australia: GRDC (Australian Government).
- Blake GR, Hartge KH. 1986. Bulk density. In: Methods of soil analysis. Part 1: physical and mineralogical methods. Klute, A (editor). Agronomy, 9: 363–382. 2nd ed. Madison (WI): American Society of Agronomy.
- Bluett C, Tullberg JN, McPhee JE, Antille DL. 2019. Soil and Tillage Research: why still focus on soil compaction? Soil Tillage Res. 194: Article number 104282. doi:10.1016/j.still.2019.05.028.
- Bochtis DD, Sørensen CG, Green O, Moshou D, Olesen J. 2010. Effect of controlled traffic on field efficiency. Biosystems Eng. 106(1):14–25. doi:10.1016/j.biosystemseng.2009.10.009.
- Botta GF, Antille DL, Bienvenido F, Rivero D, Contessotto EE. 2019. Energy requirements for alleviation of subsoil compaction and the effect of deep tillage on sunflower (Helianthus annus L.) yield in the western region of Argentina’s Rolling Pampa. Eng Rural Dev. 18:174–178. doi:10.22616/ERDev2019.18.N216.
- Botta GF, Becerra AT, Tourn FB. 2009. Effect of the number of tractor passes on soil rut depth and compaction in two tillage regimes. Soil Tillage Res. 103(2):381–386. doi:10.1016/j.still.2008.12.002.
- Botta GF, Bienvenido JF, Antille DL, Rivero ERD, Contessotto EE, Ghelfi DG, Nistal AI. 2019. Effect of traffic with a light-weight tractor on physical properties of an Aridisol soil in Almeria, Spain. Rev Fac Cienc. Agrar. 51(2):270–279.
- Botta GF, Pozzolo O, Bomben M, Rosatto H, Rivero D, Ressia M, Tourn M, Soza E, Vazquez J. 2007. Traffic alternatives for harvesting soybean (Glycine max L.): effect on yields and soil under a direct sowing system. Soil Tillage Res. 96(1-2):145–154. doi:10.1016/j.still.2007.05.003.
- Braunack MV, McPhee JE, Reid DJ. 1995. Controlled traffic to increase productivity of irrigated row crops in the semi-arid tropics. Aust J Exp Agric. 35(4):503–513. doi:10.1071/EA9950503.
- Carberry PS, Liang W, Twomlow S, Holzworth DP, Dimes JP, McClelland T, Huth NI, Chen F, Hochman Z, Keating BA. 2013. Scope for improved eco-efficiency varies among diverse cropping systems. Proc Natl Acad Sci U S A. 110(21):8381–8386. doi:10.1073/pnas.1208050110.
- Chamen T. 2006. Controlled traffic farming: literature review and appraisal of potential use in the U.K. Home-Grown Cereals Authority Research Review No. 59. Kenilworth (UK): Agriculture and Horticulture Development Board.
- Chamen T. 2015. Controlled traffic farming – from worldwide research to adoption in Europe and its future prospects. Acta Technol Agric. 18(3):64–73. doi:10.1515/ata-2015-0014.
- Chamen T, Alakukku L, Pires S, Sommer C, Spoor G, Tijink F, Weisskopf P. 2003. Prevention strategies for field traffic-induced subsoil compaction: a review. Part 2. Equipment and field practices. Soil Tillage Res. 73(1-2):161–174. doi:10.1016/S0167-1987(03)00108-9.
- Chamen WCT, Moxey AP, Towers W, Balana B, Hallett PD. 2015. Mitigating arable soil compaction: a review and analysis of available cost and benefit data. Soil Tillage Res. 146(Part A):10–25. doi:10.1016/j.still.2014.09.011.
- Chyba J, Kroulík M, Krištof K, Misiewicz PA. 2017. The influence of agricultural traffic on soil infiltration rates. Agron Res. 15(3):664–673.
- Connolly RD, Freebairn DM, Bell MJ, Thomas G. 2001. Effects of rundown in soil hydraulic condition on crop productivity in southeastern Queensland: a simulation study. Aust J Soil Res. 39(5):1111–1129. doi:10.1071/SR00089.
- Connolly RD, Freebairn DM, Bridge BJ. 1997. Change in infiltration characteristics associated with cultivation history of soils in southeastern Queensland. Aust J Soil Res. 35(6):1341–1358. doi:10.1071/S97032.
- Dalgliesh N, Hochman Z, Huth N, Holzworth D. 2016. Field protocol to APSoil characterisations, pp. 25. Version 4 (September 2016). Canberra, ACT, Australia: CSIRO Agriculture and Food. Available at: https://publications.csiro.au/rpr/download?pid=csiro:EP166550&dsid=DS4.
- Dang YP, Balzer A, Crawford M, Rincon-Florez V, Hongwei L, Melland AR, Antille D, Kodur S, Bell MJ, Whish JPM, et al. 2018. Strategic tillage in conservation agricultural systems of north-eastern Australia: why, where, when and how? Environ Sci Pollut Res. 25(2):1000–1015. doi:10.1007/s11356-017-8937-1.
- Dexter AR. 1991. Amelioration of soil by natural processes. Soil Tillage Res. 20(1):87–100. doi:10.1016/0167-1987(91)90127-J.
- Donald CM, Hamblin J. 1976. The biological yield and harvest index of cereals as agronomic and plant breeding criteria. Adv Agron. 28:361–405. doi:10.1016/S0065-2113(08)60559-3.
- Doyle AD, Fischer RA. 1979. Dry matter accumulation and water use relationships in wheat crops. Aust J Agric Res. 30(5):815–829. doi:10.1071/AR9790815.
- Fischer RA. 1979. Growth and water limitations to dryland wheat yield in Australia; a physiological framework. J Aust Inst Agric Sci. 45:83–95.
- Foulkes MJ, Snape JW, Shearman VJ, Reynolds MP, Gaju O, Sylvester-Bradley R. 2007. Genetic progress in yield potential in wheat: recent advances and future prospects. J Agric Sci. 145(1):17–29. doi:10.1017/S0021859607006740.
- French RJ, Schultz JE. 1984a. Water use efficiency of wheat in a Mediterranean-type environment. I. The relationship between yield, water use and climate. Aust J Agric Res. 35:743–764. doi:10.1071/AR9840743.
- French RJ, Schultz JE. 1984b. Water use efficiency of wheat in a Mediterranean-type environment. 11. Some limitations to efficiency. Aust J Agric Res. 35:765–775. doi:10.1071/AR9840765.
- Gaju O, Allard V, Martre P, Le Gouis J, Moreau D, Bogard M, Hubbart S, Foulkes MJ. 2014. Nitrogen partitioning and remobilization in relation to leaf senescence, grain yield and grain nitrogen concentration in wheat cultivars. Field Crops Res. 155:213–223. doi:10.1016/j.fcr.2013.09.003.
- Galambošová J, Macák M, Rataj V, Antille DL, Godwin RJ, Chamen WCT, Žitňák M, Vitázková B, Ďuďák J, Chlpík J. 2017. Field evaluation of controlled traffic farming in Central Europe using commercially available machinery. Trans ASABE. 60(3):657–669. doi:10.13031/trans.11833.
- Gallagher EJ, Doyle A, Dilworth D. 1987. Effect of management practices on cereal yield and quality. Asp Appl Biol. 15:151–160.
- Gee GW, Bauder JW. 1986. Particle-size analysis. In: Klute A, editor. Methods of soil analysis. 2nd ed. Part 1: physical and mineralogical methods. Madison (WI): Soil Science Society of America; p. 383–411.
- Godwin R, Misiewicz P, White D, Smith E, Chamen T, Galambošová J, Stobart R. 2015. Results from recent traffic systems research and the implications for future work. Acta Technol Agric. 18(3):57–63. doi:10.1515/ata-2015-0013.
- Gregorich EG, McLaughlin NB, Lapen DR, Ma BL, Rochette P. 2014. Soil compaction, both an environmental and agronomic culprit: increased nitrous oxide emissions and reduced plant nitrogen uptake. Soil Sci Soc Am J. 78(6):1913–1923. doi:10.2136/sssaj2014.03.0117.
- Hadas A, Wolf D, Rawitz E. 1985. Residual compaction effects on cotton stand and yields. Trans ASAE. 28(3):691–696. doi:10.13031/2013.32321.
- Halvorson AD, Bartolo ME. 2014. Nitrogen source and rate effects on irrigated corn yields and nitrogen-use efficiency. Agron J. 106(2):681–693. doi:10.2134/agronj2013.0001.
- Hartge K-H, Horn R. 2016. Essential soil physics: an introduction to soil processes, functions, structure and mechanics. In: Horton, R, Horn, R, Bachmann, J, Peth, S, editors. Clayton (VIC): CSIRO Publishing. pp. 391.
- Hedayati M, Brock PM, Nachimuthu G, Schwenke G. 2019. Farm-level strategies to reduce the life cycle greenhouse gas emissions of cotton production: an Australian perspective. J Cleaner Prod. 212:974–985. doi:10.1016/j.jclepro.2018.11.190.
- Hillel D. 2004. Introduction to environmental soil physics. London (UK): Elsevier Academic Press.
- Hochman Z, Gobbett D, Holzworth D, McClelland T, van Rees H, Marinoni O, Garcia JN, Horan H. 2013. Reprint of ‘Quantifying yield gaps in rainfed cropping systems: a case study of wheat in Australia’. Field Crops Res. 143:65–75. doi:10.1016/j.fcr.2013.02.001.
- Hochman Z, Holzworth D, Hunt JR. 2009. Potential to improve on-farm wheat yield and WUE in Australia. Crop Pasture Sci. 60(8):708–716. doi:10.1071/CP09064.
- Holzworth DP, Huth NI, Zurcher EJ, Herrmann NI, McLean G, Chenu K, van Oosterom EJ, Snow V, Murphy C, Moore AD. 2014. APSIM: evolution towards a new generation of agricultural systems simulation. Environ Model Softw. 62:327–350. doi:10.1016/j.envsoft.2014.07.009.
- Horton R, Allmaras RR, Cruse RM. 1989. Tillage and compactive effects on soil hydraulic properties and water flow. In: Larson W E, Blake GR, Allmaras RR, Voorhees WB, Gupta SC, editors. Mechanics and related processes in structured agricultural soils. NATO ASI Series (Series E: Applied sciences). 172: 187–203. doi:10.1007/978-94-009-2421-5_15.
- Horton R, Ankeny MD, Allmaras RR. 1994. Effects of compaction on soil hydraulic properties. Dev Agric Eng. 11(C):141–165. doi:10.1016/b978-0-444-88286-8.50015-5.
- Huffman RL, Fangmeier DD, Elliot WJ, Workman SR, Schwab GO. 2011. Soil and water conservation engineering. 6th ed. St. Joseph (MI): ASABE. ISBN: 1-892769-79-4.
- Hurlbut CS, Klein C. 1977. Manual of mineralogy. 19th ed. New York (NY): Wiley.
- Hussein MA, Antille DL, Chen G, Kodur S, Tullberg JN. 2018. Agronomic performance of sorghum (Sorghum bicolor (L.) Moench) and fertilizer use efficiency as affected by controlled and non-controlled traffic of farm machinery. ASABE Paper No.: 1800250. St. Joseph (MI): 2018 ASABE Annual International Meeting, American Society of Agricultural and Biological Engineers. doi:10.13031/aim.201800250.
- Huth NI, Bristow KL, Verburg K. 2012. SWIM3: model use, calibration, and validation. Trans ASABE. 55(4):1303–1313. doi:10.13031/2013.42243.
- Isbell RF. 2002. The Australian soil classification. Melbourne, VIC, Australia: CSIRO Publishing.
- James IT, Godwin RJ. 2003. Soil, water and yield relationships in developing strategies for the precision application of nitrogen fertiliser to winter barley. Biosystems Eng. 84(4):467–480. doi:10.1016/S1537-5110(02)00284-2.
- Jeffrey SJ, Carter JO, Moodie KB, Beswick AR. 2001. Using spatial interpolation to construct a comprehensive archive of Australian climate data. Environ Model Softw. 16(4):309–330. doi:10.1016/S1364-8152(01)00008-1.
- Jeuffroy M-H, Bouchard C. 1999. Intensity and duration of nitrogen deficiency on wheat grain number. Crop Sci. 39(5):1385–1393. doi:10.2135/cropsci1999.3951385x.
- Jørgensen MH. 2012. Agricultural field machinery for the future – from an engineering perspective. Agron Res. 10(1):109–113.
- Kachanoski RG. 2009. Crop response to nitrogen fertilizer: the delta yield concept. Can J Soil Sci. 89(5):543–554. doi:10.4141/CJSS09003.
- Kaczorowska-Dolowy M, Godwin RJ, Dickin E, White DR, Misiewicz PA. 2019. Controlled traffic farming delivers better crop yield of winter bean as a result of improved root development. Agron Res. 17(3):725–740. doi:10.15159/AR.19.136.
- Keating BA, Carberry PS, Hammer GL, Probert ME, Robertson MJ, Holzworth D, Huth NI, Hargreaves JNG, Meinke H, Hochman Z, et al. 2003. An overview of APSIM, a model designed for farming systems simulation. Eur J Agron. 18(3-4):267–288. doi:10.1016/S1161-0301(02)00108-9.
- Kingwell R, Fuchsbichler A. 2011. The whole-farm benefits of controlled traffic farming: an Australian appraisal. Agric Sys. 104(7):513–521. doi:10.1016/j.agsy.2011.04.001.
- Kirkegaard JA, Hunt JR, McBeath TM, Lilley JM, Moore A, Verburg K, Robertson M, Oliver Y, Ward PR, Milroy S, et al. 2014. Improving water productivity in the Australian grains industry – a nationally coordinated approach. Crop Pasture Sci. 65(7):583–601. doi:10.1071/CP14019.
- Klute A. 1965. Laboratory measurement of hydraulic conductivity of saturated soil. In: Black CA, editor. Methods of soil analysis. Part 1. Physical and mineralogical properties, including statistics of measurement and sampling. Madison (WI): American Society of Agronomy; p. 210–221.
- Kodur S. 2017. Improving the prediction of soil evaporation for different soil types under dryland cropping. Agric Water Manag. 193:131–141. doi:10.1016/j.agwat.2017.07.016.
- Lamptey S, Li L, Xie J, Zhang R, Yeboah S, Antille DL. 2017. Photosynthetic response of maize to nitrogen fertilization in the semiarid Western Loess Plateau of China. Crop Sci. 57(5):2739–2752. doi:10.2135/cropsci2016.12.1021.
- Li YX, Tullberg JN, Freebairn DM. 2007. Wheel traffic and tillage effects on runoff and crop yield. Soil Tillage Res. 97(2):282–292. doi:10.1016/j.still.2005.10.001.
- Li YX, Tullberg JN, Freebairn DM, Li HW. 2009. Functional relationships between soil water infiltration and wheeling and rainfall energy. Soil Tillage Res. 104(1):156–163. doi:10.1016/j.still.2008.10.023.
- Lipiec J, Stępniewski W. 1995. Effects of soil compaction and tillage systems on uptake and losses of nutrients. Soil Tillage Res. 35(1-2):37–52. doi:10.1016/0167-1987(95)00474-7.
- MAFF. 1986. The analysis of agricultural materials. 3rd ed. Ministry of Agriculture, Fisheries, and Food. London (UK): The Stationery Office.
- Marshall TJ. 1959. Relations between water and soil. Technical Communication No.: 50, Commonwealth Bureau of soils. Harpenden (UK): Commonwealth Agricultural Bureaux. pp. 91.
- McGarry D. 1990. Soil compaction and cotton growth on a Vertisol. Aust J Soil Res. 28(6):869–877. doi:10.1071/SR9900869.
- McHugh AD, Tullberg JN, Freebairn DM. 2009. Controlled traffic farming restores soil structure. Soil Tillage Res. 104(1):164–172. doi:10.1016/j.still.2008.10.010.
- McKenzie N, Coughlan K, Cresswell HP. 2002. Soil physical measurement and interpretation for land evaluation. Collingwood, VIC, Australia: CSIRO Publishing.
- McKyes E, Negi S, Douglas E, Taylor F, Raghavan V. 1979. The effect of machinery traffic and tillage operations on the physical properties of a clay and on yield of silage corn. J Agric Eng Res. 24(2):143–148. doi:10.1016/0021-8634(79)90048-9.
- McPhee JE, Antille DL, Tullberg JN, Doyle RB, Boersma M. 2020. Managing soil compaction – a choice of low-mass autonomous vehicles or controlled traffic? Biosystems Eng. 195:227–241. doi:10.1016/j.biosystemseng.2020.05.006.
- Melland AR, Antille DL, Dang YP. 2017. Effects of strategic tillage on short-term erosion, nutrient loss in runoff and greenhouse gas emissions. Soil Res. 55(3):201–214. doi:10.1071/SR16136.
- Millington WAJ, Misiewicz PA, White DR, Dickin ET, Mooney SJ, Godwin RJ. 2017. An investigation into the effect of traffic and tillage on soil properties using X-ray computed tomography. ASABE Paper No.: 1700380, St Joseph (MI): 2017 ASABE Annual International Meeting, American Society of Agricultural and Biological Engineers. doi:10.13031/aim.201700380.
- Mitchell R, Wilhelm N, Fisher P, Tullberg J, Bluett C, Pearl D, Dimos N, Benjamin C. 2019. On the right track: controlled traffic farming in the Australian southern low rainfall zone. Canberra, ACT, Australia: Grains Research and Development Corporation. ISBN 978-1-921779-85-5 (online).
- Ngo-Cong D, Antille DL, Tekeste MZ, Baillie CP. 2021. Impact of compaction on the water retention characteristics of cotton soils in southeastern US states. ASABE Paper No.: 2100008. St. Joseph (MI): 2021 ASABE Annual International Meeting, American Society of Agricultural and Biological Engineers. doi:10.13031/aim.202100008.
- Ngo-Cong D, Mai-Duy N, Antille DL, van Genuchten MT. 2020. A control volume scheme using compact integrated radial basis function stencils for solving the Richards equation. J Hydrol. 580: Article number: 124240. doi:10.1016/j.jhydrol.2019.124240.
- Owens J, Shaw M, Silburn M. 2016. Modelling reductions of pollutant loads due to improved management practices in the Great Barrier Reef catchments – Grains Cropping Modelling. Final Report. Brisbane, Queensland, Australia: Queensland Department of Natural Resources and Mines.
- Pagliai M, Vignozzi N, Pellegrini S. 2004. Soil structure and the effect of management practices. Soil Tillage Res. 79(2):131–143. doi:10.1016/j.still.2004.07.002.
- Parr JF, Bertrand AR. 1960. Water infiltration into soils. Adv Agron. 12(C):311–363. doi:10.1016/S0065-2113(08)60086-3.
- Patel SK, Mani I. 2011. Effect of multiple passes of tractor with varying normal load on subsoil compaction. J Terramechanics. 48(4):277–284. doi:10.1016/j.jterra.2011.06.002.
- Radford BJ, Yule DF, McGarry D, Playford C. 2001. Crop responses to applied soil compaction and to compaction repair treatments. Soil Tillage Res. 61(3-4):157–166. doi:10.1016/S0167-1987(01)00194-5.
- Radford BJ, Yule DF, McGarry D, Playford C. 2007. Amelioration of soil compaction can take 5 years on a Vertisol under no till in the semi-arid subtropics. Soil Tillage Res. 97(2):249–255. doi:10.1016/j.still.2006.01.005.
- Raper RL. 2005. Agricultural traffic impacts on soil. J Terramechanics. 42(3-4):259–280. doi:10.1016/j.jterra.2004.10.010.
- Ratliff LF, Ritchie JT, Cassel DK. 1983. Field-measured limits of soil water availability as related to laboratory-measured properties. Soil Sci Soc. Am J. 47(4):770–775. doi:10.2136/sssaj1983.03615995004700040032x.
- Rayment GE, Lyons DJ. 2011. Soil chemical methods: Australasia. Collingwood, VIC, Australia: CSIRO Publishing.
- Ringrose-Voase AJ, Young RR, Paydar Z, Huth NI, Bernardi AL, Cresswell HP, Keating BA, Scott JF, Stauffacher M, Banks RG, et al. 2003. Deep drainage under different land uses in the Liverpool Plains Catchment, pp. 180. Report No.: 3, Agricultural Resource Management Report Series, NSW Agriculture. The State of New South Wales. ©CSIRO.
- Ruser R, Flessa H, Russow R, Schmidt G, Buegger F, Munch JC. 2006. Emission of N2O, N2, and CO2 from soil fertilized with nitrate: effect of compaction, soil moisture, and rewetting. Soil Biol Biochem. 38(2):263–274. doi:10.1016/j.soilbio.2005.05.005.
- Sadras VO. 2020. On water-use efficiency, boundary functions, and yield gaps: French and Schultz insight and legacy. Crop Sci. 60(5):2187–2191. doi:10.1002/csc2.20188.
- Sadras VO, O’Leary GJ, Roget DK. 2005. Crop responses to compacted soil: capture and efficiency in the use of water and radiation. Field Crops Res. 91(2-3):131–148. doi:10.1016/j.fcr.2004.06.011.
- Seehusen T, Riggert R, Fleige H, Horn R, Riley H. 2019. Soil compaction and stress propagation after different wheeling intensities on a silt soil in south-east Norway. Acta Agric Scand B: Soil Plant Sci. 69(4):343–355. doi:10.1080/09064710.2019.1576762.
- Shaheb MR, Grift TE, Godwin RJ, Dickin E, White DR, Misiewicz PA. 2018. Effect of tire inflation pressure on soil properties and yield in a corn – soybean rotation for three tillage systems in the Midwestern United States. ASABE Paper No.: 1801834. St. Joseph (MI): 2018 ASABE Annual International Meeting, American Society of Agricultural and Biological Engineers. doi:10.13031/aim.201801834.
- Shaohua Y, Junyao Q, Zhenhua Z. 1999. Comparison of mathematical models for describing crop responses to N fertilizer. Pedosphere. 9(4):351–356.
- Shoji S, Delgado JA, Mosier A, Miura Y. 2001. Use of controlled release fertilizers and nitrification inhibitors to increase nitrogen use efficiency and to conserve air and water quality. Commun Soil Sci Plant Anal. 32(7):1051–1070. doi:10.1081/CSS-100104103.
- Silburn DM, Connolly RD. 1995. Distributed parameter hydrology model (ANSWERS) applied to a range of catchment scales using rainfall simulator data I: infiltration modelling and parameter measurement. J Hydrol. 172(1-4):87–104. doi:10.1016/0022-1694(95)02740-G.
- Sinclair TR. 1998. Historical changes in harvest index and crop nitrogen accumulation. Crop Sci. 38(3):638–643. doi:10.2135/cropsci1998.0011183X003800030002x.
- Slafer GA. 2003. Genetic basis of yield as viewed from a crop physiologist’s perspective. Ann Appl Biol. 142(2):117–128. doi:10.1111/j.1744-7348.2003.tb00237.x.
- Slafer GA, Andrade FH. 1993. Physiological attributes related to the generation of grain yield in bread wheat cultivars released at different eras. Field Crops Res. 31(3-4):351–367. doi:10.1016/0378-4290(93)90073-V.
- Soane BD, Blackwell PS, Dickson JW, Painter DJ. 1980-1981. Compaction by agricultural vehicles: a review. II. Compaction under tyres and other running gear. Soil Tillage Res. 1(1):373–400. doi:10.1016/0167-1987(80)90039-2.
- Spoor G, Tijink FGJ, Weisskopf P. 2003. Subsoil compaction: risk, avoidance, identification and alleviation. Soil Tillage Res. 73(1-2):175–182. doi:10.1016/S0167-1987(03)00109-0.
- Spoor G, Voorhees WB. 1986. Deep tillage. Soil Tillage Res. 8(C):317–319. doi:10.1016/0167-1987(86)90345-4.
- Tobias S, Hennes M, Meier E, Schulin R. 2001. Estimating soil resilience to compaction by measuring changes in surface and subsurface levels. Soil Use Manag. 17(4):229–234. doi:10.1111/j.1475-2743.2001.tb00032.x.
- Tullberg JN. 2000. Wheel traffic effects on tillage draught. J Agric Eng Res. 75(4):375–382. doi:10.1006/jaer.1999.0516.
- Tullberg JN, Antille DL, Bluett C, Eberhard J, Scheer C. 2018. Controlled traffic farming effects on soil emissions of nitrous oxide and methane. Soil Tillage Res. 176:18–25. doi:10.1016/j.still.2017.09.014.
- Tullberg JN, Yule DF, McGarry D. 2007. Controlled traffic farming – from research to adoption in Australia. Soil Tillage Res. 97(2):272–281. doi:10.1016/j.still.2007.09.007.
- Tullberg JN, Ziebarth PJ, Li Y. 2001. Tillage and traffic effects on runoff. Aust J Soil Res. 39(2):249–257. doi:10.1071/SR00019.
- Unger PW, Kaspar TC. 1994. Soil compaction and root growth: a review. Agron J. 86(5):759–766. doi:10.2134/agronj1994.00021962008600050004x.
- VSN International Ltd. 2013. GenStat release® 19th edition. Reference manual. Hemel Hempstead (UK): VSN International Ltd.
- Wallace AJ, Armstrong RD, Harris RH, Belyaeva ON, Grace PR, Partington DL, Scheer C. 2018. Fertiliser timing and use of inhibitors to reduce N2O emissions of rainfed wheat in a semi-arid environment. Nutr Cycling Agroecosyst. 112(2):231–252. doi:10.1007/s10705-018-9941-7.
- Watson CJ, Poland P, Miller H, Allen MBD, Garret MK, Christianson CB. 1994. Agronomic assessment and 15N recovery of urea amended with the urease inhibitor nBTPT (N-(n-butyl) thiophosphoric triamide) for temperate grassland. Plant Soil. 161(2):167–177. doi:10.1007/BF00046388.
- Whingwiri EE, Kemp DR. 1980. Spikelet development and grain yield of the wheat ear in response to applied nitrogen. Aust J Agric Res. 31(4):637–647. doi:10.1071/AR9800637.
- White EM, Wilson FEA. 2006. Responses of grain yield, biomass and harvest index and their rates of genetic progress to nitrogen availability in ten winter wheat varieties. Irish J Agric Food Res. 45(1):85–101.
- Williams JR, Kannan N, Wang X, Santhi C, Arnold JG. 2012. Evolution of the SCS runoff curve number method and its application to continuous runoff simulation. J Hydrol Eng. 17(11):1221–1229. doi:10.1061/(ASCE)HE.1943-5584.0000529.
- Wolkowski RP. 1990. Relationship between wheel-traffic-induced soil compaction, nutrient availability, and crop growth: a review. J Prod Agric. 3(4):460–469. doi:10.2134/jpa1990.0460.
- Yeboah S, Zhang R, Cai L, Li L, Xie J, Luo Z, Wu J, Antille DL. 2017. Soil water content and photosynthetic capacity of spring wheat as affected by soil application of nitrogen-enriched biochar in a semiarid environment. Photosynthetica. 55(3):532–542. doi:10.1007/s11099-016-0672-1.
- Yule DF, Radford B. 2003. Case study 9: controlled traffic farming. Summary of QPI14 project. Rockhampton, Queensland, Australia: Queensland Department of Primary Industries.
- Zadoks JC, Chang TT, Konzak CF. 1974. A decimal code for the growth stages of cereals. Weed Res. 14(6):415–421. doi:10.1111/j.1365-3180.1974.tb01084.x.