
ABSTRACT
Biochar, a carbon-rich material resulting from pyrolysation, is one of the proposed alternatives as a substrate component to peat. The aim of this study was to investigate the effect of different ratios of peat substitution with a locally available hardwood biochar on the chemical characteristics of growing media, seed germination, plant morphological and nutritional parameters of Tagetes patula. Experimental results show that biochar can be used as a partial peat replacement, showing a complementary liming effect, rising the initial pH of peat (2.8) to values of 4.5 and 7.3 in mixtures with 50% and 75% substitution of peat by biochar, respectively. The mixture with a 50% biochar rate exhibited the strongest change between initial and final pH, rising from 4.5 to 5.7. Increasing content of biochar in the mixtures corresponded to increasing content of total K, Ca, Mg, available K and decreasing level of available Mg. The highest germination percentage was observed in the mixtures with biochar rates from 50% to 100%. Among all substrates, the greatest plant diameter, true leaf area and total root length were measured in the 50% peat substitution mixture, where the highest contents of P, K and Ca in plant shoots were found.
Introduction
Peat, a bulky material originating from partially decomposed organic matter, the main component being Sphagnum moss, is the most commonly used material in container substrates (Simpson Citation2010; Gruda et al. Citation2019), accounting for up to 80% of the growing media used in Europe (Schmilewski Citation2017). High water holding capacity, very low salinity, low nutrient content and low number of pathogens make peat a suitable substrate material (Bigelow et al. Citation2004; Desbiens et al. Citation2008), which can be easily adapted to satisfy the specific needs of the culture. Peat extraction worldwide represented 30,000 tn in 2019, of which 1000 were extracted in Estonia (U.S. Geological Survey Citation2020). Peatlands are a major store of soil carbon, a sink for carbon dioxide and unique ecosystems for biodiversity maintenance (Strack Citation2008; Kern et al. Citation2017). Thereby, in several countries, there are initiatives pressing for peatland preservation (LIFE programme Citation2015), with some countries moving towards completely phasing out the use of peat in horticulture (Government of the United Kingdom Citation2018). These facts, alongside with increasing demand and rising costs for peat, as a non-renewable resource, highlight the need for substitutes (Kern et al. Citation2017).
Biochar is a carbon-rich solid material produced from various feedstocks, by thermal decomposition, under partial exclusion of oxygen and at relatively low temperatures (Lehmann and Joseph Citation2009), and it is one of the alternatives that has been proposed as a peat substitute (Ferlito et al. Citation2020). The properties of biochar depend on the raw material (feedstock) and on carbonisation conditions, including temperature, oxygen level and reaction time (Tan et al. Citation2017; Weber and Quicker Citation2018). Biochar produced from nutrient-poor feedstock, such as wood, has low nutrient content (Gaskin et al. Citation2008) and is very recalcitrant against microbial decay (Kuzyakov et al. Citation2009) thus allowing to increase the longevity of growing media by reducing its degradation and decomposition (Tian et al. Citation2012). Biochar produced from mineral-rich feedstock can have high pH value and content of salts, which can result in big concentrations in osmotic stress for plants (Gaskin et al. Citation2008). The variability of electrical conductivity between different biochars is mainly associated with their ash content (Rehrah et al. Citation2014). The content of nutrients in the soilless substrate can be modified by addition of biochar, principally by increasing the content of several macro- and micronutrients (Dispenza et al. Citation2016; Chrysargyris et al. Citation2019), providing in some cases even bigger amounts of nutrients than fertiliser (Altland and Locke Citation2017).
Physical and chemical properties of wood biochar can vary greatly depending on the plant species used as feedstock (Vaughn et al. Citation2015). For instance, biochar produced from low-density wood can have a greater number of pores, which can retain available water for plants, compared to those made from high-density wood (Werdin et al. Citation2020). The size of macropores in biochar used as soil amendment also plays an important role in water retention, determining the main pore volume for water storage (Hyväluoma et al. Citation2018; Lu and Zong Citation2018). For example, a greater macropore size has been found in hardwood biochar made from poplar wood, compared to softwood from pine (Zhang and You Citation2013).
Biochar is generally characterised by a substantial liming capacity due to the large amount of mineral content obtained from feedstock (Lehmann and Joseph Citation2015). The addition of biochar commonly increases the alkalinity of peat (Tian et al. Citation2012; Conversa et al. Citation2015; Dispenza et al. Citation2016; Prasad et al. Citation2018). However, pH of biochar depends on the raw material and carbonisation conditions, mainly temperature, oxygen level and reaction time (Tan et al. Citation2017; Weber and Quicker Citation2018) and it is known to be in relation with the ash content (Lehmann Citation2007a, Citation2007b). The liming potential of biochar produced by pyrolysis is a consequence of its high alkalinity (Vassilev et al. Citation2010). Therefore, biochars produced from woody feedstocks with lower ash content usually have lower pH than those made of green waste (Smider and Singh Citation2014). Gezahegn et al. (Citation2019) found that the pH of biochar made from wood varies depending on the plant species used as feedstock and that pH of biochar made from angiosperms is higher than that made from conifers. Also, biochars produced from temperate-climate wood contain less ash than those made from tropical and subtropical woods (Someshwar Citation1996), influencing also pH. A change in biochar pH can also take place in post-production, depending on environmental conditions (Cheng et al. Citation2006; Nguyen and Lehmann Citation2009).
Biochar production can be also an alternative for the management of organic residues, such as those from the food industry, crop residues and manures or other industry residues (Speratti et al. Citation2018; Elkhalifa et al. Citation2019). The biochar used in this study is a by-product of the local barbecue charcoal production industry, making it an inexpensive and locally available material. The feedstock used for the production of the studied biochar was a wood mix dominated by poplar and alder wood, two of the most frequent genera in the region (Laasimer Citation1975; Paal Citation1998).
Numerous studies have tested biochar as a peat substitute, but in most cases, fertilised peat-biochar mixtures were used. The addition of fertilisation, as well as the interaction biochar-fertiliser, can mask the positive effect of biochar addition on nutrient balance and plant growth (Baronti et al. Citation2010; Glaser et al. Citation2014; Di Lonardo et al. Citation2017; Ye et al. Citation2019; Videgain-Marco et al. Citation2020).
According to the above mentioned, the hypothesis of the current study is that hardwood biochar could be used for partial substitution of peat and that biochar substitution would have an additional simultaneous liming effect. The aim of the study was to evaluate the liming effect of the hardwood biochar for peat neutralisation by different substitution ratios, without additional pH adjustment and fertilisation, and its effect on seed germination and young plant growth of Tagetes patula.
Materials and methods
Experimental material and conditions
The biochar investigated in this experiment is a by-product of the local barbecue charcoal production industry (Biolan Baltic OÜ, Lavassaare, Estonia) produced by slow pyrolysis at 500–600°C from hardwood mix of leafy trees, with dominant wood of poplar and alder. After pyrolysation, it was mechanically blended, with a final maximal fraction size of 4.0 mm. The resulting biochar was characterised by a pH of 8.75, Ntot of 0.08%, Ctot of 12%, Corg of 8.5%, Ptot of 0.05%, Ktot of 0.13%, PMehlichIII 2.6 mg 100g−1, KMehlichIII 115 mg 100g−1, CaMehlichIII 196 mg 100g−1, MgMehlichIII 72 mg 100g−1, 60% ash content and specific surface area 32 m2 g−1. Peat (0–3 mm sized, H1 decomposition degree) was obtained from Elva E.P.T. (Estonia) and characterised by a pH of 2.80, PMehlichIII 1.7 mg 100g−1, KMehlichIII 38 mg 100g−1, CaMehlichIII 497 mg 100g−1 and MgMehlichIII 268 mg 100g−1. Nine different substitution ratios of peat with biochar were tested, containing 0%, 2%, 5%, 10%, 15%, 25%, 50%, 75% and 100% of biochar ().
Table 1. Experimental peat-biochar mixtures with different substitution ratios of peat by hardwood biochar.
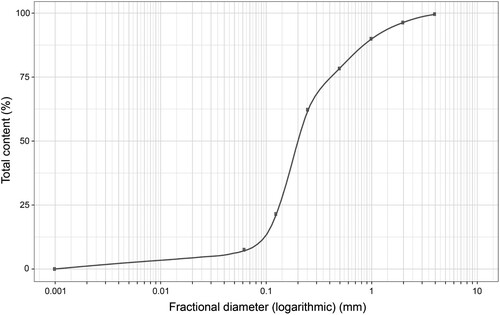
Sieve analysis was performed by sieve shaker device Sieve Tronic Impact equipped with an electrical vibration table, using a set of 8 plates with different sieve diameters (4 mm, 2 mm, 1 mm, 500 µm, 250 µm, 125 µm and 62.5 µm). After a 7-min vibration of the sieves, the sample was divided into 9 different fractions according to their diameter (>4 mm, 2–4 mm, 1–2 mm, 1000–500 µm, 500–250 µm, 250–125 µm, 125–62.5 µm and <62.5 µm). The grading curve of the biochar can be presented as the ratio of biochar fractional mass (% of initial content) retained with each fractional diameter ().
Figure 1. The grading curve of fractional content of biochar. Percentage ratio of fractional mass retained for each fractional diameter in logarithmic scale.
The experiment was conducted in a controlled-temperature greenhouse of the Botanical Garden of the University of Tartu during 33 days from January 11th to February 12nd of 2016. The greenhouse temperature was kept between 20°C and 25°C during daytime and between 18°C and 20°C at night, with a 12 h photoperiod and relative humidity between 55% and 70%. Irradiance illumination was supplied by Osram (Osram GmbH, Munich, Germany) with 400 W high-pressure sodium lamps (Plantastar).
Experimental design and methods
For each mixture, two cell plug trays (37 × 28 × 5.8 cm) with 54 cells each (59 ml) were used. Holes in the bottom of the cell plug trays made possible drainage of excess water. The 28 central cells of each plug tray were used for experimental purpose, leaving border cells (26) as a defense row. Each treatment was represented by four replicates with 14 cells used as a replicate. Altogether, there were 18 cell plug trays with different mixtures, arranged in a completely randomised design.
Two seeds of Tagetes patula ‘Carmen’ (Kurzemes sēklas, Talsi, Latvia) with 84% maximum germination percentage were placed in each cell after filling 3/4 of its volume with the treatment mixture, and then covered with 2 mm of the same mixture. After sowing, cells of all treatments received equal amounts of distilled water.
Counts of germination were recorded daily for healthy seedlings (bearing both root and shoot) until no further germination occurred. Germination percentage was counted when the cotyledons were fully expanded. During this time, watering with distilled water was applied according to the measured moisture content in the substrates. No additional fertilisers were applied.
Data regarding plant morphological parameters (plant height and diameter, cotyledon and true leaf area, dry biomass of plant shoots and roots and root growth parameters) were collected. Plant height and diameter from the highest and widest point, respectively, were measured in the end of the experiment (33 days). Plant shoots and roots were separated after harvesting, and the roots were then hand-washed from substrate remains. Cotyledon and true leaf area were measured using a portable leaf area meter (AM100, ADC BioScientific Ltd., Hoddesdon, UK). The dry biomass of plant shoots and roots was determined after drying to constant weight at 85°C in a thermo-ventilated oven.
For the analysis of root growth parameters, the intact root system without stump of each plant was evenly spread apart in a water layer on a transparent tray (10 × 15, 15 × 20 cm) and imaged at a resolution of 600 dpi (dots per inch) with an Epson Expression 1680 Professional (Seiko Epson Scanning Corporation, Nagano, Japan) scanning system. Root images were analysed for total root length, average root diameter and root volume using WinRHIZO Pro 4.0b software (Regent Instruments Inc., Quebec, Canada).
For the evaluation of pH and electrical conductivity (EC) change in the growing media during the experimental time, initial and final pH and EC were measured from each tested mixture. pH was measured in a suspension of mixture in a solution 1:5 v:v of 1 mol KCl by S20 SevenEasy pH Meter (Mettler-Toledo, Columbus, OH, USA). EC was determined in a suspension of mixture in a solution 1:5 v:v of distilled water by Jenway 4330 Conductivity and pH meter (East Lyme, USA).
Total content of N, C, P, K, Ca, Mg, as well as content of available P, K, Ca and Mg in peat-biochar mixtures were measured after plant harvesting. The mixtures were dried, grinded and sieved through a 2 mm sieve. The total content of C and N was analysed using a VarioMAX CNS analyser (Elementar Analysensysteme GmbH, Langenselbold, Germany). Content of available P, K, Ca and Mg was determined by the Mehlich-3 method (Council on Soil Testing and Plant Analysis Citation1992). The biochar ash content was measured by heating biochar samples for 6 h at 750°C temperature in a muffle furnace, and the specific area by the Brunauer–Emmett–Teller (BET) method (Brunauer et al. Citation1938).
N, C, P, K, Ca and Mg in plant shoots were analysed after plant harvesting. The content of nutrients in plant shoots was determined only for peat-biochar mixtures with biochar rate from 15% to 100%, it was not possible to analyse for mixtures with biochar content from 0% to 10% due to the insufficient amount of plant biomass. Plant shoots were dried and grinded. Content of C and N was analysed using a VarioMAX CNS analyser (Elementar Analysensysteme GmbH, Langenselbold, Germany).
For the analysis of the total content of P, K, Mg and Ca in peat-biochar mixtures and plant shoots, the samples were mineralised after boiling in acid environment and determined by atomic emission spectrometry with an MP-4100 (Agilent Technologies, Inc., CA, USA).
Statistical analysis
Statistical analyses were carried out using the R programming language (R Core Team Citation2016). Box-and-whiskers follow the conventions described by Tukey (Citation1977). Normality of the data was tested using the Shapiro–Wilk test. Non-normally distributed data were transformed when possible, and non-parametric tests were used when the transformation was not successful. The Wilcoxon signed-rank test was used to identify the difference between initial and final data of pH and EC. Analysis of variance (ANOVA) was used to test existent differences between treatments. When significant differences existed, the Tukey’s Honestly Significant Difference test (Tukey’s HSD) was applied to identify the differences among the treatments. The Kruskal–Wallis test followed by a post-hoc Dunn’s multiple comparison test was used when assumptions of ANOVA were not met. The Kruskal–Wallis test and the Tukey HSD test were performed with the package ‘agricolae’ (Mendiburu Citation2015). The Dunn test was performed with the package ‘FSA’ (Ogle et al. Citation2019).
Results and discussion
Chemical characteristics of peat-biochar mixtures
The pH of peat-biochar mixtures varied with the degree of peat substitution by biochar (); the higher peat substitution rate by biochar resulted in a higher pH in the mixtures. Biochar showed the ability to compensate for the low pH (2.8) of peat, rising it to values of 4.5 and 7.3 in mixtures with 50% and 75% substitution of peat by biochar, respectively. As expected, the highest pH (8.8) among the treatments was observed in pure biochar. The high alkalinity of biochar is the result of the removal of acidic functional groups and the replacement by alkaline elements and alkali salts during carbonisation (Ueno et al. Citation2007; Fuertes et al. Citation2010), such as soluble Ca, Mg and K oxides, hydroxides and carbonates (Demeyer et al. Citation2001). Therefore, the increase of pH in peat-biochar mixtures, after biochar addition, was caused mainly by the high-ash content in the biochar. An increase of pH in peat-based substrate is commonly reported after addition of biochar (Tian et al. Citation2012; Conversa et al. Citation2015; Dispenza et al. Citation2016). The observed increase of pH in the mixtures with higher biochar addition is in accordance with Prasad et al. (Citation2018), who concluded that biochar with high pH can act as a liming material for acid peat.
Figure 2. Effect of peat substitution by biochar on initial and final (a) pHKCl and (b) electrical conductivity (mS m−1) (mean ± standard error). Different letters indicate different groups according to Tukey HSD test (α = 0.05), lower case for differences among treatments for initial pH and EC, upper case for differences among treatments for final pH and EC. Stars indicate significant differences between initial and final for each treatment according Wilcoxon signed-rank test (p < .05).
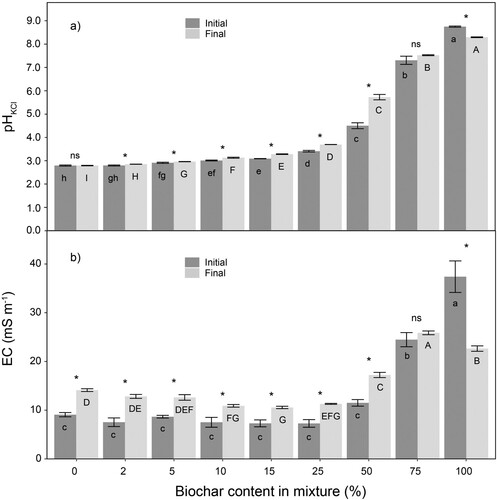
A change between initial and final pH of the mixtures was observed for most treatments in a one-month period. Increases of pH took place in peat-biochar mixtures with biochar content ranging from 2% to 50%, with the difference between initial and final pH increasing with higher content of biochar. The mixture with 50% biochar rate had the strongest change between initial and final pH, rising from 4.5 to 5.7. An increase of pH in the mixtures with biochar rate from 2% to 50% could be caused by the dissolution of mineral matter of biochar with high-ash content dominating over the oxidation process. It has been suggested that the change of pH of biochar during the incubation period may be the result of two simultaneous but opposed processes: carbon oxidation and alkaline mineral dissolution (Cheng et al. Citation2006; Nguyen and Lehmann Citation2009). Nguyen and Lehmann (Citation2009) proposed that an increase of pH during the incubation period may be caused by the bigger release of alkaline metals like Na, K, Mg and Ca, compensating for a parallel process of acidification with oxidation. This release of alkaline metals would be higher from biochar with high ash content compared to biochar with lower ash content. Basso (Citation2012) suggested that an increase of pH in soil with biochar addition during incubation time was caused by the dissolution of oxides, carbonates and hydroxides of the biochar ash.
Only mixtures with 75% and 100% biochar had a significantly different initial EC from the rest, with initial EC being the highest (p < .05) in pure biochar (37.4 mS m−1) (). Final EC values ranged from 10.6 to 25.9 mS m−1, with the highest value for BC75 (25.9 mS m−1), where no visual damages of plant tissues were detected. An increase of EC from initial values was observed at the end of the experiment, for substrates with biochar rate from 0% to 50%. Higher EC values are related with a higher amount of soluble salts (ash) in biochar (Ok et al. Citation2015), which are present as major soluble and readily dissolvable major cations (Rhoades Citation1996). The dissolution of biochar mineral matter during the incubation time (Nguyen and Lehmann Citation2009) would explain the increase of EC due to the growth of the content of major soluble cations in the mixtures with biochar rate from 0% to 50%. According to the salinity ranges recommended by Bunt (Citation1988), in the present study, EC values of the mixtures with biochar content from 0% to 100% were located in the range of suitable EC values for plant growth.
In the case of pure biochar (BC100), the decrease of pH and EC during the experimental time may be due to the decrease of water-soluble alkaline fraction of biochar, in the absence of peat, by higher leaching during watering process due to the smaller retention capacity compared to the peat-biochar mixtures. The mixtures with peat could retain the soluble salts from the biochar, but in the case of pure biochar, these losses were much higher. This would explain why for all treatments with peat, pH and EC increased or remained on the same level during the experiment, and only for 100% biochar pH and EC decreased. Biochar produced from wood chips has lower water holding capacity than peat-biochar mixture (85%:15% v:v), as biochar consists of coarse particles, and the pores between them are too large to retain water (Blok et al. Citation2017). Vassilev et al. (Citation2013) reported, from literature review, that for water-soluble elements, as much as 100% of Na, 98.1% of K, 39% of Mg and 19.7% of Ca of maximum content (w:v) could be leached with water from biochar ash produced mainly from wood and straw biomass. According to Nguyen and Lehmann (Citation2009), the lower percentages of alkaline metals (Na, K, Mg, Ca) in wood biochar after incubation are insufficient to compensate for oxidation, causing a decrease of pH during incubation time.
Increasing amount of biochar corresponded to increasing content of total K, Ca, Mg and available K and decreasing level of available Mg ( and ). Statistically significant differences were found for total N, C, P and available Ca between the treatments. The highest content of available P was observed in pure biochar compared to all other mixtures. Available K content varied among the media, with the lowest value in pure peat and BC2, whereas the highest content was found in pure biochar. However, the level of available K in BC50 and BC75 was lower than in BC25, locating outside the consistent pattern for the rest of the treatments. This change could be caused by a higher K uptake by plants during the experimental time.
Table 2. The total content of nutrients in the different treatments in the end of the experiment.
Table 3. The content of available nutrients in the different treatments in the end of the experiment.
The higher content of nutrients in peat-biochar mixtures with higher peat substitution rate by biochar may be related to the bigger amount of these inorganic elements in the original biochar. This could be also associated with the high content of ash in the studied biochar. Ash contains noteworthy content of K, Na, Ca and Mg (Long et al. Citation2012), and the main components of biomass ash are oxides, such as SiO2, CaO, K2O, as well as lower but significant levels of P2O5, Al2O3 and MgO (Vassilev et al. Citation2013). The application of biochar increases nutrient availability in growing media due to the great capacity for nutrient retention of biochar (Lehmann et al. Citation2003). An increase of available K content with higher wood biochar rate in growing media has been reported also in previous studies (Dispenza et al. Citation2016; Chrysargyris et al. Citation2019). However, the content of all tested-available nutrients in the current study remained extremely low when compared to the optimal values for plant growth (Silber and Bar-Tal Citation2008).
Germination
The final germination rate varied from 16.1% (BC0) to 67.9% (BC75) among the treatments, with the highest germination in substrates between 50% and 100% of peat substitution by biochar (p < .05) (). These findings are consistent with those of Nieto et al. (2016) for Lactuca sativa, where the highest germination rate was observed for the mixture with 75% pruning waste biochar added to brown peat.
Figure 3. Effect of peat substitution by biochar on final germination percentage (%) of Tagetes patula seeds (mean ± standard error). Different letters indicate different groups according to Dunn test (α = 0.05).
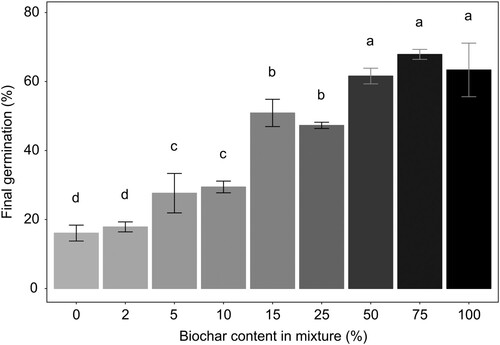
Peat substitution by biochar affected germination, with a higher number of germinated seeds in the substrates with higher biochar content. The increase of germination rate could be caused by the higher pH, with values being closer to the optimal pH for BC50 (4.5), BC75 (7.3) and BC100 (8.8), compared to the mixtures with biochar content from 0% to 25%, that presented pH values from 2.8 to 3.4. Seed germination can be affected by several factors, but the most important are air temperature and humidity, also moisture content, pH and EC of germination media. A pH situated outside the optimal range can result in a reduction or even failure of germination; likewise, a content of soluble salts too high can burn the emerging roots (Carlson and Rowley Citation1980). Tripathi et al. (Citation2007) reported that growing media pH affects germination activity by initiating enzyme α-amylase; with the highest activity and, subsequently, maximum seed germination percentage presenting at the optimal pH range.
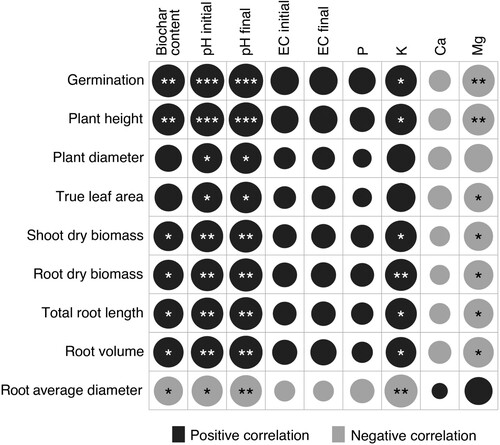
During the one-month period, salinity levels of all mixtures were located in the adequate range for plant growth and could have had a neutral effect on seed germination rate. Similar conclusion can be made from the absence of a statistically significant correlation between initial and final EC and germination ().
Figure 4. Correlation analysis (Pearson’s correlation coefficient, r) between germination (%), plant growth parameters and growing media characteristics (pHKCl, EC, available P, K, Ca and Mg). Black colour indicates positive and grey colour negative correlation; asterisks indicate statistically significant correlations (p < .05).
As above mentioned, the content of tested nutrients in peat-biochar mixtures stayed extremely low, but this should not limit germination, as germination media is usually characterised by a low content of nutrients (Carlson and Rowley Citation1980).
Plant growth, morphology and nutritional status
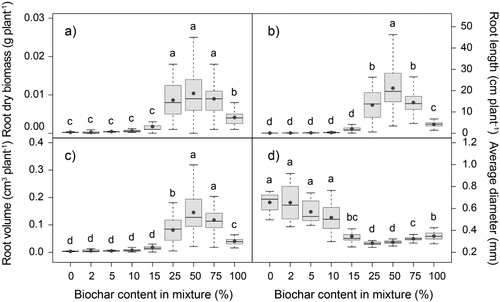
Peat replacement by hardwood biochar affected plant growth of Tagetes patula ( and ). Wider plants with bigger leaf area and root system were observed in the mixtures with higher biochar rate, relative to the ones with lower percentage of biochar content. Among all substrates, the biggest plants, both for size of leaves and roots, were measured in BC50. In the mixtures with biochar rates between 0% and 10%, plants did not develop true leaves. Plant height and root volume were significantly higher in BC50 and BC75, compared to all other treatments. Plants produced the biggest shoot dry biomass in mixtures with biochar content from 25% to 75%. Similarly, the highest value of root dry biomass was observed in substrates with 25%, 50% and 75% peat substitution by biochar. According to the bigger root length and smaller average diameter in BC50, plants produced bigger amount of thinner secondary roots.
Figure 5. Effect of peat substitution by biochar on (a) plant height (mm), (b) plant diameter (mm), (c) shoot dry biomass (g plant−1) and (d) true leaf area (mm2 plant−1) of Tagetes patula. Grey dot represents the mean. Different letters indicate different groups according to Dunn test (α = 0.05).
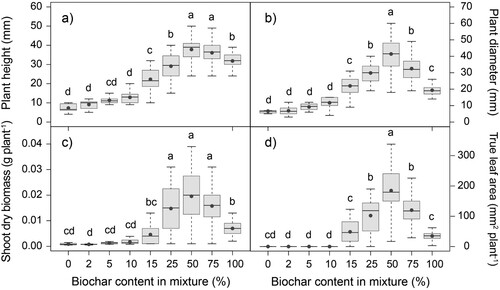
Figure 6. Effect of peat substitution by biochar on (a) root dry biomass (g plant−1), (b) total root length (cm plant−1), (c) root volume (cm3 plant−1) and (d) root average diameter (mm) of Tagetes patula (mean ± standard error). Grey dot represents the mean. Different letters indicate different groups according to Dunn test (α = 0.05).
Peat substitution by biochar affected nutrient content in plant shoots (). The highest content of P, K and Ca was observed in BC50. Ca content in the shoots was higher in the mixtures ranging from 25% to 75% and lower in 15% and 100%, but the opposite trend was found for Mg. Shoot N level, however, was significantly higher in BC15, among all treatments, with the second highest content found in BC50, followed by BC25, BC75 and BC100. These results are similar to those reported in previous studies, with a higher Ca content in plant tissue in a substrate with 50% of wood biochar than with 25% biochar content (Prasad et al. Citation2018), as well as increased K content in a mixture with 70% of biochar, compared to 30% (Conversa et al. Citation2015). In the present study, several plant parameters correlated with K content of growing media (). Potassium cation is associated with many of the physiological processes supporting plant growth and development, like photosynthesis, assimilates transport and enzyme activation (Pettigrew Citation2008).
Table 4. Effect of peat substitution by biochar on the nutrient content in plant shoots.
Biochar addition contributes to plant growth mostly by the improvement of the nutrient status, cation-exchange capacity and the correction of the pH of the growing media (Noguera et al. Citation2012; Vanek and Lehmann Citation2014). In a meta-analysis, Jeffery et al. (Citation2017) concluded that plant growing conditions can be improved by biochar addition mostly through liming effect and retention of N and K, P availability, as well as, direct addition of K. Likewise, Lehmann et al. (Citation2003) reported that positive crop response and an increase of nutrient uptake mainly resulted by directly supplied nutrients P, Ca, Zn, Cu and, especially K. Contrarily, N availability may decrease with biochar application because of the increased C/N ratio in growing media, resulting in higher N immobilisation and, therefore, a smaller rate of net N mineralisation (Lehmann et al. Citation2003; Uzoma et al. Citation2011).
The limitation of plant growth in the mixtures with low ratio of biochar could also be caused by the very low initial pH. The optimum range of pHKCl for peat-based container media is in the range between 5.3 and 6.5 (Astover and Leedu Citation2019), where higher content of nutrients is available for plants (Lucas and Davis Citation1961). In the present study, the biggest plant diameter, greatest leaf area and root length were found for BC50, which was the only treatment with a pH value (final pH of 5.7) in the optimal range. The higher values of plant diameter, leaf area and root length could be a consequence of the higher nutrient availability due to values of pH being close to the optimal, as the highest content of P, K and Ca presented in plant shoots of BC50. The pH in BC75 being near the optimal can also explain the positive effect on plant height and root biomass, compared to other mixtures. The significant correlation observed between shoot and root growth parameters and both initial and final pH (), indicated that the growing media pH influenced plant performance during the entire experimental time. Plant availability of macro- and micronutrients is in relation with the pH of the growing media, pH conditions the relative availability of plant nutrients at various degrees of soil acidity (Altland and Buamscha Citation2008). The availability of P can be increased by a decrease of soluble Al content and an increase of Ca/Al ratio through the optimisation of pH in growing media, by the addition of alkaline biochar (Pandit et al. Citation2018). The findings of the present study are consistent with those from a previous study for Euphorbia ×lomi, where plant ornamental value was higher in a mixture with 60% wood biochar added to peat (v:v), with pH closer to the neutrality, compared to pure peat and pure biochar (Dispenza et al. Citation2016).
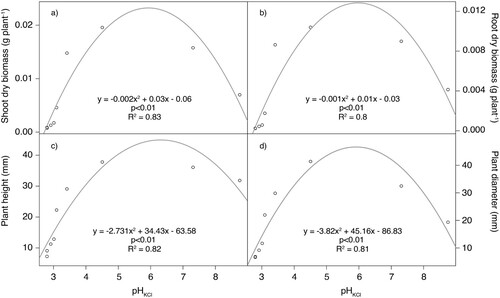
The quadratic regression used to model the relationship between shoot and root dry biomass, plant height and plant diameter with pH showed a strong relationship between pH and these parameters (p < .001, R2 = 0.85; p < .01, R2 = 0.83; p < .01, R2 = 0.82; and p < .01, R2 = 0.81) (). According to this modelling, the theoretical maximum shoot and root dry biomass, plant height and diameter would be at a pH of 5.9, 6.0, 6.3 and 5.9, values that are located in the optimal range. Using the linear regression between initial pH and peat substitution rate (y = 0.06x + 2.39, p < .001, R2 = 0.95), the estimation of the optimal biochar content for these parameters would be 58%, 60%, 65% and 58%, respectively. Similar values (56%, 57%, 65%, 56% substitution rate) can be obtained by directly fitting a quadratic regression for the same plant parameters and peat substitution rate.
Figure 7. Quadratic regression between pH and (a) shoot dry biomass, (b) root dry biomass, (c) plant height and (d) plant diameter.
All tested plant root parameters significantly correlated with growing media pH and K content (). Root growth, as in the case of plant shoots, was likely increased by a better nutrient supply as a result of the pH being closer to optimal after biochar application in the mixtures with higher biochar content, when compared to lower content. In a meta-analysis, Xiang et al. (Citation2017) concluded that root length increases due to the increase of soil alkalinity and porosity by biochar addition, which helps absorption of relatively immobile nutrients like K and P (Eissenstat Citation1992). Eissenstat and Yanai (Citation1997) reported that root length is usually presumed to be proportional to the absorbed nutrients and water, and that root diameter is important for the accumulation of plant biomass. In their meta-analysis, Xiang et al. (Citation2017) also reported that biochar application significantly increases several plant root parameters like biomass, length, volume, surface area and number of root tips. The increase of root length in growing media with added biochar may assist plants to find more nutrients (Eissenstat Citation1992). A positive effect of wood biochar on root length was found also by Dispenza et al. (Citation2016) for Euphorbia ×lomi, with root length increasing in substrates with biochar rate from 60% to 100% added to peat, with respect to pure peat. Likewise, the addition of 20% softwood biochar to peat-vermiculite (50:30, v:v) mixture resulted in an increase of plant height and dry root biomass of Syngonium podophyllum (Zulfiqar et al. Citation2019).
The higher total root length and smaller average diameter in BC25, BC50 and BC75 indicate that plants produced bigger amount of thinner secondary roots. Average root diameter ((d)) followed an opposed trend to that of the rest of root parameters: decreasing with plants of bigger root length and bigger shoot and root dry biomass. A smaller root diameter with biochar addition has been previously reported (Zhu et al. Citation2018), and specifically a decreasing root diameter with higher rates of biochar (Olmo et al. Citation2015). This has been related to an enhanced fine root development. In fact, a bigger fine root biomass has been reported after biochar addition in several studies (Zhu et al. Citation2018), and several mechanisms have been proposed to explain the proliferation of fine roots: increased retention of water and nutrients, such as total N and available K, Mg and P in biochar, leading to a maximisation of the biochar-root interaction through fine root proliferation (Olmo et al. Citation2014; Olmo et al. Citation2015); the small diameters of fine pore channels applying radial pressure on roots but not limiting root growth in length, resulting in smaller root diameter (Bengough Citation2003; Kolb et al. Citation2012); and root adaptation to changes in soil physical and chemical properties (Razaq et al. Citation2017). Average diameter showed a strong significant negative correlation with soil initial and final pH (r = −0.765, p < .05; r = −0.785, p < .05), but the correlation was strongest with potassium content (), suggesting that nutrient content could be a key factor conditioning average root diameter. The high negative correlation between root average diameter and K (r = 0.868, p < .01) could indicate that the nutrient content in biochar promoting an increased biochar-root interaction was the main reason explaining fine root development.
Acknowledgements
We would like to thank the Botanical Garden of the University of Tartu for the opportunity to conduct this experiment in their premises.
Disclosure statement
No potential conflict of interest was reported by the author(s).
Additional information
Funding
Notes on contributors
Olesja Escuer
Olesja Escuer is a PhD student of the Chair of Horticulture of the Estonian University of Life Sciences. Her fields of research are horticulture and agricultural sciences (https://www.etis.ee/CV/Olesja_Volkova/eng).
Kadri Karp
Kadri Karp is a professor and the head of the Chair of Horticulture of the Estonian University of Life Sciences. Her fields of research are horticulture, biosciences and environment, and agricultural sciences (https://www.etis.ee/CV/Kadri_Karp/eng).
Jordi Escuer-Gatius
Jordi Escuer-Gatius is a junior researcher of the Chair of Soil Science of the Estonian University of Life Sciences. His fields of research are biosciences and environment, agricultural sciences and emissions of greenhouse gases (https://www.etis.ee/CV/escuer/eng).
Henn Raave
Henn Raave is a researcher of the Chair of Soil Science of the Estonian University of Life Sciences. His fields of research are biosciences and environment, agricultural sciences and grassland husbandry (https://www.etis.ee/CV/Henn_Raave/eng).
Tõnis Teppand
Tõnis Teppand is a lecturer of Analytical Selection of Building Structures of the Chair of Rural Building and Water Management of the Estonian University of Life Sciences. His fields of research are natural sciences and engineering, construction and municipal engineering, civil engineering, hydraulic engineering, offshore technology, soil mechanics and shell structures (https://www.etis.ee/CV/Tõnis_Teppand/eng).
Merrit Shanskiy
Merrit Shanskiy is an associated professor of Soil Science of the Chair of Soil Science of the Estonian University of Life Sciences. Her fields of research are biosciences and environment, and agricultural sciences (https://www.etis.ee/CV/Merrit_Shanskiy/eng).
References
- Altland JE, Buamscha MG. 2008. Nutrient availability from Douglas Fir bark in response to substrate pH. HortScience. 43(2):478–483.
- Altland JE, Locke JC. 2017. High rates of gasified rice hull biochar affect geranium and tomato growth in a soilless substrate. J Plant Nutr. 40(13):1816–1828.
- Astover A, Leedu E. 2019. Mulla happesus ja lupjamine. Tartu: Estonian University of Life Sciences. ISBN 978-9949-629-79-4 (print), ISBN 978-9949-629-80-0 (pdf), ISSN 2504-8074.
- Baronti S, Alberti G, Delle Vedove G, Di Gennaro F, Fellet G, Genesio L, Miglietta F, Peressotti A, Vaccari FP. 2010. The biochar option to improve plant yields: first results from some field and pot experiments in Italy. Ital J Agron. 5(1):27–34.
- Basso AS. 2012. Effect of fast pyrolysis biochar on physical and chemical properties of a sandy soil. Ames (IA): Iowa State University.
- Bengough AG. 2003. Root growth and function in relation to soil structure, composition, and strength. In: de Kroon H, Visser EJW, editors. Root ecology. Ecological studies (Analysis and synthesis). Berlin: Springer-Verlag Berlin Heidelberg; p. 151–171.
- Bigelow CA, Bowman DC, Cassel DK. 2004. Physical properties of three sand size classes amended with inorganic materials or Sphagnum peat moss for putting green rootzones. Crop Sci. 44(3):900–907.
- Blok C, van der Salm C, Hofland-Zijlstra J, Streminska M, Eveleens B, Regelink I, Fryda L, Visser R. 2017. Biochar for horticultural rooting media improvement: evaluation of biochar from gasification and slow pyrolysis. Agronomy. 7(1).
- Brunauer S, Emmett PH, Teller E. 1938. Adsorption of gases in multimolecular layers. J Am Chem Soc. 60(2):309–319.
- Bunt BR. 1988. Media and mixes for container-grown plants. Dordrecht: Springer Netherlands.
- Carlson WH, Rowley EM. 1980. Bedding plants. In: Larson RA, editor. Introduction to floriculture. Academic Press; p. 477–522.
- Cheng C-H, Lehmann J, Thies JE, Burton SD, Engelhard MH. 2006. Oxidation of black carbon by biotic and abiotic processes. Org Geochem. 37(11):1477–1488.
- Chrysargyris A, Prasad M, Kavanagh A, Tzortzakis N. 2019. Biochar type and ratio as a peat additive/partial peat replacement in growing media for cabbage seedling production. Agronomy. 9(11).
- Conversa G, Bonasia A, Lazzizera C, Elia A. 2015. Influence of biochar, mycorrhizal inoculation, and fertilizer rate on growth and flowering of Pelargonium (Pelargonium zonale L.) plants. Front Plant Sci. 6:429.
- Demeyer A, Voundi Nkana JC, Verloo MG. 2001. Characteristics of wood ash and influence on soil properties and nutrient uptake: an overview. Bioresour Technol. 77(3):287–295.
- Desbiens MC, Bussières P, Caron J, Beeson R, Haydu J, Boudreau J, Elrick D. 2008. Improved water saving in nursery production using Sphagnum peat. Acta Hortic. 779:407–414.
- Di Lonardo S, Baronti S, Vaccari FP, Albanese L, Battista P, Miglietta F, Bacci L. 2017. Biochar-based nursery substrates: The effect of peat substitution on reduced salinity. Urban For Urban Green. 23:27–34.
- Dispenza V, De Pasquale C, Fascella G, Mammano MM, Alonzo G. 2016. Use of biochar as peat substitute for growing substrates of euphorbia × lomi potted plants. Span J Agric Res. 14(4).
- Eissenstat DM. 1992. Costs and benefits of constructing roots of small diameter. J Plant Nutr. 15(6–7):763–782.
- Eissenstat DM, Yanai RD. 1997. The ecology of root lifespan. Adv Ecol Res. 27(C):1–60.
- Elkhalifa S, Al-Ansari T, Mackey HR, McKay G. 2019. Food waste to biochars through pyrolysis: A review. Resour Conserv Recycl. 144:310–320.
- Ferlito F, Torrisi B, Allegra M, Stagno F, Caruso P, Fascella G. 2020. Evaluation of conifer wood biochar as growing media component for citrus nursery. Applied Sciences. 10(5).
- Fuertes AB, Arbestain MC, Sevilla M, Maciá-Agulló JA, Fiol S, López R, Smernik RJ, Aitkenhead WP, Arce F, Macías F. 2010. Chemical and structural properties of carbonaceous products obtained by pyrolysis and hydrothermal carbonisation of corn stover. Soil Research. 48(7):618–626.
- Gaskin JW, Steiner C, Harris K, Das KC, Bibens B. 2008. Effect of low-temperature pyrolysis conditions on biochar for agricultural use. Transactions of the ASABE. 51(6):2061–2069.
- Gezahegn S, Sain M, Thomas S. 2019. Variation in feedstock wood chemistry strongly influences biochar liming potential. Soil Systems. 3(2.
- Glaser B, Wiedner K, Seelig S, Schmidt H-P, Gerber H. 2014. Biochar organic fertilizers from natural resources as substitute for mineral fertilizers. Agronomy for Sustainable Development. 35(2):667–678.
- Government of the United Kingdom. 2018. 25 year environment plan. London: Government of the United Kingdom, Department for Environment, Food & Rural Affairs.
- Gruda N, Bisbis M, Tanny J. 2019. Impacts of protected vegetable cultivation on climate change and adaptation strategies for cleaner production – a review. J Cleaner Prod. 225:324–339.
- Hyväluoma J, Hannula M, Arstila K, Wang H, Kulju S, Rasa K. 2018. Effects of pyrolysis temperature on the hydrologically relevant porosity of willow biochar. J Anal Appl Pyrolysis. 134:446–453.
- Jeffery S, Abalos D, Prodana M, Bastos AC, van Groenigen JW, Hungate BA, Verheijen F. 2017. Biochar boosts tropical but not temperate crop yields. Environ Res Lett. 12:5.
- Kern J, Tammeorg P, Shanskiy M, Sakrabani R, Knicker H, Kammann C, Tuhkanen E-M, Smidt G, Prasad M, Tiilikkala K, et al. 2017. Synergistic use of peat and charred material in growing media – an option to reduce the pressure on peatlands? Journal of Environmental Engineering and Landscape Management. 25(2):160–174.
- Kolb E, Hartmann C, Genet P. 2012. Radial force development during root growth measured by photoelasticity. Plant Soil. 360(1-2):19–35.
- Kuzyakov Y, Subbotina I, Chen H, Bogomolova I, Xu X. 2009. Black carbon decomposition and incorporation into soil microbial biomass estimated by 14C labeling. Soil Biol Biochem. 41(2):210–219.
- Laasimer L. 1975. Haruldaste taimekoosluste olukord ja kaitse probleemid eestis. In: Kumari E, Hang V, Mäemets A, editor. Eesti loodusharulduste kaitseks. Tallinn, Estonia: Valgus; p. 224.
- Lehmann J. 2007a. Bio-energy in the black. Front Ecol Environ. 5(7):381–387.
- Lehmann J. 2007b. A handful of carbon. Nature. 447(7141):143–144.
- Lehmann J, Joseph S. 2009. Biochar for environmental management: Science and technology. London, United Kingdom: Earthscan.
- Lehmann J, Joseph S. 2015. Biochar for environmental management: Science and technology (second edition). London: Earthscan.
- Lehmann J, Pereira da Silva J, Steiner C, Nehls T, Zech W, Glaser B. 2003. Nutrient availability and leaching in an archaeological Anthrosol and a Ferralsol of the Central Amazon basin: Fertilizer, manure and charcoal amendments. Plant Soil. 249(2):343–357.
- LIFE programme. 2015. Reduction of CO2 emissions by restoring degraded Peatlands in Northern European Lowland (LIFE15 CCM/DE/000138). Brussels, Belgium: LIFE peat restore, LIFE programme. European Union.
- Long J, Song H, Jun X, Sheng S, Lun-Shi S, Kai X, Yao Y. 2012. Release characteristics of alkali and alkaline earth metallic species during biomass pyrolysis and steam gasification process. Bioresour Technol. 116:278–284.
- Lu S, Zong Y. 2018. Pore structure and environmental serves of biochars derived from different feedstocks and pyrolysis conditions. Environ Sci Pollut Res Int. 25(30):30401–30409.
- Lucas RE, Davis JF. 1961. Relationships between pH values of organic soils and availabilities of 12 plant nutrients. Soil Sci. 92(3):177–182.
- Mendiburu FD. 2015. Agricolae: Statistical procedures for agricultural research. R package version 1.2-3. Vienna: The Comprehensive R Archive Network.
- Nguyen BT, Lehmann J. 2009. Black carbon decomposition under varying water regimes. Org Geochem. 40(8):846–853.
- Noguera D, Barot S, Laossi KR, Cardoso J, Lavelle P, de Carvalho MH. C. 2012. Biochar but not earthworms enhances rice growth through increased protein turnover. Soil Biol Biochem. 52:13–20.
- Ogle D, Wheeler P, Dinno A. 2019. FSA. R Package version 0.8.2. Vienna. The Comprehensive R Archive Network.
- Olmo M, Alburquerque JA, Barrón V, del Campillo MC, Gallardo A, Fuentes M, Villar R. 2014. Wheat growth and yield responses to biochar addition under Mediterranean climate conditions. Biol Fertil Soils. 50(8):1177–1187.
- Olmo M, Villar R, Salazar P, Alburquerque JA. 2015. Changes in soil nutrient availability explain biochar’s impact on wheat root development. Plant Soil. 399(1-2):333–343.
- Ok YS, Uchimiya SM, Chang SX, Bolan N. 2015. Biochar: production, characterization, and applications. Boca Raton (FL): CRC Press.
- Paal J. 1998. Rare and threatened plant communitiesof Estonia. Biodivers Conserv. 7(8):1027–1049.
- Pandit NR, Mulder J, Hale SE, Martinsen V, Schmidt HP, Cornelissen G. 2018. Biochar improves maize growth by alleviation of nutrient stress in a moderately acidic low-input Nepalese soil. Sci Total Environ. 625:1380–1389.
- Pettigrew WT. 2008. Potassium influences on yield and quality production for maize, wheat, soybean and cotton. Physiol Plant. 133(4):670–681.
- Prasad M, Tzortzakis N, McDaniel N. 2018. Chemical characterization of biochar and assessment of the nutrient dynamics by means of preliminary plant growth tests. J Environ Manage. 216:89–95.
- R Core Team. R. 2016. A language and environment for statistical computing. Vienna: R Foundation for Statistical Computing.
- Razaq M, Salahuddin SH, Sher H, Zhang P. 2017. Influence of biochar and nitrogen on fine root morphology, physiology, and chemistry of acer mono. Sci Rep. 7(1):5367.
- Rehrah D, Reddy MR, Novak JM, Bansode RR, Schimmel KA, Yu J, Watts DW, Ahmedna M. 2014. Production and characterization of biochars from agricultural by-products for use in soil quality enhancement. J Anal Appl Pyrolysis. 108:301–309.
- Rhoades JD, et al. 1996. Salinity: electrical conductivity and total dissolved solids. In: Sparks DL, Page AL, Helmke PA, editor. Methods of soil analysis: part 3 chemical methods. Madison (WI): Soil Science Society of America, Inc; p. 53.
- Schmilewski G. 2017. Growing media constituents used in the EU in 2013. Acta Hortic. 1168:85–92.
- Silber A, Bar-Tal A. 2008. Nutrition of substrate-grown plants. In: Raviv M, Lieth JH, editor. Soilless culture theory and practice. Amsterdam: Elsevier Science; p. 291–339.
- Simpson MG. 2010. Evolution and diversity of green and land plants. In: Simpson MG, editor. Plant systematics. 2nd ed. Cambridge (MA): Academic Press; p. 55–72.
- Smider B, Singh B. 2014. Agronomic performance of a high ash biochar in two contrasting soils. Agric Ecosyst Environ. 191:99–107.
- Soil and Plant Analysis Council, Inc. 1992. Handbook on reference methods for soil analysis. Athens: Council on Soil Testing and Plant Analysis, p. 202.
- Someshwar AV. 1996. Wood and combination wood-fired boiler ash characterization. J Environ Qual. 25(5):962–972.
- Speratti AB, Johnson MS, Sousa HM, Dalmagro HJ, Couto EG. 2018. Biochars from local agricultural waste residues contribute to soil quality and plant growth in a cerrado region (Brazil) arenosol. GCB Bioenergy. 10(4):272–286.
- Strack M. 2008. Peatlands and climate change. Jyväskylä, Finland.
- Tan Z, Lin CSK, Ji X, Rainey TJ. 2017. Returning biochar to fields: A review. Appl Soil Ecol. 116:1–11.
- Tian Y, Sun X, Li S, Wang H, Wang L, Cao J, Zhang L. 2012. Biochar made from green waste as peat substitute in growth media for calathea rotundifola cv. fasciata. Sci Hortic. 143:15–18.
- Tripathi P, Lo Leggio L, Mansfeld J, Ulbrich-Hofmann R, Kayastha AM. 2007. Alpha-amylase from mung beans (vigna radiata)–correlation of biochemical properties and tertiary structure by homology modelling. Phytochemistry. 68(12):1623–1631.
- Tukey JW. 1977. Exploratory data analysis. Reading (MA). Addison-Wesley Publishing Company.
- Ueno M, Kaeamitsu Y, Komiya Y, Sun L. 2007. Carbonisation and gasification of bagasse for effective utilisation of sugarcane biomass. 26th Congress of the International Society of Sugar Cane Technologists. Réduit, Mauritius: International Society of Sugar Cane Technologists.
- U.S. Geological Survey. 2020. Mineral commodity summaries 2020.
- Uzoma KC, Inoue M, Andry H, Zahoor A, Nishihara E. 2011. Influence of biochar application on sandy soil hydraulic properties and nutrient retention. J Food Agric Environ. 9:1137–1143.
- Vanek SJ, Lehmann J. 2014. Phosphorus availability to beans via interactions between mycorrhizas and biochar. Plant Soil. 395(1-2):105–123.
- Vassilev SV, Baxter D, Andersen LK, Vassileva CG. 2010. An overview of the chemical composition of biomass. Fuel. 89(5):913–933.
- Vassilev SV, Baxter D, Andersen LK, Vassileva CG. 2013. An overview of the composition and application of biomass ash. Part 1. Phase–mineral and chemical composition and classification. Fuel. 105:40–76.
- Vaughn SF, Kenar JA, Eller FJ, Moser BR, Jackson MA, Peterson SC. 2015. Physical and chemical characterization of biochars produced from coppiced wood of thirteen tree species for use in horticultural substrates. Ind Crops Prod. 66:44–51.
- Videgain-Marco M, Marco-Montori P, Martí-Dalmau C, Jaizme-Vega M, Manyà-Cervelló JJ, García-Ramos FJ. 2020. Effects of biochar application in a sorghum crop under greenhouse conditions: growth parameters and physicochemical fertility. Agronomy. 10(1).
- Weber K, Quicker P. 2018. Properties of biochar. Fuel. 217:240–261.
- Werdin J, Fletcher TD, Rayner JP, Williams NSG, Farrell C. 2020. Biochar made from low density wood has greater plant available water than biochar made from high density wood. Sci Total Environ. 705:135856.
- Xiang Y, Deng Q, Duan H, Guo Y. 2017. Effects of biochar application on root traits: a meta-analysis. GCB Bioenergy. 9(10):1563–1572.
- Ye L, Camps-Arbestain M, Shen Q, Lehmann J, Singh B, Sabir M, Condron LM. 2019. Biochar effects on crop yields with and without fertilizer: A meta-analysis of field studies using separate controls. Soil Use Manag. 36(1):2–18.
- Zhang J, You C. 2013. Water holding capacity and absorption properties of wood chars. Energy Fuels. 27(5):2643–2648.
- Zhu Q, Kong L, Xie F, Zhang H, Wang H, Ao X. 2018. Effects of biochar on seedling root growth of soybeans. Chil J Agric Res. 78(4):549–558.
- Zulfiqar F, Younis A, Chen J. 2019. Biochar or biochar-compost amendment to a peat-based substrate improves growth of Syngonium podophyllum. Agronomy. 9:8.