
 ?Mathematical formulae have been encoded as MathML and are displayed in this HTML version using MathJax in order to improve their display. Uncheck the box to turn MathJax off. This feature requires Javascript. Click on a formula to zoom.
ABSTRACT
Effective and practical measurement methods for assessing field inoculation experiments are needed to identify inoculants that could improve lucerne establishment. In this study, assessment potential of different existing measurement methods (plant height, Dualex 4 Scientific leaf-clip meter, GreenSeeker handheld crop sensor, drone-acquired orthomosaic calculation, yield, nutrient analysis and nodule assessment) were compared across 12 inoculation treatments applied to lucerne (Medicago sativa L.) at 3 sites. F-values were used to compare the potential of different methods to separate inoculation treatments. The handheld GreenSeeker measuring normalised difference vegetation index (NDVI) showed the greatest potential for separating inoculation treatments in fields where lucerne had not previously been cultivated, followed by visible atmospherically resistant index (VARI) and green-red vegetation index (GRVI) from drone-acquired orthomosaics. These methods are non-destructive, low cost, require low labour input, fast, and do not require sample preparation, and thus are efficient measurement methods for disaggregating treatments in field inoculation experiments.
Introduction
Lucerne (Medicago sativa L.) is a perennial forage legume that originated from southwestern Asia (Sangra et al. Citation2019). Due to its high protein concentration and yield, lucerne has long been recognised as an important forage crop for ruminant feeding worldwide (Sousa et al. Citation2020). Lucerne may provide various ecological advantages to multi-cropping systems mainly because of its atmospheric nitrogen (N) fixation (Bell et al. Citation2017). Lucerne is persistent and drought tolerant due to its deep root system, which is an important characteristic in variable and drier climates, and its cold tolerance also makes it an ideal forage crop for high latitude areas (Picasso et al. Citation2019). In Sweden, forage is the most important crop and dominates agricultural land use (Trubins Citation2013). As a feasible alternative to red clover (the most commonly grown forage legume), lucerne is increasingly grown in mixed stands with grass. However, the actual lucerne cultivation area is still far below its potential, due to establishment issues (af Geijersstam and Frankow-Lindberg Citation2017).
The benefits of lucerne can only be realised if it is successfully established (Li et al. Citation2019). Lucerne has specific environmental requirements for growth. It is sensitive to mildly acid soils, low macro nutrients (particularly P and Ca), low micro nutrients (particularly B, Mo and Fe, but also Cu, Mn, Zn, and Co), and poor drainage (Bonilla and Bolanos Citation2009; Xu et al. Citation2016). Seed inoculation with species-specific Rhizobia (mainly Sinorhizobium meliloti) to form nodules and result in symbiotic N fixation, is essential for soils without previous lucerne history (Berenji et al. Citation2017). Therefore, evaluations of different inoculation techniques, and comparisons of the effectiveness of different measurement methods for assessing field inoculation experiments are important.
Field inoculation experiments are ideally evaluated by nodule assessment, yield determination and nutrient analysis (Wigley et al. Citation2018; Jauregui et al., Citation2019). However, these measurements are labour intensive, costly and destructive. Various non-destructive methods have been used to assess forage yield and quality (Simili et al. Citation2019; Zhou et al. Citation2019). The overall purpose of our research was to identify inoculation treatments that could lead to improved lucerne establishment. As part of this process, in the first year of a series of field experiments, we tested a range of measurement methods to ascertain which would be worthwhile data to continue to collect. Therefore, the objective of this study was to identify effective and practical methods for comparing treatments in field inoculation experiments.
Materials and methods
Site description and soil characteristics
The experiment was conducted at three sites in southern Sweden: Svalöv (55°55ʹ20.06ʺN, 13°7ʹ32.24ʺE), Tenhult (57°44ʹ0.87ʺN, 14°17ʹ10.31ʺE) and Rådde (57°36ʹ31.73ʺN, 13°15ʹ43.35ʺE). At Tenhult and Rådde, lucerne had not previously been cultivated in the plot location for at least seven years. Svalöv was a control site, where lucerne was known to have been grown recently. The annual average rainfall of Svalöv, Tenhult and Rådde are 707, 620 and 1026 mm, respectively, while the monthly average temperatures range from 1.2 to 18.9, −2.4 to 16.9 and −2.1 to 17.2°C, respectively. The soil at each site was classified as loamy sand. Before sowing, the surface layer (0–15 cm) of each soil was sampled and sent to Eurofins Agro Testing (Kristianstad, Sweden) for basic physiochemical properties analysis. Soil pH was measured in a CaCl2 solution. Available P and K were extracted by Milli-Q water at soil/water ratios 1:2 and 1:1.5, respectively ().
Table 1. Basic physicochemical properties of the soils (0–15 cm) in the experiment.
Plant material and culture
The lucerne cultivar SW Nexus was selected for this study. It is the Swedish lucerne variety trial reference cultivar and is commonly used in Sweden.
Experiment design and treatments
The experiment was conducted in a randomised complete block design with three replicates. The sowing plot sizes were 9.60 × 1.13 m at Svalöv, 15.4 × 1.75 m at Tenhult and 12.0 × 1.75 m at Rådde. The adjacent plots were separated by a buffer zone (0.5 m). After field preparation, Yara PK 11–21 (P:K:S = 11:21:1.5) was applied at 400, 250 and 225 kg ha−1 as basal fertiliser at Svalöv, Tenhult and Rådde on May 2nd, June 24th and June 19th, respectively, according to soil tests and standard recommendations.
The experimental treatments included one control (T1) and 11 inoculation treatments (T2–T12). Details of individual treatments are not presented here, as they are not the focus of this paper, and require more seasons of testing before conclusions are made. Lucerne seeds were sown as a monoculture (without a cover crop) on June 27th, 25th and 19th, 2019 at Svalöv, Tenhult and Rådde, respectively, with ten rows per plot (nine at Svalöv). Inoculants of individual treatment were prepared according to manufacturers’ instructions. Plots were not irrigated, following the normal practice for forages in Sweden. At Tenhult, commercial herbicides Basagran SG 1.15 L ha−1, Superolja 0.5 L ha−1 and Gratil 75 WG 13 g ha−1 were sprayed on 8 August, 2019. At Svalöv, lucerne was cut on 29 August, 2019 to control weeds. At Rådde, large weeds were removed by hand when necessary.
Measurements
The measurements reported in this paper were taken in late September in the establishment year. An autumn harvest is generally only taken in the establishment year if there is sufficient biomass. Most measurements at Tenhult and Rådde were taken shortly before the harvest, whereas at Svalöv there was no autumn harvest.
Destructive measurements
Yield
Lucerne was harvested to a stubble height of approximately 8 cm on 25 September and 1 October 2019 at Tenhult and Rådde, respectively. The harvest areas were 11.0 and 10.4 m2 at Tenhult and Rådde, respectively. The lucerne at Svalöv was not harvested in the establishment year, as biomass was lower due to an earlier cut to remove weeds. Biomass samples were collected from each plot and dried at 105°C until a constant weight was reached, to determine the dry matter content. Additional samples were dried at 65°C and stored for further nutrient analysis.
Nodule assessment
One row of lucerne per plot was dug using a straight spade, to remove a section of soil with 30-cm length, 15-cm width, and 20-cm depth. The root samples were washed carefully with water to remove the attached soil. Nodule number, colour and position were assessed according to the indices proposed by Rice et al. (Citation1977) with some modifications to make the methods usable on a group of plants, rather than assessing each plant individually (). The nodule assessment score is the sum of these three indices. After the assessment, the root samples were dried at 65°C for nutrient analysis.
Table 2. Nodule characteristics and criteria used in nodulation assessment.
Nutrient analysis
The samples dried at 65°C (both shoot and root) were milled to 1-mm particle size, and the total carbon and nitrogen contents (TC and TN) were determined using an elemental analyser (TurMac, LECO, Saint Joseph, USA). The C:N ratio was calculated by the formula:
(1)
(1)
Nitrogen nutrition index was calculated as the ratio between actual N (TN) and critical N concentration (Nc) in shoot samples. Critical N concentration was calculated with the parameters of the dilution curve for lucerne determined by Gastal and Lemaire (Citation1997). To determine Nc, the equation for total shoot biomass (W) > 1.0 t ha−1 was used.
(2)
(2)
Non-destructive measurements
Plant height
A small quadrat (25 × 25 cm) was randomly placed within each plot. The tallest plant was identified and measured from the ground to the top point of the stretched leaf. Three measurements were made in the middle and at both ends of each plot.
Chlorophyll content index (CCI) and nitrogen balance index (NBI)
Three individual healthy plants in the middle and at both ends of each plot were selected for CCI and NBI determination using a Dualex 4 Scientific leaf-clip meter (Dx4, FORCE-A, Orsay, France). The determination was performed with the adaxial leaf side facing the light sources to mitigate for leaf heterogeneity.
Normalised difference vegetation index (NDVI)
A GreenSeeker handheld active light crop sensor (Trimble, Sunnyvale, USA) was used for NDVI measurement. The measurement was taken from the beginning to the end of each plot at approximately 1 m above the ground. NDVI is defined as follows:
(3)
(3) where ρnir and ρred are reflectance of near-infrared and visible red, respectively.
Visible atmospherically resistant index (VARI), green-red vegetation index (GRVI) and green leaf index (GLI)
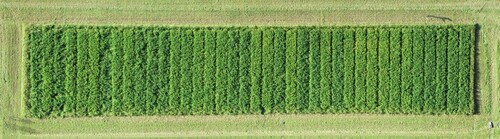
A Phantom 4 FC6310 (DJI, Shenzhen, China) was used to acquire aerial images of the experiments at each site. The drone has a sensor size of 12.4 MP, focal length of 3.6 mm, and field of view of 94 degrees. The drone was flown before harvest, according to predefined flight plans and using Pix4Dcapture (Pix4D, Prilly, Switzerland) at 30 metres above ground with a resultant resolution of 0.79 cm px−1. Flights were conducted in stable light conditions, within 3 h of solar noon. There was full canopy closure on all plots when drones were flown. The images were stored as JPEG files (). Orthomosaics and derived VARI, GRVI and GLI were computed using Solvi (Solvi, Gothenburg, Sweden). These particular vegetation indices (VIs) were used because of the focus on using tools included in a commercial software package that is accessible to non-experts in drone image processing. Zonal statistics were performed after manual delineation of the plot borders with QGIS 3.14.16 (QGIS Geographic Information System, QGIS Association, http://www.qgis.org). A buffer zone of approximately 20 cm around each plot was applied to avoid edge effects.
Figure 1. An aerial view (30-m altitude) of the experiment at Rådde field station in 2019. The orthomosaic was constructed from numerous images captured with a drone, and processed using tools in Solvi. Different plots appear different shades of green.
VARI, GRVI and GLI are defined as follows:
(4)
(4)
(5)
(5)
(6)
(6) where bgreen, bred and bblue are digital bands of green, red and blue, respectively.
Statistical analysis
Treatment results are means of three replicates. The statistical analyses were conducted separately for each site using Proc Glimmix in SAS (version 9.4, SAS Institute Inc., Cray, USA). Differences among treatments were determined using Tukey’s test at a significance level of P < 0.05. The corresponding F-values were used to compare the abilities of measurement methods to separate the treatments at all sites. Graphical visualisation was generated with OriginPro (version 2020, OriginLab, Northampton, USA). The means of measurement methods with each treatment were standardised by variable and subject to principal component analysis (PCA) carried out using the ‘Principal Component Analysis’ app in OriginPro.
Results
Destructive measurements
Yield
For the establishment year harvest, lucerne dry matter yield showed significant variation among different treatments (). At Tenhult, seven treatments had higher yield than the control (T1) (P < 0.05), but none of the inoculation treatments were significantly different from each other. At Rådde, four treatments achieved higher yield than the control (P < 0.05). Among all treatments, the two best (T11 and T12) yielded higher than the worst one (T2) (P < 0.05) (). As previously mentioned, lucerne at Svalöv was not harvested in the establishment year (2019).
Table 3. Destructive measurement of lucerne in response to different treatments, at three sites in southern Sweden.
Nodule assessment
Nodule number, colour and position were determined in the autumn of the establishment year. There were no significant differences at either Svalöv or Tenhult. At Rådde, two treatments (T5 and T12) had higher nodule score than control (P < 0.05), but there were no significant differences between any inoculation treatments ().
Total nitrogen (TN)
At Tenhult, eight inoculation treatments had greater shoot TN than the control (P < 0.05), and two inoculation treatments (T4 and T12) had greater root TN than the control (P < 0.05), but none of them were significantly different from each other. At Rådde, five inoculation treatments had greater shoot TN than the control (P < 0.05), and four inoculation treatments had greater root TN than the control (P < 0.05), and there were also some significant variations between different inoculation treatments ().
C:N ratio
The highest C:N ratio was observed for the control, regardless of plant part or site. At Tenhult, all treatments had lower shoot C:N ratio than the control (P < 0.05), and three treatments had a root C:N lower than the control (P < 0.05). There was no significant difference among these inoculations and/or micronutrient treatments in either plant part (). At Rådde, six treatments had a shoot C:N ratio lower than control (P < 0.05), and five treatments had a lower C:N ratio than the three highest ones (P < 0.05). One inoculation treatment at Rådde had a lower root C:N ratio than the two highest inoculation treatments (P < 0.05) ().
NNI
At Tenhult, all inoculation treatments had greater NNI than the control (P < 0.05). At Rådde, greater NNI were observed in three inoculation treatments, compared to the control and four inoculation treatments (T3, T8, T9 and T10) (P < 0.05) (). Lucerne grown at Rådde has lower NNI than at Tenhult, which is attributed to the dilution effect caused by higher yield.
Non-destructive measurements
Plant height
The difference in plant height between treatments was not significant for any site. Lucerne grown at Rådde was taller than at Svalöv and Tenhult, because both Svalöv and Tenhult had an earlier cut to help control weeds ().
Table 4. Non-destructive measurement of lucerne in response to different treatments, at three sites in southern Sweden.
Chlorophyll indices
Significant variation in CCI among treatments was observed at Tenhult and Rådde but not at Svalöv. At Tenhult, all but one treatment (T7) obtained greater CCI than the control (P < 0.05); however, none of the inoculation treatments was significantly different from each other. At Rådde, only one treatment (T12) had greater CCI than the control (P < 0.05), and there were no significant differences among any inoculation treatments ().
At Rådde, the highest NBI was observed in the same treatment with the greatest CCI (T12), which was higher than control and five other inoculation treatments (P < 0.05). No significant differences among treatments were found at Svalöv or Tenhult ().
Greenseeker NDVI
There were no significant differences in NDVI among treatments at Svalöv. At Tenhult, all but two inoculation treatments (T9 and T10) had greater NDVI than the control (P < 0.05), and none of the 11 inoculation treatments were significantly different from each other. At Rådde, NDVI for all inoculation treatments was greater than the control (P < 0.05), and six inoculation treatments had greater NDVI than others (P < 0.05) ().
Drone-acquired orthomosaic VIs
Inoculation treatments significantly increased several VIs in the fields where lucerne had not previously been cultivated. At Tenhult, all but one inoculation treatment (T9) had greater VARI and GRVI than the control (P < 0.05). At Rådde, the variations among treatments were more complex. For VARI, seven inoculation treatments were greater than the control (P < 0.05), while four of them were greater than other inoculation treatments (P < 0.05). For GRVI, five inoculation treatments were greater than the control (P < 0.05), while three of them were greater than others (P < 0.05). In contrast to other tested VIs, the variation in GLI among treatments at all sites was negligible ().
Comparison of different measurement methods
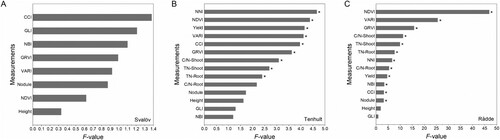
To compare the potential of separating treatments in field inoculation experiments, the F-values of all tested measurements were compared. The F-value indicates whether the expected values of a quantitative variable within two or more pre-defined treatments differ from each other. It does not, however, specify which pairs or groups of treatments are different from each other. The null hypothesis is that there is no effect of treatment on the mean value of a measured quantitative variable. A higher F-value indicates that the null hypothesis is more likely to be rejected, in favour of the alternative hypothesis that not all treatment means are the same. Because all sites had the same treatments and number of replicates, the F-values can be used to make comparisons between measurement methods and sites. At Tenhult, significant differences between treatments were detected in eight measurement methods i.e. NNI, NDVI, yield, VARI, CCI, GRVI, shoot C:N ratio, shoot TN and root TN ((B)). At Rådde, in addition, there were significant results for root C:N ratio, NBI, and nodule assessment score ((C)). In contrast, there were no significant differences for any measurement among treatments at Svalöv, and the F-values of all measurements were lower than for Tenhult, and much lower than for Rådde ((A)).
Figure 2. F-values of different measurement methods at different locations (A. Svalöv, B. Tenhult, C. Rådde). Abbreviations: CCI: chlorophyll content index using Dualex 4 Scientific leaf-clip meter (Dx4); C/N: carbon nitrogen ratio; GLI: green leaf index from drone-acquired orthomosaics; GRVI: green-red vegetation index from drone-acquired orthomosaics; Height: plant height; NBI: nitrogen balance index using Dx4; NDVI: normalised difference vegetation index using GreenSeeker handheld crop sensor; NNI: nitrogen nutrition index; Nodule: nodule assessment score; TN: total nitrogen content; VARI: visible atmospherically resistant index from drone-acquired orthomosaics. * Indicate significant treatment effect at P < 0.05 according to Tukey’s test.
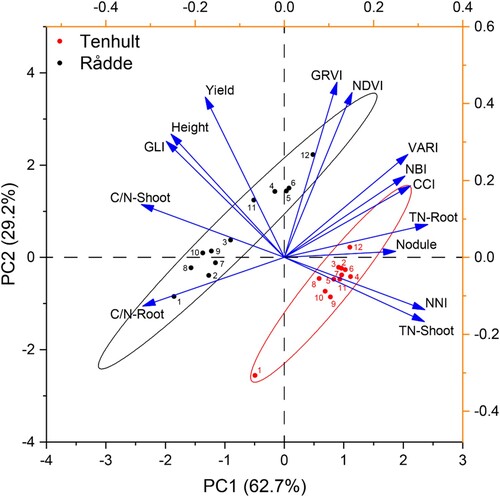
Principal component analysis (PCA) was used to further clarify the relationships among tested measurement methods (). The first two components accounted for 91.9% of the total variance. The cosine of the angle between two eigenvectors estimates the correlation between them, thus variables that are clustered are positively correlated. As shown in the biplot, plant height, yield and C:N ratio, which are associated with biomass, were clustered. GLI was also clustered with the yield variables, however the F-values for GLI were very low, and so this result may not be important. Some variables associated with greenness (CCI, VARI, TN, NNI and nodule assessment) were clustered. The NDVI and GRVI lay in the middle between the biomass and the greenness clusters, indicating that they are correlated with both. The dots in show the spread of the treatments in relation to the variables. The markers of Rådde treatments are more dispersed, suggesting that there were more differences between treatments at Rådde than at Tenhult. Moreover, the markers of Rådde treatments are further along the biomass vectors, whereas the markers of Tenhult are interspersed with greenness vectors, indicating that Rådde lucerne yielded higher, while the lucerne at Tenhult had higher N content, which is consistent with the ANOVA analysis ( and ). In addition, the PCA shows the separation of the control treatment for both sites in the lower left quadrant, reflecting lower biomass and greenness.
Figure 3. Biplot for sample means and variables. Sample points are means of three replicates, treatments are represented by numbers and sites (Tenhult, Rådde) are signified by different colours. Abbreviations: CCI: chlorophyll content index using Dualex 4 Scientific leaf-clip meter (Dx4); C/N: carbon nitrogen ratio; GLI: green leaf index from drone-acquired orthomosaics; GRVI: green-red vegetation index from drone-acquired orthomosaics; Height: plant height; NBI: nitrogen balance index using Dx4; NDVI: normalised difference vegetation index using GreenSeeker handheld crop sensor; NNI: nitrogen nutrition index; Nodule, nodule assessment score; TN: total nitrogen content; VARI: visible atmospherically resistant index from drone-acquired orthomosaics.
Discussion
Destructive measurement methods
Yield is the most intuitive characteristic to represent the growth and development of forage crops (Ben-Laouane et al. Citation2021). For areas in Sweden where lucerne can be grown, it has the highest production potential among all forage legumes, and where it is successfully established it also persists well (Misar et al. Citation2015; Berg et al. Citation2018). In this study, at the sites where lucerne had not previously been cultivated, inoculated lucerne yielded higher than the control (T1), which is consistent with literature (Daur et al. Citation2018; Jauregui et al., 2019), confirming that Rhizobia inoculation is essential for sites without lucerne cultivation history. Lucerne at Svalöv was not harvested in the establishment year, as biomass was lower due to an earlier cut to remove weeds, so there are no yield results for Svalöv ( and (A)).
In our present study, treatments were effectively separated by yield at Tenhult and Rådde. Whole plot yields are a representative measurement for assessing field inoculation experiments. However, individual plot yields can be costly in terms of the equipment needed (for example, specialized experimental plot forage harvesters). Moreover, plants may grow normally until the soil N is depleted, so comparing inoculation methods only on yield may give a false impression. Anecdotally, this is what happened at Rådde. There were no obvious differences between plots until late in the establishment year. For this reason, there were no large differences in yield, and consequently other measurements had greater F-values (). In addition, lucerne may not be harvested in the establishment year (e.g. Svalöv in this study), depending on a variety of factors. As a consequence, additional measurement methods are preferable for assessing field inoculation experiments.
Rhizobia are essential for legumes to nodulate, thereby fixing atmospheric N (Peoples et al. Citation2012). If sufficient quantities of the correct Rhizobia are not present, either on the seed or in the soil, lucerne growth will be reduced through nitrogen deficiency (Boivin and Lepetit Citation2020). Root nodulation is one of the important indicators to evaluate the success of inoculation, but it is a method that is destructive, labour-intensive and time-consuming. It was not feasible for the researchers to increase the sampling effort, due to the time needed to collect the samples, wash roots, and peform the visual assessments. With the sampling method that was used (digging one area of lucerne per plot), it was difficult for nodule assessment to represent the whole plot. It is possible that more intensive sampling efforts could yield better results, but the cost would be prohibitive for many research projects, and the sampling would still represent only a small percentage of the plants in a specific part of the plot. In this study, a significant effect was observed in the nodulation score at Rådde but not at Tenhult. Thus, at Tenhult, nodulation assessment was not able to distinguish between different treatments, whereas other indirect indicators were able to distinguish between different treatments.
Lucerne is a forage with high nutritional value and favourable composition for ruminant production (Atumo and Jones Citation2021). Nitrogen concentration is a core quality parameter of lucerne (Defez et al. Citation2019). In our study, inoculation treatments significantly increased TN and NNI but decreased C:N ratio in lucerne. Abadi et al. (Citation2020) obtained similar results when inoculating lucerne with Rhizobium meliloti and R. leguminosarum, which was attributed to the enhanced atmospheric N fixation caused by nodulation (Peoples et al. Citation2012). Plant elemental analyses require chemical analysis in a laboratory or near infra-red spectroscopy (NIRS) analysis, both of which are expensive. Both methods involve intensive sample preparation procedures (drying and grinding). Similar to nodule assessment, TN, C:N ratio and NNI measurements are also destructive and may not be representative of the whole plot (particularly root nutrient measurements). In this study the shoot TN, C:N ratio and NNI were a good representation of the whole plot, due to the sample collection method, whereas the root samples were taken from a small sample. The significant positive correlations between shoot TN and NNI (0.990) and the significant negative correlations between TN and C:N ratio (−0.989 and −0.986 in shoot and root, respectively) (Table S1) suggest that although NNI and C:N ratio had slightly higher F-values (), TN analysis can be performed instead of NNI and C:N ratio, due to increased simplicity and reduced time and cost. The results also confirm that shoot TN is more useful than root TN, and likely more representative of the whole plot. There were no TN, C:N ratio or NNI results for Svalöv, because lucerne was not harvested in the establishment year ( and (A)).
Non-destructive measurement methods
As a proxy for yield, plant height is another parameter that was measured; however, it was not significantly different among treatments at any site, regardless of cultivation history. In this study, we used three measurements per plot. It is possible to do more intensive sampling, however, there is a balance between the number of subsamples and the time required for data collection. Height is likely to suffer from the same issue of yield in that it does not represent differences in plant colour or quality. Mills et al. (Citation2016) reported an R2 = 0.52–0.63 when studying the relationship between dry matter yield and plant height of lucerne in different seasons, which indicates a high variability between lucerne dry matter yield and plant height. Thus, there are limitations for using plant height as a proxy for biomass.
In this study, Dx 4 (Cerovic et al. Citation2012) was used to determine the CCI and NBI in lucerne at the same leaf spot. The non-destructively measured leaf CCI is an indicator of N nutrition of crops (Yu et al. Citation2010; Tremblay et al. Citation2012), and NBI is more of an indicator of C/N allocation changes (Cartelat et al. Citation2005; Liu et al. Citation2021). Successful nodulation enhances lucerne N uptake efficiency thereby improving the photosynthesis process (Mouradi et al. Citation2016). In our study, significantly positive correlations were found between CCI and NBI with shoot TN, root TN and nodule score (Table S1), suggesting that the non-destructive leaf-clip meter may be used as an alternative to destructive and intricate measurements such as chemical analysis and nodule assessment. In this study, only three individual plants from each plot were measured to represent the whole plot, and the method may have yielded better results if the sampling was more intensive. Nevertheless, there are inherent limitations of the method. Each reading represents a single leaf on a single plant, and there can be large variability between readings. Thus, these two parameters (CCI and NBI) may be unrepresentative for assessing field inoculation experiments. NBI did not have a high F-value at any of the sites. At Tenhult, CCI had quite a high F-value, whereas at Rådde, there were clearly more effective measurement methods than CCI.
NDVI is a widely used indicator of plant biomass and greenness that uses light reflectance in the red (656 nm) and infrared (774 nm) bands (Rouse et al. Citation1974). The handheld GreenSeeker is an active light source NDVI measuring device. Active light sensors are less sensitive to changing light conditions (e.g. solar illumination angle or the passage of clouds), making them robust tools to compare vegetation across locations, dates and times. Owing to its non-destructive, low cost, low labour input, short data collection time, without sample preparation or operational experience requirement, it is widely used in the field to assess different crops (Maselli et al. Citation2020; Phyu et al. Citation2020; Vannoppen and Gobin Citation2021). Moreover, in our experiments, the GreenSeeker was used from one length of the plot to the other, making it representative of the whole plot. In our study, NDVI was significantly different among treatments and obtained the highest F-value at both Tenhult and Rådde ( and ). Furthermore, its position in the biplot confirmed that it takes into account both biomass and greenness in assessing field inoculation experiments (). Therefore, NDVI appears to be an efficient measurement for separating inoculation treatments in the fields without lucerne cultivation history.
There are many different VIs available other than NDVI – VARI, GRVI and GLI are three easily acquired and widely used VIs that require visible band data only. Hence, a drone with a consumer camera is enough for capturing aerial images and create orthomosaics, from which all these VIs can be derived (Eng et al. Citation2019). Similar to NDVI, drone-acquired orthomosaics are non-destructive, require low labour input, and do not need sample preparation. In addition, scanning the whole plot makes these indices spatially representative. Orthomosaics can be processed quickly and easily in a commercially available service such as Solvi, which could be used by a researcher, a breeder or a field manager that is not an expert in remote sensing. However, drone flying and image analysis require some expertise and experience to operate, and the results also depend on weather conditions. In addition to the RGB camera used in this study, it is also possible to use more expensive multispectral cameras, which would enable the calculation of NDVI and other VIs but would also increase the expertise required to process the images in a consistent way.
In our study, treatments at Tenhult and Rådde were well separated by VARI and GRVI, indicating that they are relevant measures for assessing field inoculation experiments. Due to the addition of blue-band data in its calculation, VARI may estimate the fraction of vegetation with minimal sensitivity to atmospheric effects (Schneider et al. Citation2008; Mokarram et al. Citation2015, Citation2016). With high F-values at both sites without previous lucerne cultivation (Tenhult and Rådde here), VARI was overall the second-best method for assessing our field inoculation experiments.
GRVI was designed to maximise its sensitivity to greenness. Because of this, GRVI is an effective and simple approach for detecting vegetation phenology as well as subtle disturbances in grasslands (Motohka et al. Citation2010). VARI and GRVI, similar to all visible light-based VIs, are directly related to the pigment content of leaves, especially chlorophyll (Vina et al. Citation2004). This further explains the significant positive correlations between these two indices and the CCI in lucerne leaves. The F-values for GRVI were slightly lower than for VARI at all sites. In our study, no significant differences in GLI among treatments were found at any site. This is probably due to the fact that GLI minimizes the influence of the blue band. Indeed, this part of the visible light has been reported to be a proxy for the assessment of nitrogen canopy content for various crops (Lebourgeois et al. Citation2012; Wang et al. Citation2012, Citation2014). In the case of lucerne, the nitrogen canopy content strongly depends on the success of nodulation, however these differences are not detected by GLI.
Conclusions
This study found that GreenSeeker-measured NDVI was overall the best method for separating inoculation treatments in fields without a history of lucerne cultivation. The VIs VARI and GRVI calculated from drone-acquired orthomosaics were also efficient indirect measurement methods. Measurements like NDVI and GRVI are able to capture differences between plots that reflect differences in biomass and colour, and thus may be used to more precisely separate treatments, particularly when combined with other measurements like dry matter yield. These measurement methods have a multitude of advantages such as being representative, non-destructive, low-cost, low labour input, rapid, and without requiring sample preparation. Therefore, these methods should be considered by researchers undertaking such field experiments, particularly when screening a large number of treatments.
Supplemental Material
Download MS Word (21.8 KB)Acknowledgements
We thank the field station staff for their efforts in managing the field experiments and collecting data, and Dr. Ahmed Mukhtar for his assistance in data collection. Lin Tang acknowledges the postdoctoral scholarship supported by Carl Tryggers Stiftelse (CTS 19:275).
Disclosure statement
No potential conflict of interest was reported by the author(s).
Additional information
Funding
Notes on contributors
Lin Tang
Lin Tang is a postdoctor in Crop Science at the Department of Agricultural Research for Northern Sweden, Swedish University of Agricultural Sciences (SLU). Her current research is focused on improved management strategies for the establishment of lucerne in northern Sweden.
Julien Morel
Julien Morel is a researcher at the Department of Agricultural Research for Northern Sweden, SLU.
Magnus Halling
Magnus Halling is a professor at the Department of Crop Production Ecology, SLU.
Linda Öhlund
Linda Öhlund is a plant breeder at Lantmännen.
David Parsons
David Parsons is a professor in Crop Science at the Department of Agricultural Research for Northern Sweden, SLU. His current research focuses on combining agronomy, modeling and remote sensing of crops.
References
- Abadi HSK, Abadi ARV, Daneshian J, Abad HHS, Baghizadeh A. 2020. Evaluation of meliloti rhizobium activity effectiveness on quantitative properties of alfalfa by bacterial inoculation in the south-east of Iran. Nexo Rev Cient. 33:725–736. doi:10.5377/nexo.v33i02.10804.
- af Geijersstam L, Frankow-Lindberg B. 2017. Fröblandningar med blålusern – närproducerat protein i ett torrare klimat (in Vallkonferens.). Uppsala: Sveriges lantbruksuniversitet.
- Atumo TT, Jones CS. 2021. Varietal differences in yield and nutritional quality of alfalfa (Medicago sativa) accessions during 20 months after planting in Ethiopia. Trop Grassl-Forrajes Trop. 9:89–96. doi:10.17138/TGFT(9)89-96.
- Bell LW, Lawrence J, Johnson B, Peoples MB. 2017. New ley legumes increase nitrogen fixation and availability and grain crop yields in subtropical cropping systems. Crop Pasture Sci. 68:11–26. doi:10.1071/CP16248.
- Ben-Laouane R, Ait-El-Mokhtar M, Anli M, Boutasknit A, Ait Rahou Y, Raklami A, Oufdou K, Wahbi S, Meddich A. 2021. Green compost combined with mycorrhizae and rhizobia: a strategy for improving alfalfa growth and yield under field conditions. Gesunde Pflanzen. 73:193–207. doi:10.1007/s10343-020-00537-z.
- Berenji S, Moot DJ, Moir JL, Ridgway H, Rafat A. 2017. Dry matter yield, root traits, and nodule occupancy of lucerne and Caucasian clover when grown in acidic soil with high aluminium concentrations. Plant Soil. 416:227–241. doi:10.1007/s11104-017-3203-3.
- Berg WK, Lissbrant S, Cunningham SM, Brouder SM, Volenec JJ. 2018. Phosphorus and potassium effects on taproot C and N reserve pools and long-term persistence of alfalfa (Medicago sativa L.). Plant Sci. 272:301–308. doi:10.1016/j.plantsci.2018.02.026.
- Boivin S, Lepetit M. 2020. Partner preference in the legume-rhizobia symbiosis and impact on legume inoculation strategies. Regul Nitrogen-Fixing Symbioses Legumes. 94:323–348. doi:10.1016/bs.abr.2019.09.016.
- Bonilla I, Bolanos L. 2009. Mineral nutrition for legume-rhizobia symbiosis: B, Ca, N, P, S, K, Fe, Mo, Co, and Ni: a review. Org Farming, Pest Control Remediat Soil Pollut. 1:253–274. doi:10.1007/978-1-4020-9654-9_13.
- Cartelat A, Cerovic ZG, Goulas Y, Meyer S, Lelarge C, Prioul JL, Barbottin A, Jeuffroy MH, Gate P, Agati G, Moya I. 2005. Optically assessed contents of leaf polyphenolics and chlorophyll as indicators of nitrogen deficiency in wheat (Triticum aestivum L). Field Crops Res. 91:35–49. doi:10.1016/j.fcr.2004.05.002.
- Cerovic ZG, Masdoumier G, Ben Ghozlen N, Latouche G. 2012. A new optical leaf-clip meter for simultaneous non-destructive assessment of leaf chlorophyll and epidermal flavonoids. Physiol Plant. 146:251–260. doi:10.1111/j.1399-3054.2012.01639.x.
- Daur I, Saad MM, Eida AA, Ahmad S, Shah ZH, Ihsan MZ, Muhammad Y, Sohrab SS, Hirt H. 2018. Boosting alfalfa (Medicago sativa L.) production with rhizobacteria from various plants in Saudi Arabia. Front Microbiol. 9:477. doi:10.3389/fmicb.2018.00477.
- Defez R, Andreozzi A, Romano S, Pocsfalvi G, Fiume I, Esposito R, Angelini C, Bianco C. 2019. Bacterial IAA-delivery into Medicago root nodules triggers a balanced stimulation of C and N metabolism leading to a biomass increase. Microorganisms. 7:403. doi:10.3390/microorganisms7100403.
- Eng LS, Ismail R, Hashim W, Baharum A. 2019. The use of VARI, GLI, and ViGreen formulas in detecting vegetation in aerial images. Int J Technol. 10:1385–1394. doi:10.14716/ijtech.v10i7.3275.
- Gastal F, Lemaire G. 1997. N uptake and distribution in plant canopies. Diagn Nitrogen Dtatus Crops. 3–43. doi:10.1007/978-3-642-60684-7_1.
- Jauregui JM, Mills A, Black DBS, Wigley K, Ridgway HJ, Moot DJ. 2019. Yield components of lucerne were affected by sowing dates and inoculation treatments. Eur J Agron. 103:1–12. doi:10.1016/j.eja.2018.10.005.
- Lebourgeois V, Begue A, Labbe S, Houles M, Martine JF. 2012. A light-weight multi-spectral aerial imaging system for nitrogen crop monitoring. Precis Agric. 13:525–541. doi:10.1007/s11119-012-9262-9.
- Li Q, Zhou D, Denton MD, Cong S. 2019. Alfalfa monocultures promote soil organic carbon accumulation to a greater extent than perennial grass monocultures or grass-alfalfa mixtures. Ecol Eng. 131:53–62. doi:10.1016/j.ecoleng.2019.03.002.
- Liu Y, Wang J, Xiao Y, Shi X, Zeng Y. 2021. Diversity analysis of chlorophyll, flavonoid, anthocyanin, and nitrogen balance index of tea based on Dualex. Phyt-Int J Exp Bot. 90:1549–1558. doi:10.32604/phyton.2021.015557.
- Maselli F, Chiesi M, Angeli L, Fibbi L, Rapi B, Romani M, Sabatini F, Battista P. 2020. An improved NDVI-based method to predict actual evapotranspiration of irrigated grasses and crops. Agric Water Manag. 233:106077. doi:10.1016/j.agwat.2020.106077.
- Mills AM, Smith MC, Moot DJ. 2016. Relationships between dry matter yield and height of rotationally grazed dryland lucerne. J N Z Grassl. 78:185–196. doi:10.33584/jnzg.2016.78.504.
- Misar CG, Xu L, Gates RN, Boe A, Johnson PS. 2015. Stand persistence and forage yield of 11 alfalfa (Medicago sativa) populations in semiarid rangeland. Rangel Ecol Manag. 68:79–85. doi:10.1016/j.rama.2014.12.012.
- Mokarram M, Boloorani AD, Hojati M. 2016. Relationship between land cover and vegetation indices. case study: Eghlid plain, Fars province. Iran. Eur J Geogr. 7:48–60.
- Mokarram M, Hojjati M, Roshan G, Negahban S. 2015. Modeling the behavior of vegetation indices in the salt dome of Korsia in north-east of Darab, Fars, Iran. Model Earth Syst Environ. 1:27. doi:10.1007/s40808-015-0029-y.
- Motohka T, Nasahara KN, Oguma H, Tsuchida S. 2010. Applicability of green-red vegetation index for remote sensing of vegetation phenology. Remote Sens (Basel). 2:2369–2387. doi:10.3390/rs2102369.
- Mouradi M, Bouizgaren A, Farissi M, Latrach L, Qaddoury A, Ghoulam C. 2016. Seed osmopriming improves plant growth, nodulation, chlorophyll fluorescence and nutrient uptake in alfalfa (Medicago sativa L.)—rhizobia symbiosis under drought stress. Sci Hortic. 213:232–242. doi:10.1016/j.scienta.2016.11.002.
- Peoples MB, Brockwell J, Hunt JR, Swan AD, Watson L, Hayes RC, Li GD, Hackney B, Nuttall JG, Davies SL, Fillery IRP. 2012. Factors affecting the potential contributions of N-2 fixation by legumes in Australian pasture systems. Crop Pasture Sci. 63:759–786. doi:10.1071/CP12123.
- Phyu P, Islam MR, Cruz PCS, Collard BCY, Kato Y. 2020. Use of NDVI for indirect selection of high yield in tropical rice breeding. Euphytica. 216:74. doi:10.1007/s10681-020-02598-7.
- Picasso VD, Casler MD, Undersander D. 2019. Resilience, stability, and productivity of alfalfa cultivars in rainfed regions of North America. Crop Sci. 59:800–810. doi:10.2135/cropsci2018.06.0372.
- Rice W, Penney D, Nyborg M. 1977. Effects of soil acidity on rhizobia numbers, nodulation and nitrogen-fixation by alfalfa and red-clover. Can J Soil Sci. 57:197–203. doi:10.4141/cjss77-024.
- Rouse JW, Haas RH, Schell JA, Deering DW. 1974. Monitoring vegetation systems in the great plains with ERTS. NASA Spec Publ. 351:309.
- Sangra A, Shahin L, Dhir SK. 2019. Long-term maintainable somatic embryogenesis system in alfalfa (Medicago sativa) using leaf explants: embryogenic sustainability approach. Plants-Basel. 8:278. doi:10.3390/plants8080278.
- Schneider P, Roberts DA, Kyriakidis PC. 2008. A VARI-based relative greenness from MODIS data for computing the fire potential index. Remote Sens Environ. 112:1151–1167. doi:10.1016/j.rse.2007.07.010.
- Simili FF, Silva Barbosa KR, Augusto JG, Menegatto LS, Mendonca GG, Bonacim PM, de Andrade Gimenes FM, Savegnago RP. 2019. Study of the chemical composition of Urochloa brizantha using the SPAD index, neural networks, multiple linear models, principal components and cluster analysis. Anim Feed Sci Technol. 258:114307. doi:10.1016/j.anifeedsci.2019.114307.
- Sousa DO, Hansen HH, Hallin O, Nussio LG, Nadeau E. 2020. A two-year comparison on nutritive value and yield of eight lucerne cultivars and one red clover cultivar. Grass Forage Sci. 75:76–85. doi:10.1111/gfs.12459.
- Tremblay N, Wang Z, Cerovic ZG. 2012. Sensing crop nitrogen status with fluorescence indicators. A Review. Agron Sustain Dev. 32:451–464. doi:10.1007/s13593-011-0041-1.
- Trubins R. 2013. Land-use change in southern Sweden: before and after decoupling. Land Use Policy. 33:161–169. doi:10.1016/j.landusepol.2012.12.018.
- Vannoppen A, Gobin A. 2021. Estimating farm wheat yields from NDVI and meteorological data. Agron-Basel. 11:946. doi:10.3390/agronomy11050946.
- Vina A, Gitelson AA, Rundquist DC, Keydan G, Leavitt B, Schepers J. 2004. Remote sensing—monitoring maize (Zea mays L.) phenology with remote sensing. Agron J. 96(4):1139–1147. doi:10.2134/agronj2004.1139.
- Wang W, Yao X, Yao XF, Tian YC, Liu XJ, Ni J, Cao WD, Zhu Y. 2012. Estimating leaf nitrogen concentration with three-band vegetation indices in rice and wheat. Field Crops Res. 129:90–98. doi:10.1016/j.fcr.2012.01.014.
- Wang Y, Wang DJ, Shi PH, Omasa KJ. 2014. Estimating rice chlorophyll content and leaf nitrogen concentration with a digital still color camera under natural light. Plant Methods. 10:36. doi:10.1186/1746-4811-10-36.
- Wigley K, Ridgway HJ, Humphries AW, Ballard RA, Moot DJ. 2018. Increased lucerne nodulation in acid soils with Sinorhizobium meliloti and lucerne tolerant to low pH and high aluminium. Crop Pasture Sci. 69(10):1031–1040. doi:10.1071/CP18124.
- Xu K, Wang H, Li X, Liu H, Chi D, Yu F. 2016. Identifying areas suitable for cultivation of Medicago sativa L. in a typical steppe of inner Mongolia. Environ Earth Sci. 75(4):341. doi:10.1007/s12665-016-5251-z.
- Yu H, Wu H-S, Wang Z-J. 2010. Evaluation of SPAD and Dualex for in-season corn nitrogen status estimation. Acta Agron Sin. 36:840–847. doi:10.1016/S1875-2780(09)60051-1.
- Zhou Z, Morel J, Parsons D, Kucheryavskiy SV, Gustaysson A-M. 2019. Estimation of yield and quality of legume and grass mixtures using partial least squares and support vector machine analysis of spectral data. Comput Electron Agric. 162:246–253. doi:10.1016/j.compag.2019.03.038.