Abstract
Dietary protein restriction reduces insulin-like growth factor (IGF)-I synthesis and impairs growth. Moreover, insulin secretion is impaired and hepatic insulin signaling is activated presumably through upregulation of insulin receptor substrate (IRS)-2, which can stimulate lipogenesis thereby resulting in steatosis. In order to determine whether impaired insulin secretion is the primary cause of these changes, we injected insulin into protein-restricted rats and compensated for the reduction in insulin secretion for 1 and 7 d. Insulin infusion did not overcome the reduction in liver IGF-I mRNA nor the hepatic triglyceride accumulation. In contrast, it clearly suppressed the upregulation of hepatic IRS-2 on day 1, but not on day 7. Furthermore, insulin elimination increased IRS-2 in H4IIE-C3 cells. In summary, we found that reduced insulin secretion during protein restriction directly increased hepatic IRS-2 as a rapid response on day 1, while additional mechanisms contributed to the upregulation of IRS-2 on day 7.
Graphical Abstract
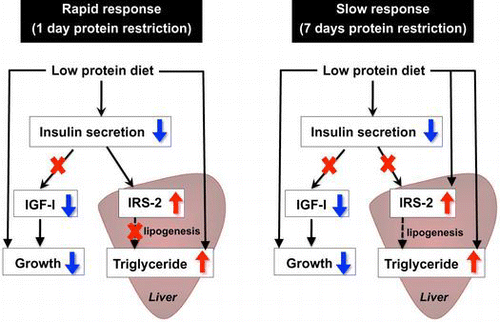
Reduced insulin secretion directly increases hepatic IRS-2 under protein restriction for 1 day but not for 7 days. Growth retardation and liver lipid accumulation are not consequences of decreased insulin secretion.
It has been well documented that protein malnutrition during the growth phase inhibits animal growth and is accompanied by reduced circulating insulin-like growth factor (IGF)-I following reduced hepatic IGF-I synthesis. Such a phenotype is typically observed in kwashiorkor,Citation1,2) a form of severe protein malnutrition in infants and children. With suppressed protein anabolism, animals fed a low protein diet and patients with kwashiorkor develop marked accumulation of hepatic triglycerides associated with impaired lipid transport from the liver.Citation3,4)
In addition to changes in metabolism, animals fed low protein diets for a prolonged period show impairment in glucose-induced insulin secretionCitation5–7) due to reductions in pancreatic β cell mass and function.Citation6,8,9) It is still unclear whether reduced insulin secretion triggers repression of IGF-I production during protein deprivation, although direct stimulation of hepatic IGF-I production by insulin has been reported.Citation10)
In spite of impairment in insulin secretion, protein-malnourished animals appear to maintain blood glucose levels within the normal range.Citation7) Increased insulin sensitivity is revealed by the insulin tolerance test, and is accompanied by greater protein and/or tyrosine phosphorylation levels of insulin receptor (IR) and IRS-1 in muscle.Citation7,11,12) IR and IRS-1 are important substrates mediating insulin bioactivities in the peripheral tissues of protein-malnourished animals. This increase can maintain normal glucose levels by enhancing peripheral insulin action and stimulating glucose uptake, thereby compensating for the reduced insulin secretion.
Although insulin does not stimulate glucose uptake in liver, the liver appears to increase insulin sensitivity in response to protein deprivation, because feeding a protein-free diet to rats increased the IR, IRS-1, and IRS-2 proteins, especially IRS-2, and enhanced the insulin-induced phosphorylation of insulin-signaling molecules in the liver.Citation13) Increased insulin signaling might have the potential to stimulate hepatic lipogenesis via activation of transcription factor sterol regulatory element-binding protein (SREBP)-1c, which in turn induces the expression of genes that function in fatty acid synthesis.Citation14) Thus, protein malnutrition can increase insulin sensitivity in liver and stimulate fatty acid synthesis through activation of insulin signal transduction, but little is known about the relationship between hepatic triglyceride accumulation and altered insulin signaling during protein deprivation.
The present study was undertaken to determine whether impaired insulin secretion is the primary cause of reduced IGF-I production, enhanced insulin signaling, and increased triglyceride accumulation in the liver during protein restriction. We administered insulin to rats fed a low protein diet and examined to determine whether these changes would be restored to the levels in animals with normal protein intake. Moreover, to elucidate whether impaired insulin secretion causes the increase in IRS-2 protein, we utilized H4IIE-C3 rat hepatoma cells and examined the direct effect of insulin deprivation on the amount of IRS-2 protein.
Materials and methods
Animals
Six-week-old male Wistar strain rats weighing approximately 150 g were purchased (Japan Laboratory Animals, Tokyo, Japan), housed individually in cages, and kept at 22–24 °C under a 12 h (06:00–18:00) light–dark cycle. The animals were fed ad libitum a commercial pellet feed (certified diet MF; Oriental Yeast, Tokyo, Japan) for the first 4 d in order to adjust them to their new environment. Then, the rats were trained to eat a 15% casein diet (15C, the control diet) between 10:00 and 18:00 for 4 d, after which they were divided into four treatment groups: the 15C group, the isocaloric 5% casein diet (5C) group, the 15C with insulin injection (15C + INS) group, and the 5C with insulin injection (5C + INS) group. The composition of the diet is shown in Table . All the animals were allowed free access to water throughout the experiment. Intermediate-acting human insulin (Novolin N; Novo Nordisk, Bagsvaerd, Denmark) suspended in phosphate-buffered saline (PBS) was injected subcutaneously at a concentration of 3 U/kg of body weight to the 15C + INS and 5C + INS group animals twice a day, just prior to and 3 h after the onset of feeding, whereas the 15C and 5C control rats were injected with PBS alone. On days 1 and 7, heparinized blood was collected from the tail at time points 0, 1.5, 3, and 4.5 h after the onset of feeding. After 8 h of feeding, the rats were starved for 16 h and anesthetized with sodium pentobarbital (Somnopentyl; Kyoritsu Seiyaku, Tokyo, Japan), and heparinized blood was collected by cardiac puncture. The livers were excised, frozen in liquid nitrogen, and stored at −80 °C until analysis.
Table 1. Composition of experimental diet.
The animal handling and experimental procedures were approved by the Meiji University Institutional Animal Care and Use Committee.
Cell culture
H4IIE-C3 rat hepatoma cells were obtained from the American Type Culture Collection (ATCC, Manassas, VA, USA; ATCC CRL-1600). The cells were maintained in Dulbeco’s Modified Eagle’s Medium containing 10% fetal bovine serum and antibiotics at 37 °C in a humid atmosphere containing 5% CO2.
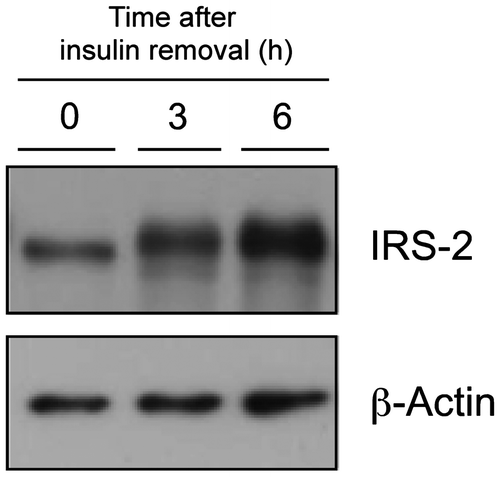
To examine the effects of insulin deprivation, subconfluent cells were pre-cultured in serum-free media for 6 h with 10 nM of added insulin. Then cells were cultured in serum-free media without insulin for 0, 3, and 6 h.
Measurement of plasma insulin, IGF-I, glucose, and triglyceride levels
Plasma human insulin and rat IGF-I concentrations were assayed with Mercodia insulin ELISA (Mercodia, Uppsala, Sweden) and Quantikine mouse/rat IGF-I (R&D systems, Minneapolis, MN, USA), respectively, following the manufacturers’ instructions. Plasma total insulin concentrations were measured with a rat insulin ELISA kit (Morinaga Institute of Biological Science, Yokohama, Japan), which also works for human insulin. Plasma glucose and triglyceride levels were assayed with glucose CII-test Wako (Wako Pure Chemicals, Osaka, Japan) and triglyceride E-test Wako (Wako Pure Chemicals), respectively.
Quantitative real-time RT-PCR analysis
Total RNA was extracted from the liver with an RNeasy mini kit (Qiagen, Hilden, Germany), following the manufacturer’s instructions. First-strand cDNA synthesis following genomic DNA degradation was performed with PrimeScript RT reagent kit with gDNA eraser (Takara, Otsu, Japan). Real-time PCR analysis for the liver IGF-I, IRS-1, and IRS-2 genes was performed with LightCycler 480 (Roche, Basel, Switzerland) with SYBR Green Real-time PCR Master Mix-Plus- (Toyobo, Osaka, Japan). Standard curves were prepared and relative quantification was done with mRNA levels of β-actin as internal control. Amplification of a single product for each primer set was confirmed by melting curve analysis. The primer sequences used were as follows: for the IGF-I gene, forward primer 5-TTCAGTTCGTGTGTGGACCAA-3 and reverse primer 5-AAGCAACACTCATCCACAATGC-3; for the IRS-1 gene, forward primer 5-CTTCCAGAAGCAACCAGAGG-3 and reverse primer 5-TCCTGGTTGTGAATCGTGAA-3; for the IRS-2 gene, forward primer 5-GACTTCTTGTCCCATCACTTGAAA-3 and reverse primer 5-GCTAAGCATCTCCTCAGAATGGA-3; and for the β-actin gene, forward primer 5-ACCCACACTGTGCCCATCTA-3 and reverse primer 5-CGTCACACTTCATGATG-3 or forward primer 5-GGCCAACCGTGAAAAGATGA-3 and reverse primer 5-AGAGGCATACAGGGACAACACA-3.
Protein extraction, Western blotting, and immunoprecipitation
Frozen liver was ground to a powder by mortar and pestle and homogenized in approximately 10 times its volume of homogenizing buffer (50 mM HEPES-NaOH pH 7.6, 10 mM Na4P2O2•10H2O, 100 mM NaF, 2 mM ethylenediaminetetraacetic acid, 2% Triton X-100, 10 mM orthovanadate, 10 mg/mL of p-nitrophenyl phosphate (PNPP), and 1x Protease inhibitor cocktail (Nacalai Tesque, Kyoto, Japan)) using HG30 homogenizer (Hitachi, Tokyo, Japan). The extracts were centrifuged at 100,000 × g for 1 h at 4 °C and the supernatants were collected. The protein concentration was determined using Bio-Rad Protein assay kit (Bio-Rad Laboratories, Hercules, CA, USA) with BSA as a standard.
H4IIE-C3 hepatoma cells were rinsed with ice-cold PBS and lysed with lysis buffer (50 mM Tris-HCl pH 7.4, 150 mM NaCl, 1 mM EDTA, 1% Triton X-100, 1 mM NaF, 10% glycerol, 1 mM ethyleneglycoltetraacetic acid, 10 mg/mL PNPP, 100 KIU/mL aprotinin, 500 μM orthovanadate, 20 μg/mL phenylmethylsulfonyl fluoride, 5 μg/mL pepstatin, 10 μg/mL of leupeptin). Insoluble materials were removed by centrifugation at 7,000 × g for 10 min and the supernatants were collected. The protein concentration was determined as described above.
Equal volumes of 2x sample buffer (0.125 M Tris-HCl pH 6.8, 4% sodium dodecyl sulfate (SDS), 10% sucrose, 10% 2-mercaptoethanol, and 0.001% bromophenol blue) or 1/2 volume of 3x Laemmli’s buffered solution (30 mM Tris-HCl pH 7.8, 9% SDS, 15% glycerol, 6% 2-mercaptoethanol, 0.05% bromophenol blue) was added to the protein extract and this was boiled for 5 min. An equal amount of protein was separated by SDS-polyacrylamide gel electrophoresis (PAGE) using 8% gel and electroblotted onto a polyvinylidene difluoride (PVDF) membrane. Nonspecific binding sites were blocked with 5% skim milk/Tris-buffered saline (TBS) for 1 h at room temperature. Then, the PVDF membrane was incubated overnight at 4 °C with anti-IRS-1 (H-165), IRS-2 (H-205), or β-actin (AC-15) antibody (Santa Cruz Biotechnology, Delaware, CA, USA) 200 times diluted with Can Get Signal immunoreaction enhancer solution 1 (Toyobo, Osaka, Japan). Then, the membrane was washed thrice with TBS containing 0.1% Tween-20 (TBS-T) and incubated with secondary antibody (horseradish peroxidase-linked anti-rabbit or mouse IgG (Santa Cruz Biotechnology)) diluted 30,000 or 5,000-fold with Can Get Signal immunoreaction enhancer solution 2 (Toyobo) at room temperature for 1 h. The membrane was further washed thrice with TBS-T, and immune complexes were visualized with Immobilon western chemiluminescent HRP substrate (Millipore Billerica, MA, USA) or Western Lightning-ECL (Perkin Elmer, Waltham, MA, USA). Images were detected by either the ImageQuant LAS 4000 system (Fuji Film, Tokyo, Japan) or Fuji Medical X-ray film RX-U (Fuji Film).
For immunoprecipitation, 3 mg of protein extract was incubated with 7.5 μg of protein A Sepharose Fast Flow (GE Healthcare, Buckinghamshire, UK) for 1 h at 4 °C and centrifuged briefly, and a pre-cleared supernatant was obtained. Twelve microliter of anti-IRS-1 (H-165) or IRS-2 (H-205) antibody (Santa Cruz Biotechnology) was added to each sample and this was incubated overnight at 4 °C. Then, 10 μg of protein A-Sepharose was added to each sample and this was further incubated for 1 h at 4 °C. The immunocomplex was washed thrice with homogenizing buffer, suspended in 2x sample buffer, and boiled for 5 min. The sample was resolved by 8% SDS PAGE and assayed by Western blotting with an anti-phosphotyrosine (PY20), IRS-1 (C-20), or IRS-2 (M-19) antibody (Santa Cruz Biotechnology) as described above, except that 3% BSA/TBS was applied for blocking when the anti-phosphotyrosine antibody was used.
Measurement of liver triglyceride levels
Liver was homogenized in five times its volume of PBS. One milliliter of isopropanol was added to 200 μL of the homogenate, and this was vortexed and centrifuged at 15,000 × g for 10 min. The supernatants were collected, and the triglyceride concentration was measured as described above.
Statistical analysis
To confirm human insulin injection into the rats, area under the curve (AUC) values, calculated by the linear trapezoidal method, of human insulin during 0–4.5 h of feeding in the 15C and 5C animals were compared to those of the 15C + INS and 5C + INS groups, respectively, by Student’s t test. To determine whether the insulin administration compensated for the reduced insulin secretion in the 5C rats, the AUC values were compared to those of the 15C and 5C + INS groups, respectively, by Student’s t test. Logarithmically transformed values were used for data-sets with unequal variance. The Smirnov–Grubbs test was used to detect outliers. Two-way analysis of variance (ANOVA) was carried out to analyze the significant effects of diet and insulin injection and the interaction between diet and insulin injection for the values for the plasma glucose concentration, food intake, body weight, liver weight, liver IGF-I mRNA levels, plasma IGF-I concentrations, liver IRS-1 and IRS-2 mRNA levels, and liver and plasma triglyceride levels of the test animals. All statistical analyses were done using Statcel Ver. 2 software (OMS Publishing, Saitama, Japan) or Excel statistics 2008 (SSRI, Tokyo, Japan).
Results
Characterization of the test animals
The plasma human insulin concentrations during feeding significantly increased in the groups that received injected insulin, as shown by the AUC of the plasma insulin concentrations after 0–4.5 h of feeding (Fig. (A)). The total plasma insulin level was significantly lower in the 5C animals than in the 15C ones on day 1 (Fig. (B)). Besides, insulin injection significantly increased plasma total insulin levels in the 5C rats to an extent similar to the 15C group on both days (Fig. (B)). Feeding the 5C diet or injecting insulin for 1 d did not affect the food intake or body weights of the rats (Table ). On the other hand, feeding the 5C diet for 7 d significantly reduced the body weight gain of the rats without affecting food intake (Table ). The liver weight was significantly lower in the 5C groups compared to the control groups on day 1, but was not statistically different on day 7 (two-way ANOVA p = 0.06 for the effect of a diet) (Table ). A significant effect of insulin injection was observed on plasma glucose concentrations on day 7 (Fig. (C)), but the lowest glucose concentration recorded was 131 mg/dL, and no hypoglycemic symptoms were observed in the test animals throughout the experiment. No effect of diet or insulin injection was observed on the initial plasma glucose levels on day 1, but a significant effect of insulin was observed on day 7 (Table ).
Fig. 1. AUC for 0–4.5 h plasma human insulin (A), total insulin (B), and glucose levels (C).
Note: Rats were fed a low protein diet (5C) or a control diet (15C) for 8 h/d with injection of intermediate-acting human insulin before and 3 h after the onset of feeding. On days 1 and 7, heparinized blood was collected from the tail at 0, 1.5, 3, and 4.5 h after the onset of feeding, and plasma insulin and glucose concentrations were measured. Means ± standard errors are represented (n = 4 or 5). Results of Student’s t test (A and B) or two-way ANOVA (C) are given below the graph (*p < 0.05, **p < 0.01, ***p < 0.001).
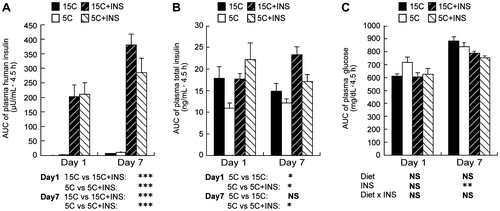
Table 2. Characteristics of test animals.
Plasma IGF-I concentrations and liver IGF-I mRNA levels in protein-restricted rats injected with insulin
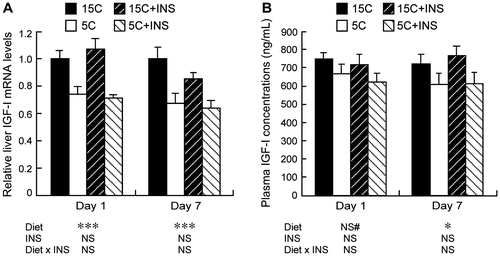
A significant effect of the low protein diet on the decrease in liver IGF-I mRNA levels was observed even in the animals tested 1d (Fig. (A), left panel). The plasma IGF-I concentrations in day 1 tended to decrease on the 5C diet, but this was not statistically significant (Fig. (B), left panel, two-way ANOVA p = 0.08 for the effect of diet). The low protein diet significantly decreased both plasma IGF-I concentrations and liver IGF-I mRNA levels of 7 d 5C fed groups (Fig. (A) and (B), right panels). No effect of insulin injection and no diet × INS interaction were observed in these experiments.
Fig. 2. Effects of insulin compensation on plasma IGF-I concentrations and liver IGF-I mRNA levels of rats fed a low protein diet.
Note: On days 1 and 7 after 16 h of starvation, rats were anesthetized and cardiac blood and liver were collected. Relative mRNA levels of liver IGF-I was measured by quantitative real-time PCR using β-actin as control (A). Plasma samples were prepared, and the IGF-I concentration was measured (B). Means ± standard errors are represented (n = 5). Results of two-way ANOVA for each day are given below the graph (*p < 0.05, ***p < 0.001, #p < 0.1).
Messenger RNA and protein and tyrosine phosphorylation levels of IRS-1 and IRS-2 in the livers of the protein-restricted rats injected with insulin
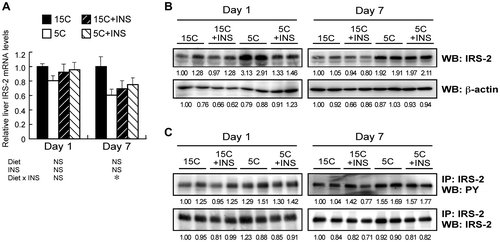
Feeding a low protein diet with and without injected insulin for 1 d did not affect the mRNA levels of IRS-1 and IRS-2 (Figs. (A) and (A), left panels). A significant interaction of diet × INS was observed by two-way ANOVA on the mRNA levels of IRS-1 and IRS-2 on day 7, but one-way ANOVA revealed that the mRNA levels were not statistically different (Figs. (A) and (A), right panels). Feeding of the low protein diet with or without injected insulin for 1 and 7 d did not affect the protein levels of IRS-1 (Fig. (B)). Meanwhile, the tyrosine phosphorylation level of IRS-1 was slightly reduced in 5C groups as compared to the 15C ones on day 7, though not on day 1 (Fig. (C)). The low protein diet increased IRS-2 protein levels on both day 1 and day 7 (Fig. (B)). The upregulation of IRS-2 proteins in the 5C group was diminished by insulin injection on day 1, but not on day 7 (Fig. (B)). Neither the 5C diet nor insulin injection affected the phosphorylation levels of the immunoprecipitated IRS-2 protein (Fig. (C)).
Fig. 3. Effect of insulin compensation on mRNA, and protein and tyrosine phosphorylation levels of IRS-1 in liver of rats fed a low protein diet.
Note: Liver samples were collected as described in the legend to Fig. . Relative mRNA levels of IRS-1 were measured by quantitative real-time PCR using β-actin as internal control (A). Means ± standard errors are represented (n = 5), and the results of two-way ANOVA are given below the graph. Crude protein extract was analyzed by immunoblotting with an anti-IRS-1 antibody (B). Immunoprecipitated IRS-1 was analyzed with an anti-phospho-tyrosine (PY) antibody (C). Typical results for two rats are shown (B and C). Numbers under lanes indicate relative band intensities with the leftmost lane taken to be 1.00.
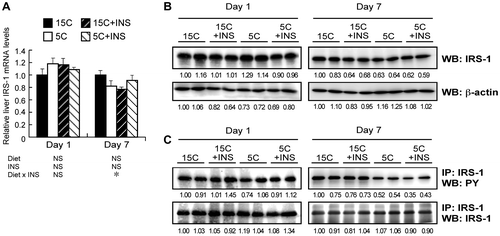
Fig. 4. Effect of insulin compensation on mRNA, protein, and tyrosine phosphorylation levels of IRS-2 in the liver of rats fed a low protein diet.
Note: Liver samples were collected as described in the legend to Fig. . Relative mRNA levels of IRS-2 were measured by quantitative real-time PCR using β-actin as internal control (A). Means ± standard errors are represented (n = 5), and the results of two-way ANOVA are given below the graph. Crude protein extract was analyzed by immunoblotting with an anti-IRS-2 antibody (B). Immunoprecipitated IRS-2 was analyzed with an anti-phospho-tyrosine (PY) antibody (C). Typical results for two rats are shown (B and C). Numbers under lanes indicate relative band intensities with the leftmost lane taken to be 1.00.
IRS-2 protein levels of the H4IIE-C3 cells after removal of insulin from the medium
Insulin withdrawal from the medium for 3 and 6 h increased the IRS-2 protein levels in H4IIE-C3 cells (Fig. ).
Liver and plasma triglyceride levels in the protein-restricted rats injected with insulin
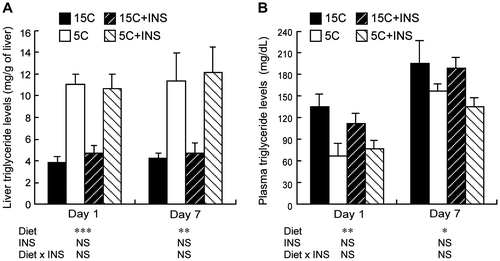
The accumulated liver triglyceride levels were significantly higher in the 5C animals on both day 1 and day 7 (Fig. (A)). The 5C diet significantly reduced plasma triglyceride levels on both days (Fig. (B)). Insulin injection did not influence the plasma or liver triglyceride levels in the test animals.
Fig. 6. Effects of insulin compensation on liver triglyceride levels and plasma triglyceride concentrations of rats fed low protein diet.
Note: Liver and plasma samples were collected as described in the legend to Fig. . and triglyceride concentrations were measured. Means ± standard errors are represented (n = 5). Results of two-way ANOVA for each day are given below the graph (*p < 0.05, **p < 0.01, ***p < 0.001).
Discussion
Our observation that plasma insulin concentrations declined during the first 0–4.5 h on the 5C diet constitutes a novel finding, indicating that a low protein diet immediately influences insulin secretion. Recently, we found that the reduction in insulin secretion that we observed on day 1 occurred within 30 min of the original intake of a low protein diet (manuscript in preparation). Because the reduction was very acute, a loss of pancreatic β cell volume and function, reported to be the cause of impaired insulin secretion under prolonged protein malnutrition,Citation6,8,9) was not a significant mechanism of this impairment. On the other hand, reduced levels of plasma amino acids in response to a low protein diet might be responsible for this rapid alteration, because certain amino acids, such as leucine and arginine, have been reported to stimulate insulin secretion from β cells directly.Citation15–17)
The liver is the major source of circulating IGF-I.Citation18,19) The 5C diet administered for 7 d impaired rat growth without affecting the amount of food intake (Table ), and resulted in significant reductions in plasma IGF-I concentrations following reduced liver IGF-I gene expression (Fig. ). Although this phenotype is typically observed in animals suffering protein malnutrition,Citation20,21) our study found a more rapid reduction in liver IGF-I mRNA than reported previously. We observed that this loss was significant in animals fed the 5C diet for 8 h followed by fasting for 16 h (Fig. (A), left panel). It has been found that insulin treatment stimulates IGF-I gene expression in primary rat hepatocytes,Citation10) but the reduction in hepatic IGF-I gene expression during protein malnutrition was not a consequence of reduced insulin secretion in our experiments, because insulin injection did not restore liver mRNA levels or the plasma concentration of IGF-I. Since amino acid removal from culture media decreased IGF-I mRNA levels in primary rat hepatocytes,Citation22) we assume that reduced amino acid availability directly triggered the suppression of IGF-I synthesis. The decline in IGF-I gene expression can be partly regulated at a post-transcriptional level, since reduced stability of the IGF-I transcript has been found in food-deprived rats.Citation23)
IRS proteins are docking molecules required for the propagation of insulin activity to downstream signaling cascades such as the MAPK and phosphoinositide 3-kinase (PI3 K) pathways, which is important for glucose and lipid homeostasis.Citation14) Recent studies have found that systemic knockout mice of IRS-1 and IRS-2, the major IRS isoforms, exhibit insulin resistance.Citation24–26) Although both IRS-1 and -2 are highly expressed in the liver, mice lacking systemic IRS-2 but not IRS-1 showed impairment of hepatic insulin signaling.Citation27,28) Furthermore, it has been found that hepatic IRS-2 expression is more sensitive to the change in dietary protein than a IRS-1.Citation13) Thus, IRS-2 appears to have more important roles in the liver. Similarly to the previous study showing increases in hepatic IRS-2 protein under a protein-free diet,Citation13) we observed a marked increase in IRS-2, but not IRS-1, in the livers of the 5C groups (Figs. (B) and (B)). Furthermore, the rapid increase in hepatic IRS-2 protein in the 5C group on day 1 was attenuated by insulin infusion. In addition, we confirmed that the amount of IRS-2 protein increased in H4IIE-C3 cells after insulin withdrawal (Fig. ). Based on these results, we concluded that insulin reduction directly mediates the upregulation of IRS-2 during short-term protein malnutrition. Rui et al. have reported that insulin and IGF-I induced ubiquitin/proteasome-mediated degradation of IRS-2 in various types of cultured cells, and that this degradation was suppressed by inhibitors of PI3 K and mammalian target of Rapamycin (mTOR).Citation29) We have reported that insulin stimulation eliminated an association between de-ubiquitinating enzyme USP7 and IRS-1/2, followed by proteasomal degradation of them.Citation30) Taken together, the suppression of proteasome-mediated degradation, mainly by low insulin, might have triggered the rapid induction of IRS-2 and stimulation of hepatic insulin signaling in the 5C animals on day 1. Further study, including a time-course quantification of IRS-2 and USP-7 interaction in vivo, is required. Moreover, administering Streptozotocin to animals might also provide more insight into the effect of insulin deprivation on the amount of IRS-2 protein in vivo.
It is notable that no suppressive effect of insulin infusion on hepatic IRS-2 protein was observed in the day 7 animals, demonstrating that additional mechanisms contribute to IRS-2 upregulation as the protein-deprived condition is prolonged. Our results showing maintenance of plasma insulin concentrations in the 5C group (Fig. (B), right panel) in spite of the increase in IRS-2 (Fig. (B)), right panel) supports the idea that increase in the IRS-2 was not insulin dependent on day 7. Amino acid restriction for a prolonged period might have reduced the activity of mTOR or increased binding of deubiquitinating enzymes to IRS-2, resulting in repression of the degradation of IRS-2. Indeed, the increase in the IRS-2 protein occurred without any change in mRNA levels (Fig. (A)), suggesting an involvement of post-transcriptional modification of IRS-2.
Our particular interest was to determine whether increased insulin signaling via upregulation of the IRS-2 protein stimulates hepatic triglyceride accumulation during protein malnutrition. Since the phosphorylation rate of IRS-2 was not affected by diet (Fig. (C)), we assumed that the upregulation of the IRS-2 protein can increase total phosphorylation of IRS-2 and enhanced insulin signaling in the livers of the protein-restricted rats. However, in the case of the 1 d 5C diet fed animals, stimulation of hepatic insulin signaling was not likely to contribute to hepatic triglyceride accumulation, since the 5C + INS group showed higher triglyceride levels regardless of suppression of IRS-2. On the other hand, insulin infusion did not suppress IRS-2 induction in the day 7 animals (Fig. (B), right panel). Hence, increased IRS-2-mediated insulin signaling might account in part for the hepatic triglyceride accumulation in the animals that suffered prolonged protein deprivation.
Triglyceride is the major lipid accumulating in fatty liver observed in kwashiorkorCitation31) and experimental animals under protein malnutrition.Citation32) In this study, the most substantial change caused by the 5C diet was an increase in hepatic triglyceride levels, and this increase was already significant in the animals fed the 5C diet for only 1 d, in which levels were approximately twofold higher than in the controls (Fig. ). The present results, that insulin infusion did not restore the accumulation of liver triglyceride, indicate that reduced amino acid availability itself was a trigger for lipid accumulation. Since decreased VLDL-triglyceride secretion is generally observed in protein-deprived animals, decreased VLDL synthesis and triglyceride transport from the liver, which accompany decreased apolipoprotein B (apoB) levels, have been proposed as the primary mechanism of fatty liver generation.Citation3,4,33–35) In accord with these observations, we found significant decreases in plasma triglyceride concentrations in the 5C animals, and this occurred independently of insulin administration. Furthermore, although its role in protein malnutrition remains largely unknown, endoplasmic reticulum stress, which promotes steatosis, has recently been found to inhibit apoB secretion.Citation36) A decline in apoB leads to suppression of peripheral utilization of lipids and can drive the storage of energy in the form of lipids in the liver as a physiological adaptation to protein deprivation.
In conclusion, we found that reduced insulin secretion was the primary cause of upregulation of IRS-2 protein on day 1, while additional mechanisms contributed to the upregulation of IRS-2 on day 7. This work indicates that the major metabolic changes during protein malnutrition, such as growth retardation and liver lipid accumulation, are not consequences of decreased insulin secretion but are associated with a mechanism related to the sensing of amino acid deficiency.
Acknowledgments
We thank Dr. S. Hall (The University of North Carolina at Chapel Hill) for helpful comments on the manuscript, Novo Nordisk for kindly providing Novolin N, and Dr. K. Nagao and Dr. M. Bannai (Ajinomoto) for generously donating the nutrition free DMEM mixture and full amino acid mixture.
Funding
This project was funded in part by the Program for the Promotion of Basic and Applied Researches for Innovations in Bio-Oriented Industry (to A.T. and S.I.T.), and by the Core-to-Core Program of the Japan Society for the Promotion of Science (to S.I.T.).
References
- Soliman AT, Hassan AEHI, Aref MK, Hintz RL, Rosenfeld RG, Rogol AD. Serum insulin-like growth factors I and II concentrations and growth hormone and insulin responses to arginine infusion in children with protein-energy malnutrition before and after nutritional rehabilitation. Pediatr. Res. 1986;20:1122–1130.
- Thissen JP, Ketelslegers JM, Underwood LE. Nutritional regulation of the insulin-like growth factors. Endocr. Rev. 1994;15:80–101.
- Flores H, Sierralta W, Monckeberg F. Triglyceride transport in protein-depleted rats. J. Nutr. 1970;100:375–379.
- Flores H, Pak N, Maccioni A, Monckeberg F. Lipid transport in kwashiorkor. Br. J. Nutr. 1970;24:1005–1011.
- Okitolonda W, Brichard SM, Henquin JC. Repercussions of chronic protein-calorie malnutrition on glucose homeostasis in the rat. Diabetologia. 1987;30:946–951.
- Okitolonda W, Brichard SM, Pottier AM, Henquin JC. Influence of low- and high-protein diets on glucose homeostasis in the rat. Br. J. Nutr. 1988;60:509–516.
- Reis MAB, Carneiro EM, Mello MAR, Boschero AC, Saad MJA, Velloso LA. Glucose-induced insulin secretion is impaired and insulin-induced phosphorylation of the insulin receptor and insulin receptor substrate-1 are increased in protein-deficient rats. J. Nutr. 1997;127:403–410.
- Swenne I, Borg LAH, Crace CJ, Landström AS. Persistent reduction of pancreatic Beta-cell mass after a limited period of protein-energy malnutrition in the young rat. Diabetologia. 1992;35:939–945.
- Carneiro EM, Mello MAR, Gobatto CA, Boschero AC. Low protein diet impairs glucose-induced insulin secretion from and 45Ca uptake by pancreatic rat islets. J. Nutr. Biochem. 1995;6:314–318.
- Böni-Schnetzler M, Schmid C, Meier PJ, Froesch ER. Insulin regulates insulin-like growth factor I mRNA in rat hepatocytes. Am. J. Physiol. 1991;260:E846–E851.
- Toyoshima Y, Ohne Y, Takahashi S-I, Noguchi T, Kato H. Dietary protein deprivation decreases the serine phosphorylation of insulin receptor substrate-1 in rat skeletal muscle. J. Mol. Endocrinol. 2004;32:519–531.
- Latorraca MQ, Reis MAB, Carneiro EM, Mello MAR, Velloso LA, Saad MJA, Boschero AC. Protein deficiency and nutritional recovery modulate insulin secretion and the early steps of insulin action in rats. J. Nutr. 1998;128:1643–1649.
- Toyoshima Y, Tokita R, Ohne Y, Hakuno F, Noguchi T, Minami S, Kato H, Takahashi S-I. Dietary protein deprivation upregulates insulin signaling and inhibits gluconeogenesis in rat liver. J. Mol. Endocrinol. 2010;45:329–340.
- Saltiel AR, Kahn CR. Insulin signalling and the regulation of glucose and lipid metabolism. Nature. 2001;414:799–806.
- Floyd JC, Fajans SS, Conn JW, Knopf RF, Rull J. Stimulation of insulin secretion by amino acids. J. Clin. Invest. 1966;45:1487–1502.
- Liu Z, Jeppesen PB, Gregersen S, Chen X, Hermansen K. Dose- and glucose-dependent effects of amino acids on insulin secretion from isolated mouse islets and clonal INS-1E beta-cells. Rev. Diabet. Stud. 2008;5:232–244.
- Filiputti E, Rafacho A, Araújo EP, Silveira LR, Trevisan A, Batista TM, Curi R, Velloso LA, Quesada I, Boschero AC, Carneiro EM. Augmentation of insulin secretion by leucine supplementation in malnourished rats: possible involvement of the phosphatidylinositol 3-phosphate kinase/mammalian target protein of rapamycin pathway. Metab. Clin. Exp. 2010;59:635–644.
- Yakar S, Liu JL, Stannard B, Butler A, Accili D, Sauer B, LeRoith D. Normal growth and development in the absence of hepatic insulin-like growth factor I. Proc. Nat. Acad. Sci. USA. 1999;96:7324–7329.
- Sjögren K, Liu JL, Blad K, Skrtic S, Vidal O, Wallenius V, LeRoith D, Törnell J, Isaksson OGP, Jansson JO, Ohlsson C. Liver-derived insulin-like growth factor I (IGF-I) is the principal source of IGF-I in blood but is not required for postnatal body growth in mice. Proc. Nat. Acad. Sci. USA. 1999;96:7088–7092.
- VandeHaar MJ, Moats-Staats BM, Davenport ML, Walker JL, Ketelslegers JM, Sharma BK, Underwood LE. Reduced serum concentrations of insulin-like growth factor-I (IGF-I) in protein-restricted growing rats are accompanied by reduced IGF-I mRNA levels in liver and skeletal muscle. J. Endocrinol. 1991;130:305–312.
- Miura Y, Kato H, Noguchi T. Effect of dietary proteins on insulin-like growth factor-1 (IGF-1) messenger ribonucleic acid content in rat liver. Br. J. Nutr. 1992;67:257–265.
- Thissen JP, Pucilowska JB, Underwood LE. Differential regulation of insulin-like growth factor I (IGF-I) and IGF binding protein-1 messenger ribonucleic acids by amino acid availability and growth hormone in rat hepatocyte primary culture. Endocrinology. 1994;134:1570–1576.
- Zhang J, Chrysis D, Underwood LE. Reduction of hepatic insulin-like growth factor I (IGF-I) messenger ribonucleic acid (mRNA) during fasting is associated with diminished splicing of IGF-I pre-mRNA and decreased stability of cytoplasmic IGF-I mRNA. Endocrinology. 1998;139:4523–4530.
- Araki E, Lipes MA, Patti ME, Brüning JC, Haag III B, Johnson RS, Kahn CR. Alternative pathway of insulin signaling in mice with targeted disruption of the IRS-1 gene. Nature. 1994;372:186–190.
- Tamemoto H, Kadowaki T, Tobe K, Yagi T, Sakura H, Hayakawa T, Terauchi Y, Ueki K, Kaburagi Y, Satoh S, Sekihara H, Yoshioka S, Horikoshi H, Furuta Y, Ikawa Y, Kasuga M, Yazaki Y, Aizawa S. Insulin resistance and growth retardation in mice lacking insulin receptor substrate-1. Nature. 1994;372:182–186.
- Previs SF, Withers DJ, Ren JM, White MF, Shulman GI. Contrasting effects of IRS-1 versus IRS-2 gene disruption on carbohydrate and lipid metabolism in vivo. J. Biol. Chem. 2000;275:38990–38994.
- Yamauchi T, Tobe K, Tamemoto H, Ueki K, Kaburagi Y, Yamamoto-Honda R, Takahashi Y, Yoshizawa F, Aizawa S, Akanuma Y, Sonenberg N, Yazaki Y, Kadowaki T. Insulin signalling and insulin actions in the muscles and livers of insulin-resistant, insulin receptor substrate 1-deficient mice. Mol. Cell. Biol. 1996;16:3074–3084.
- Kubota N, Tobe K, Terauchi Y, Eto K, Yamauchi T, Suzuki R, Tsubamoto Y, Komeda K, Nakano R, Miki H, Satoh S, Sekihara H, Sciacchitano S, Lesniak M, Aizawa S, Nagai R, Kimura S, Akanuma Y, Taylor SI, Kadowaki T. Disruption of insulin receptor substrate 2 causes type 2 diabetes because of liver insulin resistance and lack of compensatory β-cell hyperplasia. Diabetes. 2000;49:1880–1889.
- Rui L, Fisher TL, Thomas J, White MF. Regulation of insulin/insulin-like growth factor-1 signaling by proteasome-mediated degradation of insulin receptor substrate-2. J. Biol. Chem. 2001;276:40362–40367.
- Yoshihara H, Fukushima T, Hakuno F, Saeki Y, Tanaka K, Ito A, Yoshida M, Iemura S-i, Natsume T, Asano T, Chida K, Girnita L, Takahashi S-I. Insulin/insulin-like growth factor (IGF) stimulation abrogates an association between a deubiquitinating enzyme USP7 and insulin receptor substrates (IRSs) followed by proteasomal degradation of IRSs. Biochem. Biophys. Res. Commun. 2012;423:122–127.
- Hoyumpa AM, Greene HL, Dunn GD, Schenker S. Fatty liver: biochemical and clinical considerations. Am. J. Digest. Dis. 1975;20:1142–1170.
- Taylor GO, Ziboh VA. Liver lipid changes in experimental protein malnutrition. Am. J. Clin. Nutr. 1972;25:286–290.
- Meghelli-Bouchenak M, Boquillon M, Belleville J. Time course of changes in rat serum apolipoproteins during the consumption of different low protein diets followed by a balanced diet. J. Nutr. 1987;117:641–649.
- Lamri MY, Meghelli-Bouchenak M, Boualga A, Belleville J, Prost J. Rat plasma VLDL composition and concentration and hepatic lipase and lipoprotein lipase activities are impaired during two types of protein malnutrition and unaffected by balanced refeeding. J. Nutr. 1995;125:2425–2434.
- Boualga A, Bouchenak M, Belleville J. Low-protein diet prevents tissue lipoprotein lipase activity increase in growing rats. Br. J. Nutr. 2000;84:663–671.
- Ota T, Gayet C, Ginsberg HN. Inhibition of apolipoprotein B100 secretion by lipid-induced hepatic endoplasmic reticulum stress in rodents. J. Clin. Invest. 2008;118:316–332.

