Abstract
The mechanisms underlying the decrease in hepatic cytochrome P-450 (CYP) content in ascorbic acid deficiency was investigated in scurvy-prone ODS rats. First, male ODS rats were fed a diet containing sufficient ascorbic acid (control) or a diet without ascorbic acid (deficient) for 18 days, with or without the intraperitoneal injection of phenobarbital. Ascorbic acid deficiency decreased hepatic microsomal total CYP content, CYP2B1/2B2 protein, and mitochondrial cytochrome oxidase (COX) complex IV subunit I protein, and simultaneously increased heme oxygenase-1 protein in microsomes and mitochondria. Next, heme oxygenase-1 inducers, that is lipopolysaccharide and hemin, were administered to phenobaribital-treated ODS rats fed sufficient ascorbic acid. The administration of these inducers decreased hepatic microsomal total CYP content, CYP2B1/2B2 protein, and mitochondrial COX complex IV subunit I protein. These results suggested that the stimulation of hepatic heme oxygenase-1 expression by ascorbic acid deficiency caused the decrease in CYP content in liver.
Graphical Abstract
Ascorbic acid deficiency decreased hepatic microsomal total CYP content, CYP2B1/2B2 protein, and simultaneously increased heme oxygenase-1 protein.
Humans, other primates, guinea pigs, and ODS ratsCitation1,2) cannot synthesize L-ascorbic acid (vitamin C) because they lack L-gulono-γ-lactone oxidase (EC.1.1.3.8), which catalyzes the terminal step of ascorbic acid biosynthesis. The ODS rat (genotype:od/od) is a useful model for investigating the physiological role of ascorbic acid in humans, and the requirement of dietary ascorbic acid in ODS rats is about 300 mg per kg diet to prevent signs of scurvy and to achieve maximum growth.Citation3)
It had been reported that vitamin C deficiency in guinea pigs results in decreasd metabolism of a variety of pharmacological agents.Citation2) Thereafter, it was demonstrated that vitamin C deficiency significantly reduces the amount of cytochrome P-450 (CYP) in liver microsomes of guinea pigsCitation4) and ODS rats.Citation1,5,6) These results strongly suggested that vitamin C deficiency in human subjects leads to the abnormality in xenobiotics metabolism. CYPs are a large family of heme proteins that function in the metabolism of endogenous and exogenous compounds, including steroid hormones and xenobiotics.Citation7,8) The expressions of specific CYPs are increased by xenobiotics treatment at the stage of gene transcription. In ODS rats fed a diet containing xenobiotics, ascorbic acid deficiency also caused a reduction in hepatic CYP.Citation1,6) However, the biochemical mechanisms by which ascorbic acid deficiency reduces hepatic CYP has not been clarified.
To investigate this mechanism, we hypothesize that the stimulation of heme degradation in liver by ascorbic acid deficiency might cause the decrease in hepatic CYPs. The rate-limiting enzyme of heme degradation is heme oxygenase (HO), which includes inducible heme oxygenase-1 (HO-1) and constitutive heme oxygenase 2 (HO-2).Citation9–11) These enzymes are located in the endoplasmic reticulum and mitochondria. Converso et al.Citation12) reported that the induction of mitochondrial HO-1 was associated with a decrease in mitochondrial heme content and with a reduction in cytochrome oxidase (COX) complex IV subunit I, a mitochondrial heme protein. If the microsomal HO-1 protein in liver is increased by ascorbic acid deficiency, the stimulated degradation of microsomal heme could cause the reduction of microsomal CYP. In this study, the increase in microsomal and mitochondrial HO-1 protein and the decrease in microsomal CYP species were examined in the liver of ascorbic acid-deficient ODS rats.
The aim of this study was to investigate whether ascorbic acid deficiency causes the reduction of liver microsomal CYP species, such as CYP2B1/2B2, along with the induction of liver HO-1 protein expression in ODS rats. As the expression of CYP2B1/2B2 is remarkably induced by phenobarbital (PB),Citation13) the effects of ascorbic acid deficiency on CYP2B1/2B2 contents and HO-1 expression were examined in liver of ODS rats with and without PB treatment. Another aim of this study was to investigate whether the administration of an HO-1 inducer, such as lipopolysaccharide (LPS) and hemin, to PB-treated ODS rats causes reductions in liver microsomal CYP species, as seen in ascorbic acid deficiency.
Materials and methods
Animals and diets
Male ODS (od/od) rats, 5 weeks of age, were purchased from Japan CLEA (Tokyo, Japan). They were housed in individual wire screen-bottomed cages and maintained at 24 °C with a 12-h light cycle (lights on from 08:00 to 20:00 h). The composition of the basal diet (g/kg) was as follows: casein, 250; cornstarch (α-starch), 408.5; sucrose, 204.2; AIN93-MX mineral mixture,Citation14) 35; AIN93-VX vitamin mixture,Citation14) 10, choline chloride, 2; corn oil, 50; cellulose powder, 40; ascorbic acid, 0.3. All rats were fed the basal diet for 7 days before the start of the experiment and then the experimental diet. In all experiments, rats were killed by decapitation between 10:00 and 11:00 h. The animal care and experimental procedures were approved by the Animal Research Committee of Nagoya University (approval number, 2011031402) and were conducted according to the Regulations for Animal Experiments at Nagoya University.
Experimental protocols
In experiment 1, rats were fed the basal diet containing the 300 mg ascorbic acid/kg diet (control group, n = 6) or the diet without ascorbic acid (ascorbic acid-deficient group, n = 6) for 18 days. The food intake of ascorbic acid-deficient rats began to decrease slightly on day 12. Therefore, rats in the control group were pair-fed the mean amount consumed by rats in the ascorbic acid-deficient group from day 12 to 18.
In experiment 2, rats were fed the basal diet containing 1,000 mg ascorbic acid/kg diet (control group, n = 6) or the diet without ascorbic acid (ascorbic acid-deficient group, n = 6) for 18 days. Rats in the control group were also pair-fed the mean amount consumed by rats in the ascorbic acid-deficient group from day 12 to 18. On day 16 and 17, all rats were intraperitoneally injected with PB (Na phenobarbital, Sigma-Aldrich; 50 mg/kg body weight (BW)) between 10:00 and 11:00 h. On day 18, rats were killed at 24 h after the second injection.
In experiment 3, all rats were fed the basal diet containing 1,000 mg ascorbic acid/kg diet for 16 days. On day 10, 11, 12, and 13, rats were intraperitoneally injected with PB (50 mg/kg BW). On day 14, six rats in each group were intaperitoneally injected with LPS (Sigma-Aldrich; 2 mg/kg BW; LPS group) in saline, or saline (control group) between 10:00 and 11:00 h. On day 16, all rats were killed 48 h after the injection.
In experiment 4, all rats were fed the diet containing 1,000 mg ascorbic acid/kg diet for 13 days. On days 7, 8, 9, and 10, rats were intraperitoneally injected with PB (50 mg/kg BW). On day 11, six rats in each group were intraperitoneally injected with hemin (Wako Pure Chemical Industries, Osaka, Japan; 50 mg/kg BW; hemin group) in PBS containing 0.25 n NaOH, or PBS containing 0.25 n NaOH (control group) between 10:00 and 11:00 h. On day 13, all rats were killed 48 h after the injection.
Preparation of mitochondrial fraction and microsomes
The liver was homogenized (20% w/v) with ice-cold 1.15% KCl in 0.01 m phosphate buffer (pH 7.4) with a Potter-Elvehjem homogenizer. To prepare the mitochondrial fraction, the diluted homogenates (twofold) were centrifuged for 5 min at 1,100 × g (at 4 °C). The supernatant was centrifuged for 10 min at 11,000 × g (at 4 °C). The pellet was resuspended with 1.15% KCl in 0.01 m phosphate buffer. The suspension was centrifuged for 10 min at 11,000 × g (at 4 °C), and the pellet was stored at −80 °C as the mitochondrial fraction. To prepare microsomes, the first homogenate was centrifuged for 10 min at 10,000 × g (at 4 °C). The diluted supernatant (threefold) was centrifuged for 60 min at 105,000 × g (at 4 °C). The microsomal pellet was suspended in 0.05 m phosphate buffer (pH 7.6) containing 10 mm EDTA, and used for analyses.
Determination of liver CYP content
Liver CYP content was determined by the dithionite difference method,Citation15) using microsomal suspension.
Determination of liver ascorbic acid concentration
Liver ascorbic acid concentration was measured according to the method previously described (1).
Western blot analysis
The protein content of 3 μg in microsomal or mitochondrial protein was subjected to SDS-PAGE on 10% acrylamide gel, and the proteins in the gel were transferred onto PVDF membranes (Hybond P, GE Healthcare, Little Chalfont, Buckinghamshire, UK). The membranes were incubated for 30 min at room temperature with Blocking One (Nacalai Tesque, Tokyo, Japan) and incubated overnight at 4 °C with the first antibody, rabbit polyclonal anti-HO-1(ADI-SPA-895, Enzo Life Sciences, Farmingdale, NY, USA), anti-CYP2B1/2B2 (sc-53243, Santa Cruz Biotechnology, Santa Cruz, CA, USA), anti-CYP2C11 (PA-3-034, Thermo Scientific, Waltham, MA, USA), anti-COX complex IV subunit I (#459600, Invitrogen, Carlsbad, CA, USA), anti-calreticulin (microsomal marker, SPC-112A, StressMarq Biosciences Inc., Victria, BC, Canada), or anti-voltage-dependent anion channel 1 (VDAC1) (mitochondrial marker, sc-8828, Santa Cruz Biotechnology), and washed with TBS buffer containing 0.1% Tween 20. The membranes were incubated with the horseradish peroxidase-conjugated goat anti-rabbit IgG antibody (Santa Cruz Biotechnology) or the horseradish peroxidase-conjugated donkey anti-goat IgG antibody (sc-2033, Santa Cruz Biotechnology) for 1 h at room temperature and washed. Each antibody was diluted with Canget Signal (Toyobo, Tokyo, Japan). The first antibodies were diluted as follows: anti-HO-1 (1:1,000; Enzo Life Sciences, ADI-SPA-895), anti-CYP2B1/2B2 (1:1,000; Santa Cruz, sc-53243), anti-CYP2C11 (1:1,500; Thermo Scientific, PA-3-034), anti-COX complex IV subunit I (1:1,000; Invitrogen, 459600). The second antibody was diluted to 1:15,000 (Cell Signaling, #7076 or #7074). The membranes were autographed with the West Dura Western Blot Detection kit using the ECL method (Thermo Fisher Scientific). Each protein on the band was quantified with Image J software.
RNA preparation and gene expression analysis
Total RNA was extracted from frozen tissues using TRIzol reagent (Invitrogen). It was then treated with DNase using a TURBO DNA-free kit (Ambion, Carlsbad, CA, USA). cDNA was synthesized using a High Capacity cDNA Reverse Transcription Kit (Applied Biosystems, Foster City, CA, USA). Gene expression was quantified by real-time PCR using an ABI 7300 real-time PCR system with the Thunderbird qPCR Mix or the Thunderbird SYBR qPCR Mix (Toyobo). TaqMan primers and probes were used to determine the level of 18S rRNA (Pre-developed TaqMan Assay Reagents, Eukaryotic 18S rRNA, Applied Biosystems). The primers for the SYBR Green assay were as follows: HO-1 sense, 5′-TCGGTAGAGGCGGCTGTTC-3′; HO-1 antisense, 5′-GTCAACATGGACGCCGACTA-3′; HO-2 sense, 5′-GGCCACCACTGCACTTTACTTC-3′; HO-2 antisense, 5′-CCTTGTTGCGATCCATTTCC-3′; CYP2B1/2B2 sense, 5′-TGGTGGAGGAACTGCGGAAATC-3′; CYP2B1/2B2 antisense, 5′-TGATGCACTGGAAGAGGAAGGT-3′; CYP2C11 sense, 5′-AGTGCCTTGTGGAGGAACTGA-3′; CYP2C11 antisense, 5′-CCCAGGATAAAGGTGGGATCA-3′; COX complex IV subunit I sense, 5′-GCAGACCAAGCGGATGCT-3′; COX complex IV subunit I antisense, 5′-GGCGGAGAAGCCCTGAA-3′. The level of each mRNA was normalized to that of the corresponding 18S rRNA.
Statistical analysis
The results are expressed as means with their standard errors. Mean values were compared using Student’s t test when the variances of each group were equal. When the variances of each group were unequal, the significance of differences was determined using Welch’s test. Differences with a P-value < 0.05 were regarded as statistically significant.
Results
Effects of ascorbic acid deficiency on hepatic CYP and HO-1 expression in ODS rats without PB treatment (experiment 1)
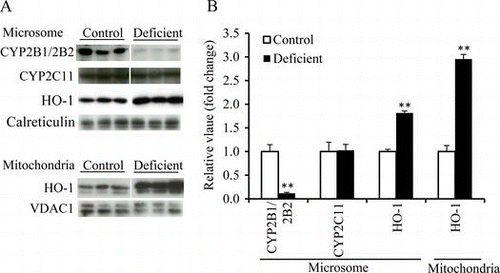
Final BW, liver weight, and liver ascorbic acid concentration in the ascorbic acid-deficient group were lower than the respective values in the control group. The levels of total CYP (Table ) and CYP2B1/2B2 protein in liver microsomes (Fig. (A and B)) were significantly lower in the deficient group than in the control group. However, the level of CYP2C11 protein was not affected by ascorbic acid deficiency (Fig. (A and B)). The hepatic HO-1 mRNA level was significantly higher in the deficient group than in the control group (Table ). But the HO-2 mRNA level was not different between these two groups (Table ). The microsomal and mitochondrial HO-1 protein levels were higher in the deficient group, and they reached 181% and 295% of the respective control values (Fig. (A and B)).
Table 1. Initial BW, final BW, liver weight, liver ascorbic acid concentration, liver total CYP Level, and liver HO-1/2 mRNA levels in the control and ascorbic acid-deficient ODS rats (experiment 1).
Fig. 1. Microsomal CYP2B1/2B2, CYP2C11, and HO-1 protein levels and mitochondrial HO-1 protein level in liver of the control and ascorbic acid-deficient ODS rats (experiment 1).
Notes: (A), Western blot analyses. Calreticulin and VDAC1 were microsomal and mitochondrial markers, respectively. (B), the mean of the control group was set to 1.0. Values are means for six rats per group, with their standard errors represented by vertical bars. **p < 0.01 vs. the control group.
Effects of ascorbic acid deficiency on hepatic CYP, COX complex IV subunit I, and HO-1 expression in ODS rats with PB treatment (experiment 2)
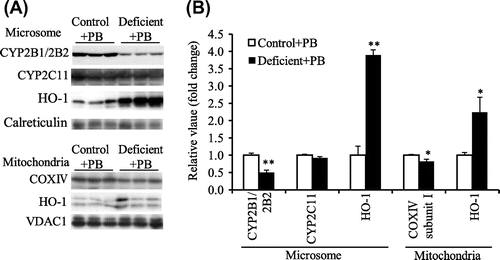
Final BW, liver weight, and liver concentration of ascorbic acid in the deficient group were lower than the respective values in the control group (Table ). In this experiment, the effect of ascorbic acid deficiency on CYP2B1/2B2 protein level was examined in ODS rats treated with PB. As a result, total CYP (Table ) and CYP2B1/2B2 protein levels (Fig. (A and B)) were significantly decreased by ascorbic acid deficiency, but CYP2C11 protein level was unaffected as seen in experiment 1 (Fig. (A and B)). COX complex IV subunit I protein level in liver mitochondria was significantly lower in the deficient group (Fig. (A and B)). The hepatic CYP2B1/2B2 and COX complex IV subunit I mRNA levels were not changed by ascorbic acid deficiency (Table ). CYP2C11 mRNA level was lower in the deficient group than in the control group (Table ). The hepatic HO-1 mRNA level was higher in the deficient group than in the control group, but the HO-2 mRNA level was not different between these two groups (Table ). The microsomal and mitochondrial HO-1 protein levels were also increased in the ascorbic acid-deficient group, and they reached 389 and 224% of the respective control values (Fig. (A and B)).
Table 2. Initial BW, final BW, liver weight, liver ascorbic acid concentration, liver total CYP Level, and liver mRNA levels in the control and ascorbic acid-deficient ODS rats administered PB (experiment 2).
Fig. 2. Microsomal CYP2B1/2B2, CYP2C11, and HO-1 protein level and mitochondrial COX complex IV subunit I and HO-1 protein level in liver of the control and ascorbic acid-deficient ODS rats administered PB (experiment 2).
Notes: (A), Western blot analyses. Calreticulin and VDAC1 were microsomal and mitochondrial markers, respectively. (B), the mean of the control group was set to 1.0. Values are means for six rats per group, with their standard errors represented by vertical bars. *p < 0.05 vs. the control group. **p < 0.01 vs. the control group.
Effects of LPS or hemin treatment on the hepatic HO-1 expression in ascorbic acid-fed ODS rats treated with PB (experiments 3 and 4)
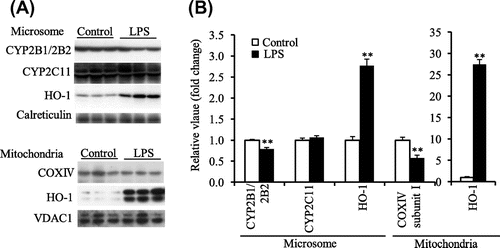
In experiment 3 and 4, all rats were administered PB. In experiment 3, final BW and liver weight in the LPS group were lower than the respective values in the control group (Table ). The administration of LPS increased liver microsomal and mitochondrial HO-1 protein levels compared to those of the control group (Fig. (A and B). The total CYP (Table ) and CYP2B1/2B2 protein levels in liver microsomes (Fig. (A and B)) were significantly lower in the LPS group than in the control group. COX complex IV subunit I protein level was also significantly lower in liver mitochondria of the LPS group (Fig. (A and B)). However, the CYP2C11 protein level in liver microsomes was not affected by LPS treatment as seen in ascorbic acid deficiency (Fig. (A and B)).
Table 3. Initial BW, final BW, liver weight, and liver total CYP level in the saline- or LPS-treated ODS rats (experiment 3), and in the vehicle- or hemin-treated ODS rats (experiment 4) administered PB.
Fig. 3. Microsomal CYP2B1/2B2, CYP2C11, and HO-1 protein level and mitochondrial COX complex IV subunit I and HO-1 protein level in liver of the control and LPS-treated ODS rats administered PB (experiment 3).
Notes: (A), Western blot analyses. Calreticulin and VDAC1 were microsomal and mitochondrial markers, respectively. (B), the mean of the control group was set to 1.0. Values are means for six rats per group, with their standard errors represented by vertical bars. **p < 0.01 vs. the control group.
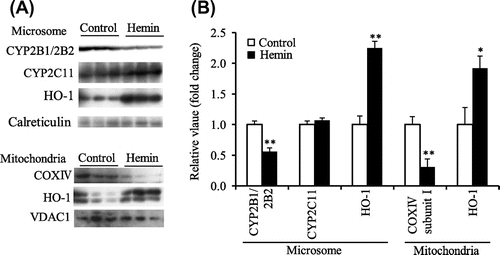
In experiment 4, Final BW in the hemin group was lower than that in the control group, but liver weight was not different between the hemin and control groups (Table ). It was also confirmed that the liver microsomal and mitochondrial HO-1 protein levels were significantly increased by hemin treatment (Fig. (A and B)). The CYP2B1/2B2 protein level in liver microsomes was significantly lower in the hemin group than in the control group, but not total CYP content (Table ). The CYP2C11 protein level was not affected by the hemin treatment (Fig. (A and B)). COX complex IV subunit I protein level in liver mitochondria was also lower in the hemin group (Fig. (A and B)).
Fig. 4. Microsomal CYP2B1/2B2, CYP2C11, and HO-1 protein level and mitochondrial COX complex IV subunit I and HO-1 protein level in liver of the control and hemin-treated ODS rats administered PB (experiment 4).
Notes: (A), Western blot analyses. Calreticulin and VDAC1 were microsomal and mitochondrial markers, respectively. (B), the mean of the control group was set to 1.0. Values are means for six rats per group, with their standard errors represented by vertical bars. *p < 0.05 vs. the control group. **p < 0.01 vs the control group.
Discussion
In this study, the total CYP and CYP2B1/2B2 protein levels in liver microsomes were significantly decreased in ascorbic acid-deficient ODS rats with and without PB treatment. Ascorbic acid deficiency also reduces the COX complex IV subunit I protein level in liver mitochondria. Simultaneously, ascorbic acid deficiency increased the hepatic expression of the HO-1 gene and the HO-1 protein levels in liver microsomes and mitochondria. Moreover, the induction of hepatic HO-1 expression by the administration of HO-1 inducer caused the reduction of CYP2B1/2B2 and COX complex IV subunit I proteins in ODS rats fed a sufficient amount of ascorbic acid.
The present study demonstrated that ascorbic acid deficiency decreased the amount of CYP2B1/2B2 in liver microsomes but did not affect the hepatic amount of CYP2C11 in ODS rats. Mori et al.Citation5) reported that the amounts of total CYP, CYP2B2, and CYP3A proteins were decreased, and that the amounts of CYP2E1 and CYP2C6/2C11 proteins were unaffected in the liver of ascorbic acid-deficient ODS rats. Their results indicated that the effects of ascorbic acid deficiency on the expression of CYPs in ODS rats were form-specific. Our present results also indicate that the changes in the hepatic amounts of CYP2B1/2B2 and CYP2C11 proteins in ascorbic acid deficiency are form-specific and similar to those reported by Mori et al.Citation5)
In the ascorbic acid-deficient ODS rats, the hepatic expression of the HO-1 gene was stimulated and the HO-1 protein levels in liver microsome and mitochondria were remarkably increased. HO-1 and HO-2 catalyze the rate-limiting step in heme degradation and are involved in the control of cellular heme content.Citation9–11) HO reacts with the heme molecule to yield biliverdin-IX, carbon monoxide, and free iron, after which biliverdin IX is rapidly converted to bilirubin X by NAD(P)H:biliverdin reductase. HO-1 has antioxidant properties attributable to bilirubin,Citation16) which scavenges reactive oxygen species,Citation17) and HO-1 expression is stimulated by oxidative stress and inflammation.Citation18–21) Although data are not shown, hepatic HO-1 mRNA in the ascorbic acid-deficient ODS rats began to increase from 12 days after the start of feeding an ascorbic acid-free diet. This increase in hepatic HO-1 mRNA expression preceded the reduction of hepatic CYP content in ascorbic acid deficiency. Therefore, the time course of these events supports that the enhancement of HO-1 gene expression contributes to the lowering of the CYP protein level in ascorbic acid deficiency.
Converso et al.Citation12) reported that the administration of HO inducer in rats increased hepatic microsomal and mitochondrial HO-1 protein, and that this induction was associated with a decrease in mitochondrial heme content and a selective reduction in mitochondrial heme protein COX complex IV subunit I. They suggested that the decrease of the mitochondrial heme pool leads to the reduction of mitochondrial COX complex IV subunit I protein. In this study, we also demonstrated that the decrease in liver mitochondrial COX complex IV subunit I protein occurred in ascorbic acid deficiency. Subsequently, we showed that the administration of LPS or hemin in ODS rats feeding a sufficient amount of ascorbic acid caused decreases in both microsomal CYP2B1/2B2 and mitochondrial COX complex IV subunit I protein levels. In this study, ascorbic acid deficiency did not affect the hepatic CYP2B1/2B2 mRNA level (Table ). This result suggests that ascorbic acid deficiency reduces the hepatic CYP2B1/2B2 protein levels by acting at the posttranslational step of CYP2B1/2B2. It is supposed that the decrease in the microsomal heme pool caused by HO-1 induction in ascorbic acid deficiency leads to the reduction in microsomal CYP. Further study is needed to measure the free heme content in liver microsomes of the ascorbic acid-deficient ODS rats.
On another point of view, intracellular heme might change the expressions of some genes. It was reported that the heme moiety stimulated the transcription of the CYP2B1/2B2 gene, and that an unknown 65-kDa protein mediated the role of heme in this stimulation of CYP2B1/2B2 gene transcription.Citation22) At present, we cannot ignore the possibility that ascorbic acid deficiency might suppress the transcription of the CYP2B1/2B2 gene in liver by reducing cellular heme content. As still another possibility, the mechanism that ascorbic acid deficiency induce HO-1 gene expression might also cause the repression of CYP2B1/2B2 expression.
In this study, we demonstrated for the first time that ascorbic acid deficiency caused the significant induction of HO-1 expression in liver of ODS rats. The changes in hepatic HO-1 protein level, total CYP content, CYP2B1/2B2 protein level, and COX complex IV subunit I protein level caused by ascorbic acid deficiency were revealed to be quite similar to those observed in ODS rats administered HO-1 inducers. These results suggest that ascorbic acid deficiency selectively decreases the hepatic CYP species, such as CYP2B1/2B2, by stimulating HO-1 gene expression. The decrease in heme moiety caused by HO-1 induction might be one of the mechanisms underlying the decrease in hepatic CYP by ascorbic acid deficiency.
Funding
This work was supported by a Grant-in Aid for Challenging Exploratory research [grant number 25660102] from the Japan Society for the promotion of Science (F. Horio).
Notes
Abbreviations: BW, body weight; COX, cytochrome oxidase; HO, heme oxygenase; LPS, lipopolysaccharide; PB, phenobarbital; VDAC1, voltage-dependent anion channel 1.
References
- Horio F, Ozaki K, Kohmura M, Yoshida A, Makino S, Hayashi Y. Ascorbic acid requirement for the induction of microsomal drug-metabolizing enzymes in a rat mutant unable to synthesize ascorbic acid. J. Nutr. 1986;116:2278–2289.
- Zannoni VG, Sato PH. Interaction with drugs and environmental chemicals. Effects of ascorbic acid on microsomal drug metabolism. Ann. N. Y. Acad. Sci. 1975;258:119–131.10.1111/nyas.1975.258.issue-1
- Horio F, Ozaki K, Yoshida A, Makino S, Hayashi Y. Requirement for ascorbic acid in a rat mutant unable to synthesize ascorbic acid. J. Nutr. 1985;115:1630–1640.
- Zannoni VG, Flynn EJ, Lynch M. Ascorbic acid and drug metabolism. Biochem. Pharmacol. 1972;21:1377–1392.10.1016/0006-2952(72)90362-0
- Mori T, Kitamura R, Imaoka S, Funae Y, Matsubara T, Kamataki T. Increased CYP1A2 content and capacity to activate Glu-P-1 and Trp-P-2 in liver microsomes of scorbutic ODS rats. Carcinogenesis. 1993;14:2471–2475.10.1093/carcin/14.12.2471
- Matsushita N, Kobayashi T, Oda H, Horio F, Yoshida A. Ascorbic acid deficiency reduces the level of mRNA for cytochrome P-450 on the induction by polychlorinated biphenyls. J. Nutr. Sci. Vitaminol. (Tokyo). 1993;39:289–302.10.3177/jnsv.39.289
- Lu AY, West SB. Multiplicity of mammalian microsomal cytochromes P-450. Pharmacol. Rev. 1979;31:277–295.
- Nebert DW, Gonzalez FJ. P450 genes: structure, evolution, and regulation. Annu. Rev. Biochem. 1987;56:945–993.10.1146/annurev.bi.56.070187.004501
- Maines MD, Kappas A. Cobalt induction of hepatic heme oxygenase; with evidence that cytochrome P-450 is not essential for this enzyme activity. Proc. Natl. Acad. Sci. U.S.A. 1974;71:4293–4297.10.1073/pnas.71.11.4293
- Maines MD, Kappas A. The degradative effects of porphyrins and heme compounds on components of the microsomal mixed function oxidase system. J. Biol. Chem. 1975;250:2363–2369.
- Drummond MD, Kappas A. Prevention of neonatal hyperbilirubinemia by tin protoporphyrin IX, a potent competitive inhibitor of heme oxidation. Proc. Natl. Acad. Sci U.S.A. 1981;78:6466–6470.
- Converso DP, Taillé C, Carreras MC, Jaitovich A, Poderoso JJ, Boczkowski J. HO-1 is located in liver mitochondria and modulates mitochondrial heme content and metabolism. FASEB J. 2006;20:1236–1238.10.1096/fj.05-4204fje
- Suwa Y, Mizukami Y, Sogawa K, Fujii-Kuriyama Y. Gene structure of a major form of phenobarbital-inducible cytochrome P-450 in rat liver. J. Biol. Chem. 1985;260:7980–7984.
- Reeves PG, Nielsen FH, Fahey GC. AIN-93 purified diets for laboratory rodents: final report of the American Institute of Nutrition ad hoc writing committee on the reformulation of the AIN-76A rodent diet. J. Nutr. 1993;123:1939–1951.
- Omura T, Sato R. The carbon monoxide-binding pigment of liver microsomes. I. Evidence for its hemoprotein nature. J. Biol. Chem. 1964;239:2370–2378.
- Doré S, Takahashi M, Ferris CD, Hester LD, Guastella D, Snyder SH. Bilirubin, formed by activation of heme oxygenase-2, protects neurons against oxidative stress injury. Proc. Natl. Acad. Sci. U.S.A. 1999;96:2445–2450.10.1073/pnas.96.5.2445
- Stocker R, Yamamoto Y, McDonagh AF, Glazer AN, Ames BN. Bilirubin is an antioxidant of possible physiological importance. Science. 1987;235:1043–1046.10.1126/science.3029864
- Keyse SM, Tyrrell RM. Heme oxygenase is the major 32-kDa stress protein induced in human skin fibroblasts by UVA radiation, hydrogen peroxide, and sodium arsenite. Proc. Natl. Acad. Sci. U.S.A. 1989;86:99–103.10.1073/pnas.86.1.99
- Tomaro ML, Frydman J, Frydman RB. Heme oxygenase induction by CoCl2, Co-protoporphyrin IX, phenylhydrazine, and diamide: evidence for oxidative stress involvement. Arch. Biochem. Biophys. 1991;286:610–617.10.1016/0003-9861(91)90088-Z
- Vile GF, Tyrrell RM. Oxidative stress resulting from ultraviolet A irradiation of human skin fibroblasts leads to a heme oxygenase-dependent increase in ferritin. J. Biol. Chem. 1993;268:14678–14681.
- Yamaguchi T, Hashizume T, Tanaka M, Nakayama M, Sugimoto A, Ikeda S, Nakajima H, Horio F. Bilirubin oxidation provoked by endotoxin treatment is suppressed by feeding ascorbic acid in a rat mutant unable to synthesize ascorbic acid. Eur. J. Biochem. 1997;245:233–240.10.1111/ejb.1997.245.issue-2
- Sultana S, Nirodi CS, Ram N, Prabhu L, Padmanaban G. A 65-kDa protein mediates the positive role of heme in regulating the transcription of CYP2B1/B2 gene in rat liver. J. Biol. Chem. 1997;272:8895–8900.
