
Abstract
Cytochrome c′ (SACP) from mesophilic Shewanella amazonensis, growing optimally at 37 °C, was thermally more stable than cytochrome c′ (AVCP) from mesophilic Allochromatium vinosum, growing optimally at 25 °C. In contrast, SACP was less stable than cytochrome c′ (PHCP) from thermophilic Hydrogenophilus thermoluteolus, growing optimally at 52 °C. Although only 28% of the SACP amino acid sequence was identical to those of AVCP and PHCP, the latter two being 55% identical, the overall main chain structures of the three cytochromes c′ were similar, and SACP exhibited thermal stability intermediate between those of AVCP and PHCP. For these three proteins, the higher the stability is, the lesser the number of Gly residues in the putative α-helical regions is. Cytochromes c′ including the present three are suitable for examining the protein stabilization mechanisms, because they are structurally similar and available from environments with a wide range of temperatures.
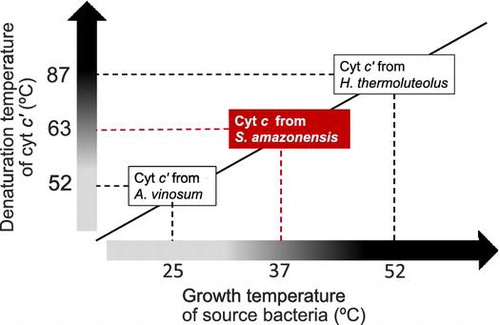
Cytochrome c′ from S. amazonensis, growing at 37 °C, exhibited stability intermediate between counterparts from A. vinosum and H. thermoluteolus, growing at 25 and 52 °C, respectively.
Cytochromes c′ are found in a variety of Gram-negative bacteria ranging from psychrophiles to thermophiles. A cytochrome c′ usually has a homo-dimeric structure,Citation1) and a single subunit of it comprises a four-helix bundle protein consisting of approximately 130 amino acid residues with a pentacoordinate heme. Cytochromes c′ bind diatomic gasses such as NO and CO, but not O2Citation2) through the heme, suggesting their putative role in the dealing with these gasses in cells. These structural and functional features distinctly differ from those of well-characterized class I spherical and monomeric mono-heme cytochromes c, which are components of respiratory electron transport chains.
We have carried out comparative studies on two cytochromes c′, a 131-residue cytochrome c′ (AVCP) from mesophilic Allochromatium vinosum, which grows optimally at 25 °C, and a 135-residue cytochrome c′ (PHCP) from thermophilic Hydrogenophilus thermoluteolus, which grows optimally at 52 °C. PHCP was thermally more stable than AVCP, the denaturation temperatures under the same experimental conditions being 87 and 52 °C, respectively.Citation3)
We searched for another suitable cytochrome c′ for a further protein thermal stability study involving homologous cytochromes c′. We found a gene encoding a cytochrome c′ protein (which we here denote as SACP) from mesophilic Shewanella amazonensis, growing optimally at 37 °C,Citation4) which is higher and lower, respectively, than the optimal growth temperatures of A. vinosum and H. thermoluteolus. In order to gain knowledge on the protein stabilization mechanism, the SACP protein was investigated as to whether its thermal stability is intermediate between those of PHCP and AVCP, which is in accordance with the optimal growth temperatures of the source bacteria.
Materials and methods
Protein preparation
S. amazonensis cells were grown in liquid LB medium at 37 °C.Citation5) Frozen cells (10 g) were suspended in 30 ml of TKG buffer [20 mM Tris-HCl (pH 8.0, adjusted at 4 °C), 140 mM KCl, 10% (v/v) glycerol, 0.5 mM phenylmethylsulfonyl fluoride, 5 μg/mL leupeptin, 5 μg/mL pepstatin A, and 1 μg/mL DNase I]. The following steps were performed at 4 °C. Cells were disrupted by four passages through a precooled French pressure cell at 147 MPa. Then, streptomycin sulfate (Meiji Seika, Tokyo) was added to the cell extract, which was gently stirred for 15 min on ice, followed by centrifugation (12,600 × g for 10 min) to remove unbroken cell debris and the nucleic acid moiety; this step was repeated twice. The soluble protein fraction was obtained by centrifugation (200,000 × g for 70 min).
The resulting soluble protein fraction was dialyzed against 10 mM Tris-HCl (pH 7.5) at 4 °C and then loaded onto a DEAE anion-exchange column (diameter, 4 cm, height, 10 cm; Tosoh, Tokyo) that had been equilibrated with 10 mM Tris-HCl (pH 7.5). Batch elution was carried out with 150 mL of the same buffer containing 0, 0.15, and 1.0 M NaCl, a brown-colored fraction containing the SACP protein being eluted with 0.15 M NaCl. The brown-colored fraction was further dialyzed against 10 mM Tris-HCl (pH 7.5) and then loaded onto the HiTrap Q column (diameter, 1.4 cm; height, 3 cm; GE Healthcare) that had been equilibrated with the same buffer. Proteins were eluted with a linear gradient of NaCl (0–0.3 M). The resulting brown fraction eluted with 0.15 M NaCl was dialyzed against 25 mM sodium acetate (pH 5.0) and then loaded onto a HiTrap SP cation-exchange column (diameter, 1.4 cm; height, 3 cm; GE Healthcare) equilibrated with the same buffer. The fraction containing the SACP protein was eluted with 0.15 M NaCl in the linear gradient of NaCl (0–0.3 M). The fraction containing the SACP protein was finally separated by gel filtration on a column of Superdex 75 (diameter, 1.6 cm; height, 60 cm; GE Healthcare) equilibrated with 10 mM Tris-HCl (pH 7.5) including 0.15 M NaCl. The protein concentrations of the solutions in the purification steps were determined with a protein assay kit (Bio-Rad, Tokyo) using bovine serum albumin as the standard.
Characterization of the SACP protein
Protein purity during the column chromatography steps was checked by sodium dodecyl sulfate polyacrylamide gel electrophoresis (SDS-PAGE, 18% acrylamide) and staining with Coomassie Brilliant Blue G-250. The concentration of the purified SACP protein was determined spectrophotometrically using an extinction coefficient of 205 nm due to the peptide bond.Citation6)
The purified SACP protein solution was subjected to protein sequencing analysis with an automatic protein sequencer (Shimadzu PPSQ-31A, Kyoto). The purified SACP protein was air-oxidized or reduced with a grain of sodium dithionite. Visible absorption spectra (350–700 nm) of the oxidized and reduced SACP protein (6 μM) in 20 mM potassium phosphate (pH 7.0) were obtained with a JASCO V-530 spectrometer at 25 °C (Jasco, Tokyo). A far-UV circular dichroism (CD) spectrum (190–260 nm) of the oxidized SACP protein was also obtained to examine the secondary structure using a JASCO J-820 spectrometer.
Thermal stability measurements involving CD
Thermal denaturation experiments were carried out by monitoring CD spectra in a pressure-proof cell compartment (Jasco, Tokyo) attached to a JASCO J-820 CD spectrometer.Citation7) An air-oxidized SACP protein solution (20 μM) in 20 mM potassium phosphate (pH 7.0) was analyzed. The temperature-dependent CD ellipticity change at 222 nm was monitored in a cuvette of 1 mm path-length. CD values were recorded from 25 to 110 °C at intervals of 0.5 °C at a heating rate of 1.0 °C/min. The conditions for this thermal denaturation experiment were exactly the same as those previously used for AVCP and PHCP in order to compare the results obtained.Citation3)
The raw data were subjected to nonlinear least-squares fitting, as described previously.Citation3) The data points were corrected for the slopes of the baselines for the native and denatured forms, and were normalized to calculate the fraction of protein denatured. The fraction denatured was plotted as a function of temperature, and the resulting thermal denaturation curves were used to determine the temperature at the midpoint of the transition (Tm) and the enthalpy change (∆H) during protein denaturation at Tm of SACP. The calculation was performed by curve fitting of the resulting CD values versus the temperature by van’t Hoff analysis. The fitting curves obtained in the temperature range of −40 to +40 °C of Tm were used to calculate thermodynamic parameters in order to reflect protein denaturation precisely. The entropy change (∆S) during protein denaturation at Tm was calculated with the equation ∆S = ∆H/Tm.
Reversibility of protein thermal denaturation was examined as follows: After heating of the SACP protein solution to 75 °C, the sample was maintained at this temperature for 5 min. Then, it was cooled to 35 °C for further measurement of the temperature-dependent CD ellipticity change at 222 nm as described above.
Results and discussion
Protein purification
From 70 g of S. amazonensis cells (equivalent to six grams of soluble protein), 0.8 mg of the purified SACP protein was obtained through the column chromatography steps (Fig. ). The estimated molecular mass of the SACP protein on the SDS-PAGE gel was 14 kDa, which was close to those of other cytochromes c′ isolated from various bacteria.Citation6)
Fig. 1. Purification of the S. amazonensis cytochrome c′ (SACP).
Notes: Lane 1, molecular mass markers; lane 2, total soluble extract of S. amazonensis cells; lane 3, DEAE batch elution with 0.15 M NaCl; lane 4, HiTrap Q linear gradient (0–0.3 M NaCl) elution with 0.15 M NaCl; lane 5, HiTrap SP linear gradient (0–0.3 M NaCl) elution with 0.15 M NaCl; and lane 6, Superdex 75 elution. One to ten micrograms of protein was loaded per lane, and the gel was stained with Coomassie Brilliant Blue G-250. The arrow indicates the position of the SACP protein.
Amino acid sequence
The N-terminal amino acid sequence up to the 5th residue of the SACP protein was determined to be NNFES with an automatic protein sequencer. A BLAST search indicated that the sequence determined coincided with a putative N-terminal sequence of mature cytochrome c′ in the S. amazonensis genome database (Fig. ), the whole SACP amino acid sequence having been deduced. The consensus CXXCH heme binding motif was near the C-terminus,Citation8) similar to other cytochromes c′ such as AVCP and PHCP. Thus, we here successfully obtained an authentic mature SACP protein comprising 129 amino acid residues, this number being also close to those of other cytochromes c′.
Fig. 2. Multiple sequence analysis of mature cytochrome c′ proteins.
Notes: The N-terminal sequence of the SACP protein was chemically determined up to the 5th residue in this study. Identical residues in the sequences of SACP, AVCP, or PHCP are boxed. Gaps in the alignment of the three sequences and α-helical regions of AVCP determined on its X-ray crystal structure analysis (PDB code: 1BBH) are indicated by dashes and underbars, respectively. Gly residues within the putative α-helical regions are highlighted by shadowing.
Three-dimensional structure simulation
Since the SACP protein sequence was the most homologous (e.g. 45% identity) to that of Rhodocyclus gelatinosus cytochrome c′ (RGCP)Citation9) among cytochromes c′ for which three-dimensional structure analysis had been successful, the SACP structure was simulated using that of RGCP (PDB code: 1JAF) through SWISS-MODEL.Citation10) The simulated main chain structure of SACP and the crystal structure of AVCP main chain could be superimposed (Fig. ), indicating that the SACP protein has the same α-helical regions to those in the X-ray crystal structure of the AVCP protein. The PHCP structure could be simulated through SWISS-MODEL based on the 55% identity with the AVCP structure, and its main chain could also be superimposed on that of AVCP data (not shown). Therefore, the three proteins, SACP, AVCP, and PHCP, appeared to have similar overall main chain structures. In addition, the same simulation indicated that Phe-17 in the SACP protein occupied around the 6th coordination site of the heme,Citation11) similar to RGCP (Fig. ). Therefore, the heme environments in the three proteins resembled each other.
Fig. 3. Three-dimensional structure comparison.
Notes: The SACP model was built by homology modelling at the SWISS-MODEL workplace using the RGCP structure (PDB code: 1JAF) as the template. The simulated main chain structure of SACP is shown in black, and that of AVCP and its heme in gray. N- and C-termini are indicated by N and C, respectively. The relevant amino acid residues appeared in the text (Phe-17, Ala-21, and four Gly residues in the α-helices) are also indicated.
Spectral analysis
The visible absorption spectra of the air-oxidized and dithionite-reduced SACP protein were essentially the same as those reported for other cytochromes c′ (Fig. (A)), e.g. typical peaks at 425 and 630 nm were observed for the reduced and oxidized SACP protein, respectively, indicating a pentacoordinate heme group. From the CD ellipticity peak height of the SACP protein at 222 nm (Fig. (B)), its helical content was calculated to be 67.2%. This value was close to those for other cytochromes c′ including AVCP and PHCP.Citation12) These spectral features confirm that the SACP protein obtained has a similar heme environment and overall secondary structure to those of AVCP and PHCP.
Fig. 4. Spectral analysis of the SACP protein.
Notes: (A) Visible absorption spectra. (B) CD spectrum. Black and gray solid lines represent the spectra of oxidized and reduced proteins, respectively. Specific wavelengths referred in the text are indicated by arrows in panels A and B.
Thermal denaturation of the SACP protein, as measured by CD
Thermal denaturation experiments involving CD spectral analysis were performed with monitoring at 222 nm. The air-oxidized SACP protein solution in 20 mM potassium phosphate buffer (pH 7.0) gave an S-shaped curve (Fig. ). The value for the transition temperature (Tm) during thermal denaturation of the SACP protein was 62 °C, i.e. 10 °C higher than that for the AVCP protein and 25 °C lower than that for the PHCP protein, showing that the thermal stability of SACP was intermediate between those of AVCP and PHCP as to Tm.Citation13)
Fig. 5. Thermal denaturation of the SACP protein, as measured by CD.
Notes: Normalized raw data are shown by filled circles with a temperature interval of 2 °C. The fitting curve obtained from the SACP data with a temperature interval of 0.5 °C is shown as a solid black line. The fitting curves for AVCP (solid gray line) and PHCP (dashed black line) obtained under the same experimental conditions are redrawn based on the previous results.Citation3)
The SACP protein once denatured at 75 °C returned to the native form at 35 °C and was then thermally denatured exactly the same as in Fig. under the present experimental conditions; thus, the thermal denaturation proceeded reversibly, providing equilibrium thermodynamic parameters (Table ). At Tm of the SACP protein, the ∆H and ∆S values were obtained, which were then compared with the previously published values for AVCP and PHCP obtained under the same experimental conditions at the respective Tm (Table ). The ∆H and ∆S values for SACP were 1.5 and 1.4 times higher than those for AVCP, respectively. Generally, a larger ∆H value means higher stability, and conversely, a larger ∆S value means lower stability. The present results indicate that the native SACP protein is enthalpically stabilized in view of the large ∆H value, as compared with that of AVCP, which is partly and entropically mitigated by the accompanying increase in the ∆S value. In contrast, the ∆H and ∆S values for SACP were 0.7- and 0.8-fold of those for PHCP, respectively. Therefore, the native PHCP protein is enthalpically stabilized, as compared with the native SACP protein, which is entropically mitigated. These results further indicate that the stability of SACP is thermodynamically intermediate between those of AVCP and PHCP.
Table 1. Thermodynamic parameters obtained for thermal denaturation, as measured by CD.
Relationship between thermal stability and growth temperature
Comparison of the whole amino acid sequence including gaps (Fig. ) revealed that SACP was 28.1% identical to both AVCP and PHCP, the latter two being 55.0% identical. These results indicate that SACP among the three cytochromes c′ diverged much earlier than AVCP and PHCP did. Therefore, although SACP might have evolved distantly from AVCP and PHCP, the order of their thermal stability levels is in accordance with that of the optimal growth temperatures of the source bacteria. In addition, the three bacteria each have a distinctive growth temperature range; A. vinosum grows optimally at 25 °C, but cannot grow at 37 °C,Citation13) which is the optimal growth temperature of S. amazonensis. H. thermoluteolus grows optimally at 52 °C, and in turn, only poorly grows at 35 °C.Citation14) The thermal stabilities of present three cytochromes c′ may also have been optimized in accordance with the bacterial growth temperature ranges.
Thermal stability mechanism underlying the three cytochromes c′
Empirical prediction has suggested that Gly is an α-helix-breaking residue,Citation15) thus having negative effects on protein stability. This prediction can be applied to the present three cytochromes c′. From the previous sequence comparison between AVCP and PHCP, the lower number of Gly residues (total three) in the putative α-helical regions in PHCP appeared to be responsible for its higher stability than that of AVCP, which has seven Gly residues in the corresponding regions.Citation3) As to SACP, it has four Gly residues in the corresponding regions (Figs. and ). The differences in the numbers of Gly residues reflect the differences in thermal stability of the three cytochromes c′.
Remarkably, Gly-21 in the AVCP helix corresponded to Ala in the PHCP one, and the Gly-21 to Ala mutation in the former resulted in enhanced thermal stability compared with that of the wild type, and vice versa, the Ala-201 to Gly mutation in the PHCP protein resulted in decreased stability (our unpublished results, which will be published elsewhere soon). The corresponding residue in the SACP protein is Ala-21, similar to PHCP (Figs. and ). Therefore, Ala-21 is a candidate residue responsible for the SACP stability, as compared with that of AVCP. The SACP structure simulation suggests that side chain of Ala-21 contacts hydrophobically with heme (Fig. ), which may result in the higher stability than that of AVCP having Gly residue at the corresponding position, consistent with the empirical prediction by Chou and Fasman.Citation15)
If the present structure simulations (Fig. ) were the case, a five-residue gap was found in the SACP sequence between the 2nd and 3rd putative α-helical regions (Fig. ). This gap may not be related to the thermal stability differences among the three proteins, because the highest and lowest stabilities were obtained for PHCP and AVCP, respectively, both of which have no gap sequence.
Perspective
In the future, structural and mutagenesis studies will be carried out on the SACP protein; the results of which will be then compared with those for AVCP and PHCP. Furthermore, undefined homologous cytochromes c′ from psychrophilic Shewanella species will be of interest if their stability can be compared with the present results for the SACP protein isolated from mesophilic S. amazonensis. These studies will shed light on the protein stabilization mechanism of cytochromes c′, which are structurally similar and available from environments with a wide range of temperatures.
Funding
This work was supported by a Grant-in-Aid for Scientific Research from the Ministry of Education, Culture, Sports, Science and Technology of Japan [grant number 26240045], a grant from the Japan Society for the Promotion of Science [grant number 25–1446].
Acknowledgements
This work was performed under the Cooperative Research Program of the “Network Joint Research Center for Materials and Devices”. The N-terminal SACP protein sequence was determined at Okayama University.
References
- Ren Z, Meyer T, McRee DE. Atomic structure of a cytochrome c’ with an unusual ligand-controlled dimer dissociation at 1.8 Å resolution. J. Mol. Biol. 1993;234:433–445.10.1006/jmbi.1993.1597
- Stevanin TM, Moir JWB, Read RC. Nitric oxide detoxification systems enhance survival of Neisseria meningitidis in human macrophages and in nasopharyngeal mucosa. Infect. Immun. 2005;73:3322–3329.10.1128/IAI.73.6.3322-3329.2005
- Fujii S, Masanari M, Inoue H, Yamanaka M, Wakai S, Nishihara H, Sambongi Y. High thermal stability and unique trimer formation of cytochrome c’ from thermophilic Hydrogenophilus thermoluteolus. Biosci. Biotechnol. Biochem. 2013;77:1677–1681.10.1271/bbb.130226
- Venkateswaran K, Dollhopf ME, Aller R, Stackebrandt E, Nealson KH. Shewanella amazonensis sp. nov., a novel metal-reducing facultative anaerobe from Amazonian shelf muds. Int. J. Syst. Bacteriol. 1998;48:965–972.10.1099/00207713-48-3-965
- Takenaka S, Wakai S, Tamegai H, Uchiyama S, Sambongi Y. Comparative analysis of highly homologous Shewanella cytochromes c5 for stability and function. Biosci. Biotechnol. Biochem. 2010;74:1079–1083.10.1271/bbb.100017
- Inoue H, Wakai S, Nishihara H, Sambongi Y. Heterologous synthesis of cytochrome c’ by Escherichia coli is not dependent on the system I cytochrome c biogenesis machinery. FEBS J. 2011;278:2341–2348.10.1111/j.1742-4658.2011.08155.x
- Yamanaka M, Mita H, Yamamoto Y, Sambongi Y. Heme is not required for Aquifex aeolicus cytochrome c555 polypeptide folding. Biosci. Biotechnol. Biochem. 2009;73:2022–2025.10.1271/bbb.90220
- Bergmann DJ, Zahn JA, DiSpirito AA. Primary structure of cytochrome c’ of methylococcus capsulatus bath: evidence of a phylogenetic link between P460 and c’-type cytochromes. Arch. Microbiol. 2000;173:29–34.10.1007/s002030050004
- Archer M, Banci L, Dikaya E, Romo MJ. Crystal structure of cytochrome c’ from Rhodocyclus gelatinosus and comparison with other cytochromes c’. J. Biol. Inorg. Chem. 1997;2:611–622.10.1007/s007750050176
- Biasini M, Bienert S, Waterhouse A, Arnold K, Studer G, Schmidt T, Kiefer F, Cassarino TG, Bertoni M, Bordoli L, Schwede T. SWISS-MODEL: modelling protein tertiary and quaternary structure using evolutionary information. Nucleic Acids Res. 2014;42:W252–W258.10.1093/nar/gku340
- Russell HJ, Hardman SJO, Heyes DJ, Hough MA, Greetham GM, Towrie M, Hay S, Scrutton NS. Modulation of ligand-heme reactivity by binding pocket residues demonstrated in cytochrome c’ over the femtosecond-second temporal range. FEBS J. 2013;280:6070–6082.10.1111/febs.12526
- Fujii S, Masanari M, Yamanaka M, Wakai S, Sambongi Y. High stability of apo-cytochrome c’ from thermophilic Hydrogenophilus thermoluteolus. Biosci. Biotechnol. Biochem. 2014;78:1191–1194.10.1080/09168451.2014.912120
- Holm HW, Vennes JW. Occurrence of purple sulfur bacteria in a sewage treatment lagoon. Appl. Microbiol. 1970;19:988–996.
- Goto E, Kodama T, Minoda Y. Isolation and culture conditions of thermophilic hydrogen bacteria. Agric. Biol. Chem. 1977;41:685–690.10.1271/bbb1961.41.685
- Chou PY, Fasman GD. Empirical predictions of protein conformation. Ann. Rev. Biochem. 1978;47:251–276.10.1146/annurev.bi.47.070178.001343