
Abstract
We investigated the efficacy of supplementing the diet with pteroylmonoglutamic acid (PGA), choline, or phosphatidylcholine (PC) in ameliorating the lipid accumulation in rat liver that is induced by vitamin B6 (B6) deficiency. In Experiment 1, male Wistar rats were fed a control, B6-deficient, or PGA-, choline-, or PC-supplemented (10 mg, 4 g, and 6.3 g/kg of diet, respectively) B6-deficient diet containing l-methionine at 9 g/kg of diet for 35 days. In Experiment 2, rats were fed a control, B6-deficient, or PC-supplemented (at 3.15, 6.3, or 12.6 g PC/kg of diet) B6-deficient diet for 35 days. Choline or PC supplementation ameliorated liver lipid deposition and returned plasma lipids to normal. Judging from these results, it appeared that B6 deficiency decreased the synthesis of PC in the liver, thereby decreasing the secretion of very low-density lipoproteins, and in consequence producing lipid accumulation in the liver and reductions of plasma lipids.
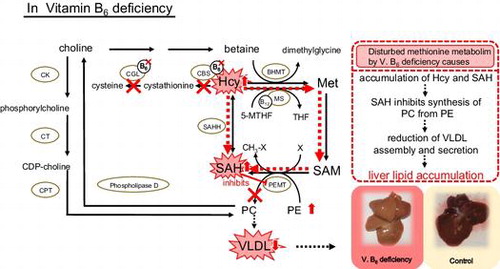
Vitamin B6 deficiency caused lipid accumulation in liver owing to decreased secretion of VLDL which was reduced by decreased synthesis of PC by disturbed methionine metabolism.
Introduction
Vitamin B6 (B6) participates in methionine (Met) metabolism as a coenzyme (Fig. ). Previous studies have shown that deficiency of B6 increased the levels of homocysteine (Hcy) in the plasma and liver of rats, the former being an independent risk factor for cardiovascular disease.Citation1,2) Vitamin B6 is involved in the catabolism of Hcy as pyridoxal 5′-phosphate (PLP), which is a coenzyme of cystathionine β-synthase (EC 4.2.1.22; CBS) and cystathionine γ-lyase (EC 4.4.1.1; CGL) (Fig. ). Thus, deficiency of B6 reduces the activities of CBS and CGL, leading to increases of Hcy in liver and plasma.
Table 1. Composition of the experimental diets (g/kg diet) (Exps. 1 and 2).
Fig. 1. Metabolic pathways linking methionine and lipid metabolism.
Notes: BHMT, betaine–homocysteine methyltransferase; CBS, cystathionine β-synthase; CDP–choline, cytidine diphosphate–choline; CGL, cystathionine γ-lyase; CK, choline kinase; CPT, choline phosphotransferase; CT, phosphocholine cytidylyl transferase; Hcy, homocysteine; Met, methionine; MS, methionine synthase; 5-MTHF, 5-methyltetrahydrofolate; PC, phosphatidylcholine; PE, phosphatidylethanolamine; PEMT, phosphatidylethanolamine N-methyltransferase; PLP, pyridoxal 5′-phosphate; SAH, S-adenosylhomocysteine; SAM, S-adenosylmethionine; THF, tetrohydrofolate.
Hcy can be remethylated to Met by vitamin B12-dependent methionine synthase (EC 2.1.1.13; MS) (Fig. ). The methyl group in 5-methyltetrahydrofolate (5-MTHF) is firstly transformed on cobalamin and secondarily transformed to Hcy. During the reactions, the complex of MS–cobalamin is oxidized and converted to inactive form. The inactive form is reactivated by the presence of NADPH. In our previous experiments, pteroylmonoglutamic acid (PGA) supplementation ameliorated the hyperhomocysteinemia caused by B6 deficiency, presumably as a consequence of enhanced removal of Hcy by MS.Citation3) In addition, PGA supplementation tended to suppress the increase in liver weight to which lipid deposition contributes.
It has been reported that B6 deficiency was sometimes accompanied by fat deposition in the livers of rats fed a 70% casein diet.Citation4) This was not consistently observed in our B6-deficient rats. However, Yamamoto et al.Citation5) found that supplemental l-Met (9 g/kg of diet) during B6 deficiency caused an accumulation of lipids in the liver (pair-fed control: 52.1 ± 1.1 mg/g liver, B6 deficiency: 189.1 ± 30.6 mg/g liver (p = 0.0039; using Mann–Whitney U-test)) with concomitant severe hyperhomocysteinemia. Therefore, it was speculated that disturbed Met metabolism as a consequence of B6 deficiency might be a factor in the deposition of lipids in the livers of B6-deficient rats. However, the details of the mechanism and its reduction by dietary manipulation are not clear.
If disturbed metabolism of Met, especially Hcy accumulation, is involved in the lipid accumulation in the livers of B6-deficient rats, PGA, choline, and phosphatidylcholine (PC) might alleviate it, because an alternative pathway for Hcy metabolism is provided by the betaine–homocysteine methyltransferase (EC 2.1.1.5;BHMT) pathway, in which betaine acts as the methyl donor (Fig. ). Betaine is a metabolite of choline, which animals obtain primarily from the diet or the catabolism of PC.Citation6) Therefore, in this study, we examined the effects of PGA, choline, or PC supplementation on liver lipid accumulation in rats fed a B6-deficient l-Met-supplemented diet to investigate the mechanism of liver lipid accumulation caused by B6 deficiency in relation to Met metabolism.
Materials and methods
Animals
The study was approved by the Committee for Animal Research and Welfare of Gifu University on the Proper Use of Laboratory Animals. Male 4-week-old Wistar rats weighing 80–100 g were obtained from SLC (Hamamatsu, Japan). The rats were housed individually in stainless steel wire-bottomed cages in an animal room at 23 ± 1 °C in an inverted 12-h light–dark cycle (light on at 06:00 h) and were acclimatized to an AIN-76 diet for 5 days before the start of each feeding experiment.
Diets and experimental procedures
In Experiment 1, the rats were randomly divided into five groups (n = 7 each) that were fed one of the following experimental diets: an AIN-76 diet-based control diet (C), a B6-deficient diet (D), and B6-deficient diets supplemented with PGA (10 mg of PGA/kg of diet; PGA10D), choline (4 g of choline bitartrate/kg of diet; Ch4D), or PC (6.3 g of soybean phosphatide extract/kg of diet; PC6D). The PGA10D diet contained fivefold the amount of PGA, and the Ch4D diet contained twofold the amount of choline, compared to the C diet. The PC6D diet contained the same amount of choline in PC as did the Ch4D diet. All diets contained 9 g of l-Met per kg. The compositions of the experimental diets are shown in Table . The D group had free access to the D diet, and the other groups were pair-fed to the D group. Body weight was measured daily at about 10:00 h.
In Experiment 2, the rats were randomly divided into five groups (n = 7 each) that were fed one of the following diets supplemented with l-Met at 9 g/kg of diet: an AIN-76-based control diet (C), a B6-deficient diet (D), and three B6-deficient diets supplemented with graded levels of PC (3.15, 6.3, and 12.6 g of PC/kg of diet, designated respectively as PC3D, PC6D, and PC12D). The compositions of the diets are shown in Table . This experiment was conducted under the same protocol as Experiment 1.
In both experiments, after 35 days of feeding, the rats were anesthetized with diethyl ether, and blood was collected via the abdominal aorta with a heparinized syringe. Livers were immediately excised, rinsed in ice-cold 0.25 M sucrose, blotted on paper towels, and immediately frozen in liquid nitrogen. Plasma was obtained from the heparinized whole blood by centrifugation at 2000 × g (4 °C) for 15 min. The plasma and liver were stored at −20 °C until analyzed.
Materials
Vitamin-free casein, gelatinized starch, cellulose powder, and AIN-76 mineral mixture were purchased from Oriental Yeast (Tokyo, Japan). Choline bitartrate and l-Met were purchased from Wako Pure Chemical Industries (Osaka, Japan). Retinol acetate was purchased from Sigma-Aldrich Japan (Tokyo, Japan). Soybean phosphatide extract (PC 95%, Avanti Polar Lipids, Alabama, USA) was purchased from Funakoshi (Tokyo, Japan). S-Adenosylhomocysteine (SAH), S-adenosylmethionine (SAM), and L-α-phosphatidylcholine from egg yolk (Type XI-E) and L-α-phosphatidylethanolamine from egg yolk (Type III) were purchased from Sigma-Aldrich (St. Louis, MO, USA). N-Acetyl-l-cysteine, 4-fluoro-7-sulfobenzofurazan ammonium salt, and 1-heptanesulfonic acid sodium salt were purchased from Wako Pure Chemical Industries (Osaka, Japan). Methanol and acetonitrile (HPLC grade) were from Kanto Chemical (Tokyo, Japan). The other reagents were purchased from Nacalai Tesque (Kyoto, Japan), unless otherwise indicated.
Measurement of lipid concentrations in plasma and liver
Liver total lipids were extracted by the method of Folch et al.Citation7) The concentrations of total lipids, total cholesterol (TC), and triglyceride (TG) in the extract were measured by a conventional gravimetric method, the Zak Henly method,Citation8) and the Triglyceride G-test Wako (Wako Pure Chemical Industries, Osaka, Japan), respectively.
The concentrations of PC and phosphatidylethanolamine (PE) in liver total lipid extract were measured by isocratic HPLC with ultraviolet detection (210 nm).Citation9) The analytical conditions were as follows: column, TSKgel Silica-60 (4.6 mm I.D. × 25 cm); mobile phase, acetonitrile/methanol/85% phosphoric acid = 180/4/3; flow rate, 1.0 mL/min; standard substances, L-α-phosphatidylcholine from egg yolk (Type XI-E); and L-α-phosphatidylethanolamine from egg yolk (Type III).
Concentrations of plasma TC, high-density lipoprotein cholesterol (HDL-C), TG, and phospholipid (PL) were determined by enzymatic methods, using the Cholesterol E-test Wako, HDL cholesterol E-test Wako, Triglyceride G-test Wako, and Phospholipid C-test Wako (Wako Pure Chemical Industries, Osaka, Japan), respectively. The difference between TC concentration and HDL-C concentration was regarded as the very low-density lipoprotein (VLDL) + low-density lipoprotein (LDL)-cholesterol ((VLDL + LDL)-C) concentration.
Measurement of methionine metabolites in plasma and liver
Plasma and liver total Hcy were measured by the method of Yamaguchi et al.Citation10) which uses an isocratic HPLC system equipped with a fluorescence detector (Ex. 380 nm; Em. 525 nm). Liver SAM and SAH contents were measured by the method of She et al.Citation11) using isocratic HPLC with ultraviolet detection (254 nm).
Analysis of vitamin B6 in plasma and liver
PLP levels in liver and plasma were determined by isocratic HPLC with fluorescence detection (Ex. 320 nm; Em. 420 nm), using the method of Tsuge.Citation12)
Statistical analysis
Data are expressed as means ± standard error (SE). Statistical analyses were performed using Excel Toukei 2006 for Windows (Social Survey Research Information, Tokyo, Japan). Differences between means were considered to be significant at p < 0.05, according to one-way ANOVA followed by Tukey’s multiple comparison test.
Results
Growth parameters (Experiment 1)
Final body weight, total food intake, and liver weight did not differ among the five experimental groups (Table ).
Table 2. Body weight gain, total food intake, liver weight, and liver and plasma lipid concentrations of rats fed the experimental diets (Exp. 1).
Liver and plasma lipid profiles (Experiment 1)
Contents of TG and TC in the livers of the D group were significantly greater than those of the C group (Table ). Contents of liver total lipids were also greater in the D group than in the C group, although the difference was not statistically significant. In contrast, concentrations of plasma TC and (LDL + VLDL)-C in the D group were significantly lower than those in the C group. Liver lipids in the Ch4D and PC6D groups were decreased relative to the D group, although this was not statistically significant. Concentrations of TC and (LDL + VLDL)-C in the plasma of the PC6D group were significantly increased relative to the D group, and those in the Ch4D group were also increased compared with the D group, although not by an amount that was statistically significant. Lipid profiles in liver and plasma were not remarkably different between D and PGA10D groups.
Methionine metabolites and vitamin B6 status in liver and plasma (Experiment 1)
Liver and plasma Hcy were significantly increased in the B6-deficient (D, PGA10D, Ch4D, and PC6D) groups compared with the C group (Table ). Contents of Hcy in the livers of the PGA10D and PC6D groups were about half of that in the D group, although statistical significance was not observed. Contents of liver SAH in the D and Ch4D groups were significantly greater than in the C group. However, those in the PGA10D and PC6D groups were not significantly increased compared with the C group. Liver SAM/SAH ratios in the D, PGA10D, and Ch4D groups were significantly lower than that in the C group. Liver and plasma PLP were significantly lower in the four B6-deficient groups compared with the C group (Table ).
Table 3. Status of methionine metabolites and PLP in liver and plasma of rats fed with the experimental diets (Exp. 1).
Growth parameters (Experiment 2)
Final body weight and total food intake did not differ among the five experimental groups (Table ). The liver weight in the D group was greater than those in the other four groups, although the differences were not statistically significant.
Table 4. Body weight gain, total food intake, liver weight, and liver and plasma lipid concentrations of rats fed with the experimental diets (Exp. 2).
Liver and plasma lipid profiles (Experiment 2)
The content of TG in the liver was significantly greater in the D group than in the C group, and those in the PC6D and PC12D groups were significantly lower than that in the D group (Table ). Contents of total lipids and TC in the D group were double those in the other four groups, although the differences were not statistically significant. The content of PC in liver showed no statistically significant difference, but the content of PE was significantly greater in the D group than in the C group. Liver PC/PE ratio had no statistically significant difference.
By contrast, concentrations of TC, (LDL + VLDL)-C, and PL (PC) in the plasma of the D group were significantly lower than those of the C group. Although B6 deficiency induced hypocholesterolemia in the D group, these concentrations were gradually increased as the dietary PC supplementation level increased. The concentration of HDL-C in plasma showed no statistically significant differences among the five experimental groups.
Methionine metabolites in liver and plasma (Experiment 2)
Levels of Hcy in liver and plasma, and SAH in liver were significantly greater in the D group than in the C group, but lower in the PC3D, PC6D, and PC12D groups than in the D group, although in the latter cases the differences were not statistically significant (Table ). Liver SAM/SAH ratios were lower in the B6-deficient groups (D, PC3D, PC6D, and PC12D) than in the C group, although again the differences were not statistically significant.
Table 5. Status of methionine metabolites in liver and plasma of rats fed with the experimental diets (Exp. 2).
Discussion
This study was undertaken to understand the mechanism of liver lipid accumulation in rats fed a l-Met-supplemented B6-deficient diet. In rats fed a B6-deficient diet, total lipids, TG, and TC in the liver increased relative to those in the control rats (Tables and ). On the other hand, rats fed a choline or PC-supplemented B6-deficient diet showed a smaller accumulation of these lipids in liver compared with the B6-deficient rats (Tables and ). There was a difference in total lipid content in “C” of Exps. 1 and 2 (Tables and ), in the former being 84.0 ± 5.0 mg/g of liver and in the latter 46.1 ± 2.0 mg/g of liver. We adopted pair-feeding to minimize dispersion in dietary intake because B6 deficiency caused decreased dietary intake. Although these two experiments were conducted on the same experimental protocol, food intake in the D group of Exp. 2 started to reduce at earlier stage of feeding period. This meant that B6 deficiency begun earlier in Exp. 2 than in Exp. 1. So, dietary intake in the C group of Exp. 2 was low as compared to Exp. 1. We are thinking that this might be the reason why total lipid in liver of the C group was lower in Exp. 2 compared to Exp. 1. As for plasma lipids, rats fed a B6-deficient diet had decreased concentrations of TC, (LDL + VLDL)-C, TG, and PC in plasma compared to the control rats (Tables and ). Although B6 deficiency induced hypocholesterolemia, these reductions were ameliorated when the B6-deficient diet was supplemented with choline or PC (Tables and ). The effect of PC supplementation was much greater than that of choline. The effective supplemental level of PC in the diet was estimated to be 6.3 g/kg diet or more (Table ).
To determine the relationship between liver lipid deposition and disturbed Met metabolism in B6 deficiency, we analyzed some of the Met metabolites. In the B6-deficient rats, Hcy in the liver and plasma and SAH in the liver were significantly increased, and in the liver, the SAM/SAH ratio, the index parameter of methylation, decreased significantly (Tables and ) in agreement with the results of previous studies.Citation3,5,13–16) In one of the Hcy metabolic pathways, the trans-sulfuration pathway, Hcy is metabolized to cystathionine by CBS, which requires PLP as a coenzyme (Fig. ). In B6 deficiency, CBS activity was reduced because of decreased PLP; thus, Hcy metabolism to cystathionine was impaired.Citation17) As a result, Hcy accumulated in the liver, and this led to increased Hcy in the plasma. Moreover, accumulated Hcy caused an increase in liver SAH, because the equilibrium of Hcy and SAH was toward SAH.Citation16) We sometimes get annoyed by individual variability in the level of methionine metabolites. Content of SAH in liver was usually 30–60 nmol/g of liver; however, individual with high liver SAH in the C group of Exp. 2 increased mean of SAH with concomitant increase in SE compared to Exp. 1. This was also true for the D groups (Tables and ). Standard errors in these groups were larger in both Exp. 1 and Exp. 2. A little higher SAH in the D group of Exp. 2 might be ascribed to the progress of B6 deficiency, which was severe in Exp. 2 as noted above in total lipid section.
Phosphatidylcholine can be synthesized in the liver via two pathways: the cytidine diphosphate–choline (CDP–choline) pathway, and the PE methylation pathway by phosphatidylethanolamine N-methyltransferase (EC 2.1.1.17; PEMT), both of which are linked to Met metabolism (Fig. ).Citation18) The CDP–choline pathway requires choline, which is obtained either from the diet or from the metabolism of PC.Citation19) The CDP–choline pathway and Met metabolism are linked via choline, because choline is a precursor of betaine, which is an alternative methyl donor in Hcy methylation.Citation20) The PE methylation pathway requires SAM as the methyl donor. This reaction is not only influenced by the availability of SAM, but is also inhibited by SAH.Citation21) Thus the SAM/SAH ratio regulates the PE methylation pathway.Citation14) In the present study, SAH increased and the SAM/SAH ratio decreased significantly in the livers of B6-deficient rats (Tables and ). Moreover, PE in the liver increased significantly in B6-deficient rats compared with control rats. It was suggested that accumulated SAH caused an increase in liver PE through an inhibition of PEMT. Moreover, She et al.Citation13,14) reported that the content of microsomal PC in the liver decreased with a concomitant increase of PE in B6-deficient rats compared with the pair-fed control rats. In a similar fashion, Loo and SmithCitation22) reported B6 deficiency altered the methylation of PE and decreased the levels of microsomal PC. In the present study, we could not analyze PC and PE in microsome, but it was assumed that the PC supply via the PE methylation pathway became insufficient because of reduced PEMT activity in B6 deficiency.
It is known that VLDL exports lipids from the liver to peripheral tissuesCitation23) and that PC is an essential structural component of VLDL.Citation24,25) Endogenously synthesized lipids, particularly TG and cholesteryl ester, are incorporated into VLDL for transport via the blood circulation. Moreover, it was reported that the active synthesis of PC derived from PE was essential for the hepatic synthesis and secretion of VLDL.Citation24–27) However, in B6-deficient rats, plasma TG, TC, and PL (as PC) concentrations as well as plasma (LDL + VLDL)-C concentration decreased significantly (Tables and ). Consequently, it was speculated that the accumulation of liver lipids induced by B6 deficiency was accompanied by a reduction of VLDL secretion by the liver.
On the other hand, supplementation with choline or PC ameliorated the liver lipid accumulation, and returned the (LDL + VLDL)-C concentration in plasma toward normal (Tables and ). In addition, supplemental PC tended to recover the plasma TG and PL (as PC) concentrations as well (Table ). These results lead us to speculate that the deposition of lipids in the liver induced by B6 deficiency was effectively prevented by choline or PC supplementation, presumably because of recovery of VLDL secretion into the circulation by PC, which was impaired by B6 deficiency and recovered by either choline or PC supplementation.
According to several reports, rats fed a 70% casein diet without B6 showed marked accumulation of liver lipid.Citation4,28,29) In addition, serum PC concentration was significantly lower in B6-deficient rats than in pair-fed controls.Citation29) In an analogous fashion, Kaimoto et al.Citation30) reported that about 50% of rats fed a diet supplemented with branched-chain amino acids during B6 deficiency showed lipid deposition in the liver and tended to have decreased serum TG levels. Moreover, they found that rats with liver lipid deposition also had decreased TG and TC levels in VLDL. However, they could not determine the mechanism whereby lipid deposition occurred in B6 deficiency.
In our present experiments, supplementation with PGA had little effect on the alleviation of lipid metabolism in the liver and plasma in comparison with that of PC (Table ), although it was a little more effective than PC in alleviating the disturbance of Met metabolism (Table ). This might be because PGA had little effect on PC biosynthesis in the liver. Even in the control group, a normal amount of PGA was present in the diet. However, actual MS activity was decreased, as 5-MTHF is reduced by B6 deficiency.Citation3) Therefore, supplemental PGA had a small effect in alleviating abnormal Met metabolism,Citation3) but was not effective for maintaining PC biosynthesis. This is why PGA supplementation was less effective than PC supplementation.
In another remethylation pathway of Hcy, betaine is also an important substrate. Betaine is produced by oxidation of choline, which is derived from dietary PC.Citation6) Therefore, it was conceivable that supplemental PC produced betaine via choline and contributed to remethylation of Hcy by BHMT. However, addition of choline to the B6-deficient diet had only a small effect on the disturbance of Met metabolism relative to PC (Table ). Absorbed choline would be delivered to several tissues including the brain and used as a neurotransmitter.Citation19) So a smaller amount of choline reaches the liver as compared to PC. This might be the reason why supplemental choline was less effective than PC.
In conclusion, this study indicated that B6 deficiency caused liver lipid deposition with a reduction of plasma lipids. Judging from the liver and plasma lipid profiles, our results could be explained by decreased secretion of VLDL as a consequence of reduced synthesis of PC via the PE methylation pathway owing to the disturbance of Met metabolism produced by B6 deficiency. Choline or PC supplementation effectively stimulated the synthesis of PC from PE in the liver and thereby normalized lipid transport from the liver. In a future study, we intend to evaluate how VLDL secretion is affected by B6 deficiency and dietary supplementation.
Authors’ contributions
EK, KY, and TH designed the study. EK drafted the manuscript. TN reviewed the manuscript. TY took part in a part of analysis. All authors reviewed and approved the final manuscript.
Disclosure statement
The authors disclose no potential conflicts of interest.
References
- Boushey CJ, Beresford SA, Omenn GS, Motulsky AG. A quantitative assessment of plasma homocysteine as a risk factor for vascular disease. JAMA. 1995;274:1049–1057.
- Wald DS, Law M, Morris JK. Homocysteine and cardiovascular disease: evidence on causality from a meta-analysis. Br. Med. J. 2002;325:1202–1208.
- Yamamoto K, Isa Y, Nakagawa T, Hayakawa T. Involvement of 5-methyltetrahydrofolate in the amelioration of hyperhomocysteinemia caused by vitamin B6 deficiency and l-methionine supplementation. Biosci. Biotechnol. Biochem. 2013;77:378–380.
- Okada M, Ochi A. The effect of dietary protein level on transaminase activities and fat deposition in vitamin B6-depleted rat liver. J. Biochem. 1971;70:581–585.
- Yamamoto K, Isa Y, Nakagawa T, Hayakawa T. Folic acid fortification ameliorates hyperhomocysteinemia caused by a vitamin B6-deficient diet supplemented with l-methionine. Biosci. Biotechnol. Biochem. 2012;76:1861–1865.
- Zhaoyu Li, Vance DE. Phosphatidylcholine and choline homeostasis. J. Lipid Res. 2008;49:1187–1194.
- Folch J, Lees M, Sloane-Stanley GA. A simple method for the isolation and purification of total lipids from animal tissues. J. Biol. Chem. 1957;226:497–509.
- Kitamura M. Cholesterol. Rinsho Kagaku. 1971;1:19–25. (Japanese).
- Sakai H, Masada Y, Takeoka S, Tsuchida E. Characteristics of bovine hemoglobin as a potential source of hemoglobin-vesicles for an artificial oxygen carrier. J. Biochem. 2002;131:611–617.
- Yamaguchi A, Fukushi M, Mizushima Y, Sato M, Shimazu Y, Kikuchi Y, Takasugi N. High-performance liquid chromatographic measurement of total homocysteine and total cysteine in blood. Rinsho Shoni Igaku. 1989;37:109–113. (Japanese).
- She QB, Nagao I, Hayakawa T, Tsuge H. A simple HPLC method for the determination of S-adenosylmethionine and S-adenosylhomocysteine in rat tissues: the effect of vitamin B6 deficiency on these concentrations in rat liver. Biochem. Biophys. Res. Commun. 1994;205:1748–1754.
- Tsuge H. Determination of vitamin B6 vitamers and metabolites in a biological sample. Methods Enzymol. 1997;280:3–12.
- She QB, Hayakawa T, Tsuge H. Effect of vitamin B6 deficiency on linoleic acid desaturation in the arachido biosynthesis of rat liver microsomes. Biosci. Biotechnol. Biochem. 1994;58:459–463.
- She QB, Hayakawa T, Tsuge H. Alteration in the phosphatidylcholine biosynthesis of rat liver microsomes caused by vitamin B6 deficiency. Biosci. Biotechnol. Biochem. 1995;59:163–167.
- Nguyen TT, Hayakawa T, Tsuge H. Effect of vitamin B6 deficiency on the synthesis and accumulation of S-adenosylhomocysteine and S-adenosylmethionine in rat tissues. J. Nutr. Sci. Vitaminol. 2001;47:188–194.
- Isa Y, Tsuge H, Hayakawa T. Effect of vitamin B6 deficiency on S-adenosylhomocysteine hydrolase activity as a target point for methionine metabolic regulation. J. Nutr. Sci. Vitaminol. 2006;52:302–306.
- Smolin LA, Benevenga NJ. Factors affecting the accumulation of homocyst(e)ine in rats deficient in vitamin B-6. J. Nutr. 1984;114:103–111.
- Obeid R, Herrmann W. Homocysteine and lipids: S-adenosyl methionine as a key intermediate. FEBS Lett. 2009;583:1215–1225.
- Zeisel SH. Choline: critical role during fetal development and dietary requirements in adults. Annu. Rev. Nutr. 2006;26:229–250.
- Craig SA. Betaine in human nutrition. Am. J. Clin. Nutr. 2004;80:539–549.
- Hoffman DR, Haning JA, Cornatzer WE. Microsomal phosphatidylethanolamine methyltransferase: inhibition by S-adenosylhomocysteine. Lipids. 1981;16:561–567.
- Loo G, Smith JT. Effect of pyridoxine deficiency on phospholipid methylation in rat liver microsomes. Lipids. 1986;21:409–412.
- Karpe F. Postprandial lipoprotein metabolism and atherosclerosis. J. Intern. Med. 1999;246:341–355.
- Noga AA, Zhao Y, Vance DE. An unexpected requirement for phosphatidylethanolamine N-methyltransferase in the secretion of very low density lipoproteins. J. Biol. Chem. 2002;277:42358–42365.
- Noga AA, Vance DE. A gender-specific role for phosphatidylethanolamine N-methyltransferase-derived phosphatidylcholine in the regulation of plasma high density and very low density lipoproteins in mice. J. Biol. Chem. 2003;278:21851–21859.
- Yao Z, Vance DE. The active synthesis of phosphatidylcholine is required for very low density lipoprotein secretion from rat hepatocytes. J. Biol. Chem. 1988;263:2998–3004.
- Yao Z, Vance DE. Head group specificity in the requirement of phosphatidylcholine biosynthesis for very low density lipoprotein secretion from cultured hepatocytes. J. Biol. Chem. 1989;264:11373–11380.
- Suzuki K, Nakamura T, Fujita M, Iwami T, Abe M, Okada M. Factors affecting liver lipid content in pyridoxine-deficient rats. I. Dietary protein levels. J. Nutr. Sci. Vitaminol. 1976;22:291–298.
- Suzuki K, Okada M. Alterations of phospholipid and triglyceride metabolism in fatty liver caused by pyridoxine deficiency in rats. J. Nutr. Sci. Vitaminol. 1982;28:377–390.
- Kaimoto T, Shibuya M, Nishikawa K, Maeda H. High incidence of lipid deposition in the liver of rats fed a diet supplemented with branched-chain amino acids under vitamin B6 deficiency. J. Nutr. Sci. Vitaminol. 2013;59:73–77.