
Abstract
Nondestructive evaluation of photosynthesis is a valuable tool in the field and laboratory. Delayed luminescence (DL) can reflect charge recombination through the backflow of electrons. However, DL detection has not yet been adapted for whole plants in Petri dishes. To compensate for differences in DL decay between sibling Arabidopsis plants grown under the same conditions, we developed a time-sequential double measurement method. Using this method, we examined the influence of photosynthetic electron flow inhibitors, and differences in the DL decay curves were categorized by considering the initial and late phases of the decay curves, as well as their intermediate slopes. The appearance of concavity and convexity in DL curves in Arabidopsis was different from unicellular algae, suggesting complexity in the photosynthetic machinery of higher plants. This detection method should be invaluable for evaluating photosynthetic defects in higher plants under sterile conditions without interrupting plant culture.
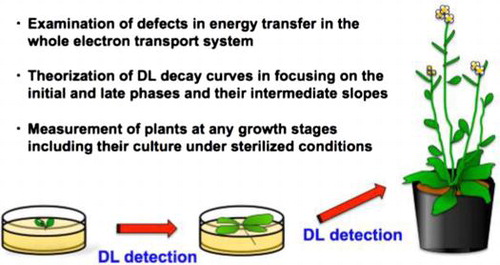
Graphical abstract
Nondestructive evaluation of photosynthesis by delayed luminescence (DL) in Arabidopsis with time-sequential double measurement to compensate for individual differences.
Photosynthesis is the most characteristic event in photosynthetic organisms such as plants. Studies of photosynthesis are important in the development of techniques to improve plant productivity for use as foods and biofuels. Nondestructive evaluation of photosynthesis, by which samples can be analyzed without damage and then used for further analysis or phenotypic observation after detection, is a highly valuable technique. Such techniques are also time-saving and economical. Chlorophyll (Chl) fluorescence is a phenomenon that can be observed nondestructively and has been widely used as a powerful technique in plant physiology.Citation1) A well-established nondestructive method for evaluating photosynthesis is pulse amplitude modulation (PAM) to characterize prompt Chl fluorescence. PAM detects fluorescence emission from photosystem (PS) II in response to pulse beams.Citation2) PAM has been employed as a powerful tool for evaluating photosynthetic activities, for example, in photo-oxidative stress in transgenic tobacco plants carrying Escherichia coli catalase Citation3) and for elucidating the mechanisms of cyclic electron flow around PS I and PS II.Citation4,5)
Strehler and Arnold discovered delayed light emission from plants after irradiation for several minutes.Citation6) The terms delayed light emission and delayed luminescence (DL) refer to the same phenomenon, which is also called delayed fluorescence (DF) but its restrictive meaning is the phenomenon in which the lifetime of the light emission is typically shorter. The emission spectra of DL and Chl fluorescence are essentially the same in plants, as well as in photosynthetic bacteria. These spectra indicate that both DL and Chl fluorescence come from the lowest excited singlet state of Chl a or bacteriochlorophyll a.Citation7) This is different from phosphorescence, which originates from an excited triplet state and has an emitting wavelength shifted to around 950 nm at a lower energy side of the spectrum compared with the excited singlet state.Citation8) DL is mostly generated by re-excitation of P680 via thermally activated backflow of electrons from stable charge separation states, eventually leading to the recombination of P680+ Phe– and the formation of P680*.Citation7) This process lasts up to a few minutes, occurs after illumination with light, and can be detected in the dark.Citation7) In contrast, Chl fluorescence is the prompt re-emission of absorbed light and normally disappears within a few nanoseconds of stopping the illumination of the sample.Citation2)
There have been some reports of the development of a DL detector that can measure DL decay curves in green algae. Studies on the effect of growth inhibitors on the green alga Pseudokirchneriella subcapitata found that the DL decay curves were correlated with algal growth inhibition, and the EC50 of the algal growth inhibitors was observed quite rapidly.Citation9,10) There have also been several reports of DL detection in plants, and there have been some developments in the use of DL to detect photosynthetic rates in the field.Citation11,12) For example, the influence of fertilizers on plants was evaluated via DL from the leaves of tomato, potato, and pea, showing that DL amplitude depended on nitrogen metabolic activity and on active PS II abundance changes.Citation13) Guo and Tan demonstrated, with their kinetics model in soybean, that plastoquinone (PQ)-related electron transport (QA−, QB−, and QB2−) can be monitored via DL.Citation14) DL has been used to evaluate photosynthetic rate and thus study many different phenomena, including plant circadian rhythms, plant senescence, nutrient effects, salt stress, drought stress, and the effects of herbicides.Citation15–18) Recent work has revealed that nondestructive evaluation methods are useful tools to detect temperature-dependent changes.Citation19–21)
It was revealed through DL detected in the single-cell green algae Chlorella that the two PSs absorb different wavelength of light.Citation22) DL was also used to evaluate the effect of nutrition deficiencies and environmental pollution on the unicellular green alga Scenedesmus obliquus.Citation23) The DL of the green algae Acetabularia acetabulum was also characterized.Citation24) The behavior of DL decay curves in response to electron transport inhibitors has been reported in P. subcapitata.Citation25) Therefore, DL is one of the variables that can be used to determine the state of photosynthetic electron transfer, as a sensitive intrinsic probe for photosynthesis.Citation26,27) However, the behavior of DL decay curves in the model plant Arabidopsis, which is advantageous because of the availability of a variety of mutants and several omics analyses such as transcriptomics, proteomics, and metabolomics, has not been examined. To use Arabidopsis in this post-genome era, an efficient methodology for evaluating photosynthetic defects is needed. Therefore, a way to characterize and categorize photosynthetic mutants and their defective events using DL is desirable. At the beginning of such a trial, we have established a DL detection method for Arabidopsis plants in Petri dishes.
Although PAM is a well-established method for measuring fluorescence emission, DL detection is becoming increasingly common. It does not require complicated tools, just a DL detector and a personal computer to interpret the data. PAM detects prompt Chl fluorescence, which reflects energy transfer events within a few nanoseconds, whereas DL can be influenced by events within a few minutes after Chl excitation. Accordingly, DL can be widely employed to complement PAM in the nondestructive evaluation of photosynthesis in higher plants. Here, we detected DL decay curves in Arabidopsis time-sequentially twice under sterile conditions using whole plants. First, we detected DL immediately after taking plants from their growth chambers and subjecting them to Chl excitation, and second, we detected DL after incubation in the dark and subsequent excitation. Together with the detection of electron transport rate (ETR) and non-photochemical quenching (NPQ) by PAM, we deduced the relationship between DL curves and their governing mechanisms.
Materials and methods
Test plants
A wild type of Arabidopsis thaliana, Columbia, was used in this study. The plants were cultured in Murashige–Skoog (MS) mediumCitation28) containing 2% sucrose in 3.5-cm-diameter Petri dishes. To examine the effect of growth period, culturing was conducted at 20 °C at 45 μmol photons m−2 s−1 for 2–4 weeks. To evaluate the influence of light intensity, plants were cultured under 15, 45, or 120 μmol photons m−2 s−1 for 2 weeks. For the chemical-treatment experiments, plants were cultured at 45 photons m−2 s−1. Three individual plants that were visibly similar in size were selected as samples for each condition. In all experiments, we grew the plants under continuous light to avoid any effects of circadian rhythm.
Tested chemicals
Antimycin A,Citation29) 3-(3,4-dichlorophenyl)-1,1-dimethylurea (DCMU),Citation30) and 2,5-dibromo-3-methyl-6-isopropyl-p-benzoquinone (DBMIB)Citation31) were tested for their effects on photosynthesis. Stock solutions of these chemicals were dissolved in N, N-dimethylformamide (DMF).Citation25) The working concentrations of DCMU, DBMIB, and antimycin A were 10 μM each.
Sample preparation for chemical exposure test
Sufficient amounts (7–10 mL) of 10 μM solutions of DCMU, DBMIB, and antimycin A were poured into 3.5-cm-diameter Petri dishes containing plants, the whole plants were soaked for 10 min, and the entire solution was discarded before detection. Plants without any chemical treatment and plants treated only with 0.1% DMF as a solvent were used as controls.
Measurement of DL
Fig. shows the front view of the experimental setup for measuring DL (TYPE-6100 prototype, Hamamatsu Photonics, Hamamatsu, Japan). A photomultiplier tube detected the signal. Excitation light was provided by 695-nm red-light-emitting diodes (LEDs). A Petri dish holder above the LEDs held a Petri dish containing the test plant at a fixed position. The photomultiplier tube was optically separated from the LED light by a shutter (PMT shutter) in front of the photomultiplier tube. Excitation light from the 695-nm LEDs was irradiated on samples from the bottom of the chamber. A lens was connected to relay the DL emission from the plant to a photocathode. The device was equipped with a multi-alkali-type side-on photomultiplier tube with band-pass filter to restrict the wavelength sensitivity in the range of 630–740 nm. The signals were then transferred to a computer via a USB interface.
Fig. 1. Front view of the experimental setup used to measure DL.
First, a Petri dish containing a plant was placed on the Petri dish holder, and the measurement was started. For the first detection, the excitation light (45 μmol photons m−2 s−1) was emitted for 30 s by the 695-nm LEDs with the PMT shutter closed. After the excitation light was turned off, the PMT shutter was opened, and the DL intensity was recorded at 0.1 s intervals from 0.1 to 300 s (5 min). For the first measurement, the DL was detected under dark conditions for 5 min immediately after the plant was taken from the growth chamber. For the second detection, the plant was incubated in the dark for 10 min in total, 5 min in the first DL detection plus 5 min further dark incubation (Fig. (A)). Then, the excitation light was given again by the LEDs at 695 nm (45 μmol photons m−2 s−1) for 30 s. After the LEDs were turned off, the DL was recorded at 0.1 s intervals from 0.1 to 300 s. After the DL intensities were measured, the PMT shutter was closed. Three individual plants that were visibly similar in size were used in each experiment.
Fig. 2. First and second detections of DL decay curves after excitation.
Fluorescence modulation
Light saturation curve measurements were made using a Junior PAM portable Chl fluorometer (Heinz Walz GmbH, Effeltrich, Germany) fitted with a 1.5-mm diameter optic fiber and a blue diode (450 nm) light source. The Junior PAM uses a magnetic clamp to hold a leaf about 1 mm from the end of the light pipe. PAM parameters (ETR and NPQ) were calculated using the WINCONTROL software (2.133/03.00; Heinz Walz GmbH) with standard settings for rapid light curves. On the standard settings for a light curve, nine saturating flashes of increasing intensity were illuminated at 10-s intervals and each flash of light was 0.8 s duration. Leaves were collected from the samples after the DL detection and placed in the dark for 30 min before use in fluorescence modulation experiments.
Results
Time-sequential double DL detection with and without dark incubation
In this study, we tried to categorize the DL decay behaviors of whole Arabidopsis plants in Petri dishes. The patterns of the decay curves are very complicated, and many reports have indicated that DL is sensitive to numerous factors, such as light, temperature, culture medium composition, and chemicals.Citation25,27) To compensate for differences in DL decay between individual plants grown under the same conditions, we performed a time-sequential double measurement of DL decay. First, the decay curves of DL emitted by the plants immediately after they were taken from growth chambers were used to represent the decay from growing in the light. Second, the decay curves detected after the plants were incubated in the dark for 10 min were used to represent the decay after dark treatment. We focused on the differences in the initial intensity and analyzed the changes in decay curve patterns. That is, we conducted the first detection for 5 min after the plants were placed in the detector directly from the growth chambers, and we performed the second detection after a 10-min dark incubation including 5 min for the first detection (Fig. (A)). The DL decay curves were recorded after a 30-s exposure to 45 μmol photons m−2 s−1 light at 695 nm, which excited the photosystem, in both the first and second detections. The initial DL intensity was higher in the second detection than in the first, and concavity and convexity in the decay curve appeared at the late phase only in the first detection (Fig. (B)).
Optimization of growth stage for DL detection
To find the most suitable growth stage for detection, we compared the decay curves of plants at different stages. Plants were grown until they reached different sizes for 2, 3, and 4 weeks (Fig. (A)). The DL intensity increased with the growth stage, being higher after longer periods of growth. Concavity and convexity in the decay curves appeared in the first detection in all growth stages (Fig. (B)–(D)). When we compared the difference in the initial DL between the first and second detections for each plant, the difference diminished with growth stage (Fig. (E)). This phenomenon could be ascribed to the incomplete oxidation of PS II components during the 10-min dark incubation for the first detection depending on the plant growth stage. In 3- and 4-week-old plants, the decay curves at 300 s did not reach the lower state seen in 2-week-old plants showing the bigger variations due to the lower limits of detection.
Fig. 3. DL decay curves of Arabidopsis at different growth stages.
Effect of light intensity during plant growth
Plants acclimate themselves to fluctuating light environments.Citation32) Thus, we evaluated the effects of light intensity during plant growth on the decay curves. Fig. (A)–(C) shows the decay curves of plants that were grown for two weeks under 15, 45, or 120 μmol photons m−2 s−1 (μE m−2 s−1). The DL intensities were highest in the plants grown under 120 μmol photons m−2 s−1 (Fig. (C)). In every light-treated plant, the DL decay curve for the first detection showed concavity and convexity. The curve in the second detection crossed the first detection curve at a point after the concavity and before the convexity in each case (Fig. (A)–(C)). The initial DL intensity in the decay curve was lower in plants grown under 15 μmol photons m−2 s−1 than in plants grown under 45 μmol photons m−2 s−1 light (Fig. (D)). In the decay curve of the 120 μmol photons m−2 s−1 grown plants, the difference in initial DL intensity between the first and second detections was lower than the difference in the 45 μmol photons m−2 s−1 cultured plants (Fig. (D)).
Fig. 4. DL decay curves of plants grown under different light intensities for 2 weeks.
Effects of photosynthetic electron transport inhibitors
We examined the effects of three kinds of inhibitors of photosynthetic electron transport, two of which affect reduction and oxidation of the electron pool at PQ. One of the inhibitors was DCMU, which inhibits the electron flow from PS II to PQ.Citation33) The second was DBMIB, which inhibits oxidation of plastoquinol at the cytochrome b6/f protein complex.Citation33,34) The third was antimycin A, which inhibits cyclic electron transport.Citation35) All of these inhibitors were dissolved in 0.1% DMF to make final concentrations of 10 μM.
We determined the DL decay curves (Fig. (A)–(E)), differences in initial DL intensities (Fig. (F)), and PAM parameters including ETR and NPQ (Fig. (G) and (H)) after exposure to these inhibitors. DL decay curves were recorded in both the first and second detections. The light-intensity dependence of ETR is indicative of the relative amount of electrons passing through PS II during steady-state photosynthesis. This was not impaired at any light intensity in non-treated and solvent alone-treated (0.1% DMF) plants (Fig. (G)). However, at the concentrations we used, the ETR was saturated at a lower level with a lower light intensity in the presence of antimycin A or DBMIB and was undetectable with DCMU (Fig. (G)). Thus, there was no significant electron transport through PS II in DCMU-treated plants.
Fig. 5. Influence of 10 μM DCMU, DBMIB, and antimycin A on DL decay curves, ETR, and NPQ.
In the plants without inhibitors, the DL decay curves showed concavity and convexity in the first detection. The second detection curves crossed the first detection curves after the concavity and before the convexity (Fig. (A) and (B)). In DCMU- or antimycin A-treated plants, the decay curves also showed concavity and convexity in the first detection, but this characteristic was not present in the plants treated with DBMIB (Fig. (C)–(E)). In contrast, the DL decay curves in the green alga P. subcapitata lacked any concavity or convexity in the presence of antimycin A.Citation25) Higher intensities of DL were detected in the initial phase in both the first and second detections in DBMIB-exposed plants. Furthermore, the difference between the initial DL intensities in the first and second detections was smaller in DBMIB-exposed plants than in control plants (Fig. (F)).
Discussion
Significance of DL decay curves in Arabidopsis
We categorized the decay behavior of DL in the model higher plant Arabidopsis with whole plants in Petri dishes using a self-manufactured sensitive device for DL detection. The patterns of the decay curves are very complicated, as DL responds to numerous factors such as light, temperature, culture medium composition, and chemicals.Citation23,36) Some investigators have examined the effect of light on the patterns of decay curves.Citation25,27) Havaux and Lannoye suggested that the emission of DL from maize and barley leaves changed in different temperature treatments depending on the ability of the thylakoid membrane lipids to undergo phase transition.Citation37) A study of the flagellate protist Prorocentrum minimum revealed that DL could reflect differences in algal growth.Citation26) DL has also been measured in P. subcapitata after the chemical exposure, and its growth rate was reduced in correlation with a decrease in DL intensity.Citation9,10,25) We observed interesting kinetics in the DL decay curves of Arabidopsis in response to different factors, including growth period, growth conditions such as different light intensities, and treatment with different inhibitors of photosynthetic electron transport. In Arabidopsis (Fig. (B)) and other higher plants such as spinach,Citation38) barley,Citation39) Anthurium sp.,Citation40) and Crassula ovata,Citation40) a convexity characteristically appears around 100 s, whereas it appears around 10 s in unicellular algae such as P. subcapitata Citation25) and S. obliquus.Citation23,41) This may reflect the complexity of the photosynthetic machinery in higher plants.
Influence of dark treatment on the initial intensity of DL
The initial intensity of DL was higher in the second detection than in the first detection (Fig. (B)). This is similar to the elevation of Fp in the PAM detection of green leaves after dark acclimation, as the second detection followed dark incubation during the first detection when the electron transport system became oxidized (Fig. S1(B)). The enhancement of fluorescence by dark acclimation was originally reported by Kautsky in 1931 Citation42) and is understood as follows. When a leaf is kept in the dark, QA becomes maximally oxidized and the PS II reaction centers are referred to as being “open,” i.e., capable of performing photochemical reduction of QA.Citation43) When green leaves are exposed to an excitation light in such a situation, QA is greatly reduced and higher fluorescence is generated.
The appearance of concavity and convexity in DL decay curves
The decay curve of the first detection showed a small concavity (Fig. (B), the upward arrow) and convexity (Fig. (B), the downward arrow), which was similar to DL curves from P. subcapitata detected after pre-illumination,Citation25) though the time in which these appeared was much earlier than in Arabidopsis (see above). In agreement with the report of DL in P. subcapitata, the convexity was diminished after dark incubation.Citation25) The decay curves in the first and second detections crossed at a point between the concavity and convexity of the curves. Some reports have suggested that DL from photosynthetic organisms shows a secondary peak or convexity at the later phase of the decay curve. Schmidt and Senger supposed that long-term DL, which is similar to the later phase of the decay curves in this study, reflects both PS II and PS I fluorescence.Citation41,36) Conversely, Hideg et al. proposed that the second peak or convexity of DL was emitted from different subpopulations of PS II centers.Citation38) Considering these hypotheses, the convexity around 100 s (Fig. (B), the downward arrow) may be caused by backflow of electrons to QB mainly through cyclic electron flow after they have reached PS I (B) (Fig. S1B), and the small concavity appears prior to such backflow to generate the convexity.
DL decay affected by light acclimation during plant growth
Photosynthetic activity, as represented by light-dependent oxygen evolution, was reported to be affected by light intensities during the growth of Arabidopsis for one week.Citation32) A moderate intensity of light up to 200 μmol photons m−2 s−1 enhanced the oxygen evolution either per leaf area or Chl in comparison with a lower light intensity.Citation32) Therefore, the photosynthetic oxygen evolution capacity is increased by increasing intensities of light. Consistent with this observation, the initial DL intensity in the decay curve was lower in plants grown under 15 μmol photons m−2 s−1 than in plants grown under 45 μmol photons m−2 s−1 light (Fig. (D)), demonstrating increasing capacity for light energy absorption. This acclimation resulted in a reduced capability for electron hole and electron production in PS II in plants cultured under 15 μmol photons m−2 s−1 compared with plants grown under 45 μmol photons m−2 s−1. Therefore, even illumination with light of 45 μmol photons m−2 s−1 for excitation would fully excite Chl molecules in both 15 and 45 μmol photons m−2 s−1 cultured plants.
In the decay curve of the 120 μmol photons m−2 s−1 grown plants, the difference in initial DL intensity between the first and second detections was lower than the difference in the 45 μmol photons m−2 s−1 cultured plants (Fig. (D)). Therefore, 45 μmol photons m−2 s−1 illumination for excitation may not have been enough to excite the Chl molecules of plants that were grown under a higher light intensity than that used for excitation. It was reported that a low light level could only partially excite the Chl of plants grown under 120 μmol photons m−2 s−1.Citation44) Alter et al. observed that Arabidopsis cultured under a high light intensity (120 μmol photons m−2 s−1) had greater ETRs, starch accumulation, and relative growth rates than plants cultured under a standard light condition (50 μmol photons m−2 s−1).Citation45) This evidence suggests that plants actively respond to high light intensities by increasing their photosynthetic ability.
Mechanisms underlying the DL decay curves in the presence of inhibitors
DCMU inhibits the transfer of electrons to PQ at the QB site after illumination for excitation. Illumination of PS II in the presence of DCMU was reported to cause P680 Phe QA− to re-oxidize QA− with a 1-s half-life.Citation7,46) Therefore, a higher intensity of fluorescence was detected at the beginning of both the first and second detections (Fig. S1(C)). The convexity around 100 s corresponding to backflow from PS I observed in the first detection without inhibitor treatment (see above) also appeared in the decay curve after DCMU treatment (Fig. (C)). Considering that the DL intensity at the top of the convexity was lower with DCMU (Fig. (C)) than that without inhibitor treatment (Fig. (A)), a certain number of electrons would have reached PS I before and during the 10-min DCMU treatment and flowed back in the first detection (Fig. S1(C)).
The initial DL intensities in the first and second detections after DBMIB treatment were higher, and their difference was smaller in comparison with control plants (Fig. (F)). This was caused by the inhibition of electron flow between PQ and the cytochrome b6f protein complex, resulting in higher and direct backflow from QB to the PS II reaction center (Fig. S1(D)). The slightly higher initial DL intensity in the second detection may reflect the dark acclimation effect (see above) caused by oxidation of components before the DBMIB-blocking site. No convexity around 100 s was observed (Fig. (D)), suggesting that electrons did not reach PS I with DBMIB and there was no backflow to QB. The presence and absence of convexity in the DCMU and DBMIB treatments, respectively, is characteristic, showing the resultant backflow of electrons from PS I to PQ with DCMU but no backflow with DBMIB depending on the site where these inhibitors affected photosynthetic electron transport (Fig. S1(C) and (D)).
Antimycin A interferes with the cyclic electron flow from PS I to cyt b6f through ferredoxin.Citation35,47) In the DL decay curves of antimycin A-treated plants, the decay of DL was the slowest in the first detection (see the slope at 10 s in Fig. (E), resulting in slight concavity and a small convexity (Fig. (E)). Therefore, we speculate that cyclic electron transport may assist efficient electron flow from PS I to PQ in DL decay. Although antimycin A blocks cyclic electron transport, it did not interfere with the later phase characteristics of the DL decay curve around 100 s, which had a similar shape of convexity in the control plants but a lower DL intensity at the top of the convexity (Fig. (A) and (E)). The convexity around 100 s did not disappear with antimycin A, whereas the corresponding convexity degenerated with this inhibitor in the green alga P. subcapitata when it was grown under higher irradiance.Citation25) Therefore, Arabidopsis plants grown under the conditions we used may have a NADPH-dehydrogenase (NDH)-dependent pathway,Citation48,49) while the green alga may be defective in this pathway (Fig. S1(E)).
We have categorized the differences in DL behaviors in response to different photosynthesis electron transport inhibitors. Differences in DL behaviors were observed in the initial and late phases of the DL decay curves and in the presence of concavity and convexity therein. DL is released from PS II, but can reflect the energy of electron flow, which is slowly relayed from PS I via cyclic electron transport. This study suggests that DL decay curves at the later phase show the energy flow from some components downstream of PQ, where the energy can be relayed back to PS II. This hypothesis is supported by the DL decay curves in treatments with photosynthetic electron transport inhibitors, as the convexity appeared in control plants but not in DBMIB-treated plants. We conclude that this method is useful for evaluating defects in the photosynthetic apparatus that affect photosynthetic efficiency in nondestructive studies of photosynthesis in Petri dishes under sterile conditions. One of the most useful applications of DL as described here would be the efficient characterization of a variety of photosynthetic mutant plants.
Author contributions
P.C. and A.S. performed the experiments. M.S. Y.K., M.K., and H.K. assisted with the experiments and contributed to discussions. P.C. and H.K. wrote the manuscript.
Disclosure statement
No potential conflict of interest was reported by the authors.
Funding
This work was supported by the Grant-in-Aid [grant number 25660008] and the Global COE Program from the Ministry of Education, Culture, Sports, Science and Technology (MEXT) of Japan from 2007 to 2012, and by University of Shizuoka Grants for Scientific and Educational Research. P.C. was the recipient of a scholarship for foreign research students from MEXT.
Supplemental material
The supplemental material for this paper is available at http://dx.doi.org/10.1080/09168451.2015.1101332.
figS1.jpg
Download JPEG Image (3.9 MB)
bbb-DL-suppl-10-17-15.docx
Download MS Word (20.2 KB)Notes
Abbreviations: Chl, chlorophyll; DBMIB, 2,5-dibromo-3-methyl-6-isopropyl-p-benzoquinone; DCMU, 3-(3,4-dichlorophenyl)-1,1-dimethylurea; DF, delayed fluorescence; DL, delayed luminescence; DMF, dimethylformamide; ETR, electron transport rate; LED, light-emitting diode; NPQ, non-photochemical quenching; PAM, pulse amplitude modulation; PMT, photomultiplier tube; PQ, plastoquinone; PS, photosystem.
Related Research Data
References
- Maxwell K, Johnson GN. Chlorophyll fluorescence—A practical guide. J. Exp. Bot. 2000;51:659–668.
- Krause GH, Weis E. Chlorophyll fluorescence and photosynthesis: the basics. Annu. Rev. Plant Physiol. Plant Mol. Biol. 1991;42:313–349.
- Miyagawa Y, Tamoi M, Shigeoka S. Evaluation of the defense system in chloroplasts to photooxidative stress caused by paraquat using transgenic tobacco plants expressing catalase from Escherichia coli. Plant Cell Physiol. 2000;41:311–320.
- Makino A, Miyake C, Yokota A. Physiological functions of the water-water cycle (Mehler reaction) and the cyclic electron flow around PSI in rice leaves. Plant Cell Physiol. 2002;43:1017–1026.
- Miyake C, Yokota A. Cyclic flow of electrons within PSII in thylakoid membranes. Plant Cell Physiol. 2001;42:508–515.
- Strehler BL, Arnold W. Light production by green plants. J. Gen. Physiol. 1951;34:809–820.
- Jursinic PA. Delayed fluorescence: current concepts and status. In: Govindjee, Amesz J, and Fork DC, editors. Light Emission by Plants and Bacteria. Academic Press; 1986. p. 291–328.
- Krasnovsky AA, Jr., and Kovalev YV. Spectral and kinetic parameters of phosphorescence of triplet chlorophyll a in the photosynthetic apparatus of plants. Biochem. (Mosc). 2014;79:349–361.
- Katsumata M, Koike T, Nishikawa M, et al. Rapid ecotoxicological bioassay using delayed fluorescence in the green alga Pseudokirchneriella subcapitata. Water Res. 2006;40:3393–3400.
- Katsumata M, Koike T, Kazumura K, et al. Utility of delayed fluorescence as endpoint for rapid estimation of effect concentration on the green alga Pseudokirchneriella subcapitata. Bull. Environ. Contam. Toxicol. 2009;83:484–487.
- Wang C, Xing D, Chen Q. A novel method for measuring photosynthesis using delayed fluorescence of chloroplast. Biosens. Bioelectron. 2004;20:454–459.
- Wang J, Xing D, Zhang L, et al. A new principle photosynthesis capacity biosensor based on quantitative measurement of delayed fluorescence in vivo. Biosens. Bioelectron. 2007;22:2861–2868.
- Avagyan AB. Correlations between delayed fluorescence of chlorophyll, metabolism and yield of plants. I. Influence of fertilizers on correlations. J. Biophys. Chem. 2010;01:40–51.
- Guo Y, Tan J. A kinetic model structure for delayed fluorescence from plants. Biosystems. 2009;95:98–103.
- Gould PD, Diaz P, Hogben C, et al. Delayed fluorescence as a universal tool for the measurement of circadian rhythms in higher plants. Plant J. 2009;58:893–901.
- Guo Y, Tan JA. A plant-tissue-based biophotonic method for herbicide sensing. Biosens. Bioelectron. 2010;25:1958–1962.
- Guo Y, Tan J. A biophotonic sensing method for plant drought stress. Sens. Actuators B. Chem. 2013;188:519–524.
- Zhang L, Xing D, Wang J. A non-invasive and real-time monitoring of the regulation of photosynthetic metabolism biosensor based on measurement of delayed fluorescence in vivo. Sensors. 2007;7:52–66.
- Radenović ČN, Maksimov GV, Tyutyaev EV, et al. Detecting the phase transition in thylakoid membranes of maize inbred lines by means of delayed fluorescence. Plant Physiol. Biochem. 2014;81:208–211.
- Oukarroum A, Goltsev V, Strasser RJ. Temperature effects on pea plants probed by simultaneous measurements of the kinetics of prompt fluorescence, delayed fluorescence and modulated 820 nm reflection. PLoS ONE. 2013;8:e59433.
- Oukarroum A, Strasser RJ, Schansker G. Heat stress and the photosynthetic electron transport chain of the lichen Parmelina tiliacea (Hoffm.) Ach. in the dry and the wet state: differences and similarities with the heat stress response of higher plants. Photosynth. Res. 2012;111:303–314.
- Bertsch WF. Two photoreactions in photosynthesis: evidence from the delayed light emission of chlorella. Proc. Natl. Acad. Sci. USA. 1962;48:2000–2004.
- Bürger J, Schmidt W. Long term delayed luminescence: A possible fast and convenient assay for nutrition deficiencies and environmental pollution damages in plants. Plant Soil. 1988;109:79–83.
- Scordino AGF, Grasso F, Musumeci F. Physical aspects of delayed luminescence in Acetabularia acetabulum. Experientia. 1993;49:702–705.
- Katsumata M, Takeuchi A, Kazumura K, et al. New feature of delayed luminescence: Preillumination-induced concavity and convexity in delayed luminescence decay curve in the green alga Pseudokirchneriella subcapitata. J. Photochem. Photobiol. B. 2008;90:152–162.
- Berden-Zrimec M, Flander-Putrle V, Drinovec L, et al. Growth, delayed fluorescence and pigment composition of four Prorocentrum minimum strains growing at two salinities. Biol. Res. 2008;41:11–23.
- Goltsev V, Zaharieva I, Chernev P, et al. Delayed fluorescence in photosynthesis. Photosynth. Res. 2009;101:217–232.
- Murashige T, Skoog F. A Revised Medium for Rapid Growth and Bio Assays with Tobacco Tissue Cultures. Physiol. Plant. 1962;15:473–497.
- Drechsler Z, Nelson N, Neumann J. Antimycin A as an uncoupler and electron transport inhibitor in photoreactions of chloroplasts. Biochim. Biophys. Acta. 1969;189:65–73.
- Wessels JS, van der Veen R. The action of some derivatives of phenylurethan and of 3-phenyl-1,1-dimethylurea on the Hill reaction. Biochim. Biophys. Acta. 1956;19:548–549.
- Draber W, Trebst A, Harth E. On a new inhibitor of photosynthetic electron-transport in isolated chloroplasts. Z. Naturforsch. B. 1970;25:1157–1159.
- Yin ZH, Johnson GN. Photosynthetic acclimation of higher plants to growth in fluctuating light environments. Photosynth. Res. 2000;63:97–107.
- Surpin M, Larkin RM, and Chory J. Signal transduction between the chloroplast and the nucleus. Plant Cell. 2002;14:S327–S338.
- Roberts AG, Bowman MK, Kramer DM. The inhibitor DBMIB provides insight into the functional architecture of the Qo site in the cytochrome b6f complex. Biochem. 2004;43:7707–7716.
- Munekage Y, Shikanai T. Cyclic electron transport through photosystem I. Plant Biotechnol. 2005;22:361–369.
- Schmidt W, Senger H. Long-term delayed luminescence in Scenedesmus obliquus. II. Influence of exogeneous factors. Biochim. Biophys. Acta. 1987;891:22–27.
- Havaux M, Lannoye R. Temperature dependence of delayed chlorophyll fluorescence in intact leaves of higher plants. A rapid method for detecting the phase transition of thylakoid membrane lipids. Photosynth. Res. 1983;4:257–263.
- Hideg E, Kobayashi M, Inaba H. The far red induced slow component of delayed light from chloroplasts is emitted from Photosystem II. Evidence from emission spectroscopy. Photosynth. Res. 1991;29:107–112.
- Goltsev V, Zaharieva I, Lambrev P, et al. Simultaneous analysis of prompt and delayed chlorophyll a fluorescence in leaves during the induction period of dark to light adaptation. J. Theor. Biol. 2003;225:171–183.
- Yan Y, Popp FA, Sigrist S, et al. Further analysis of delayed luminescence of plants. J. Photochem. Photobiol. B. 2005;78:235–244.
- Schmidt W, Senger H. Long-term delayed luminescence in Scenedesmus obliquus I. Spectral and kinetic properties. Biochim. Biophys. Acta. 1987;890:15–22.
- Kautsky H, Hirsch A. Neue Versuche zur Kohlensäureassimilation. Naturwissensch. 1931;19:964.
- Baker NR. Chlorophyll fluorescence: a probe of photosynthesis in vivo. Annu. Rev. Plant Biol. 2008;59:89–113.
- Lönneborg A, Kalla SR, Samuelsson G, et al. Light-regulated expression of the psbA transcript in the cyanobacterium Anacystis nidulans. FEBS. 1988;240:110–114.
- Alter P, Dreissen A, Luo FL, et al. Acclimatory responses of Arabidopsis to fluctuating light environment: comparison of different sunfleck regimes and accessions. Photosynth. Res. 2012;29:107–112.
- Bennoun P. Réoxydation du quencher de fluorescence “Q” en présence de 3-(3,4-dichlorophényl)-1,1-diméthylurée. Biochim. Biophys. Acta. 1970;216:357–363.
- Alric J, Lavergne J, Rappaport F. Redox and ATP control of photosynthetic cyclic electron flow in Chlamydomonas reinhardtii (I) aerobic conditions. Biochim. Biophys. Acta. 2010;1797:44–51.
- Munekage Y, Hashimoto M, Miyake C, et al. Cyclic electron flow around photosystem I is essential for photosynthesis. Nature. 2004;429:579–582.
- Shikanai T. Cyclic electron transport around photosystem I: genetic approaches. Annu. Rev. Plant. Biol. 2007;58:199–217.