
Abstract
The mammalian peripheral stalk subunits of the vacuolar-type H+-ATPases (V-ATPases) possess several isoforms (C1, C2, E1, E2, G1, G2, G3, a1, a2, a3, and a4), which may play significant role in regulating ATPase assembly and disassembly in different tissues. To better understand the structure and function of V-ATPase, we expressed and purified several isoforms of the human V-ATPase peripheral stalk: E1G1, E1G2, E1G3, E2G1, E2G2, E2G3, C1, C2, H, a1NT, and a2NT. Here, we investigated and characterized the isoforms of the peripheral stalk region of human V-ATPase with respect to their affinity and kinetics in different combination. We found that different isoforms interacted in a similar manner with the isoforms of other subunits. The differences in binding affinities among isoforms were minor from our in vitro studies. However, such minor differences from the binding interaction among isoforms might provide valuable information for the future structural-functional studies of this holoenzyme.
Graphical abstract
Schematic model of human V-ATPase illustrating the mode of binding interactions at the peripheral stalk region.
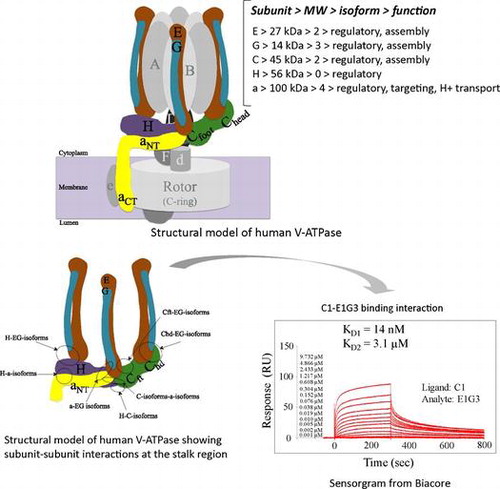
The vacuolar-type H+-ATPases (V-ATPases) are ubiquitous ATP-dependent proton pumps that transport H+ across the membranes of endomembrane organelles, including vacuoles, lysosomes, endosomes, the Golgi apparatus, chromaffin granules, and coated vesicles.Citation1–5) These enzymes are also found in the plasma membranes of specialized cells such as osteoclasts and renal epithelial cells.Citation6,7) Many of the 14 V-ATPase subunits in mammals can exist as more than 1 homolog or isoform, thereby adding another level of complexity to the motor; subunits A and B comprise the catalytic part of the soluble domain of the vacuolar ATPase (V1); C, E, G, H, and the N-terminal part of a comprise the peripheral stalk; D and F comprise the central stalk and the C-terminal part of a, c, c″, d, and e form the membrane-bound domain of the vacuolar ATPase (Vo) ion transporting portion (Fig. ).
Fig. 1. Schematic model of human V-ATPase illustrating the mode of binding interactions at the peripheral stalk region.
V-ATPases are localized in different organelles and membranes according to their specific function. The mechanisms underlying the diverse functions and localizations of V-ATPases are believed to be mediated by the structures of the various isoforms.Citation8) Currently, isoforms have been identified for the a, d, e, B, C, E, and G subunits.Citation9–11) However, the regulatory mechanism underlying the assembly of the unique combinations of isoforms and the information necessary to target the enzyme to different cellular destinations are still not clearly understood. Elucidation of the mechanism underlying the diverse subcellular localization of the proton pump is of particular interest to understand their function clearly.Citation2) Expression pattern analyses together with both forward and reverse genetic approaches have demonstrated that specific V-ATPase complexes participate in highly differentiated cellular and tissue functions, including renal acidification, bone resorption, spermatogenesis, and neurotransmitter accumulation.Citation12) Although the general structure of V-ATPases is similar wherever they are found, their composition is subtly different at sites where there is a requirement for a specific type of acid flux across the plasma membrane. These include specialized cells in the kidney, bone, inner ear, testis, sperm, and brain.
Previous studies confirmed that subunits C, E, G, H, and the N-terminal domain of subunit a form part of the peripheral stalk. However, the presence of multiple isoforms of these stalk subunits makes it difficult to understand their function. As expected from the diverse acidic compartments in mammals, specific isoforms are found in unique cells or organelles. V-ATPases containing subunit isoforms a1, a2, or a3 are found ubiquitously in different endomembrane organelles, whereas those with a4 are specific to the plasma membranes of kidney-intercalated cells.Citation13–16) Similarly, 2 isoforms for the E and C subunits and 3 for the G subunit have been identified.Citation17–21) E1 is specifically expressed in the germ cells of the testis, whereas E2 is found ubiquitously in all tissues examined.Citation22) The human C subunit has 2 isoforms, with C1 being expressed ubiquitously and C2 showing tissue specificity, with further diversity (C2-a and C2-b) resulting from alternative mRNA splicing. C2-a is predominantly expressed in the lung, whereas C2-b is expressed in the kidney and testis.Citation18,23) Among the 3 G isoforms, G1 is found ubiquitously, whereas G2 is found in the brain and G3 in the kidney and inner ear. Citation20,21,24) Kidney, testis, inner-ear, osteoclast, brain, and lung require the isoform combinations of E2G3-a4-C2-H, E1G1-a2-C2-H, E2G3-a4-C1-H, E2G1-a3-C1-H, E2G2-a1-C1-H, and E2G1-a1-C2-H, respectively, for their specific functionality. In cases of isoform-specific mutations, isoforms cannot complement each other for such specialized function, which results in disease or dysfunction in the tissue to which that isoform is normally located. Two E and 3 G isoforms, comprising 6 different protein complexes, have been purified using a cell-free co-expression system: V1-E1G1, V1-E1G2, V1-E1G3, V1-E2G1, V1-E2G2, and V1-E2G3.Citation25,26) For clarity, in this article, we will refer to EG-isoforms as a single subunit for all binary, ternary, and quaternary interactions.
To elucidate the assembly mechanism of the V-ATPase peripheral stalk irrespective of the central stalk, catalytic part, and ion translocation part, we expressed and purified several isoforms of this stalk region. In the current study, we examined the in vitro binding interactions of several human V-ATPase subunits and their isoforms to evaluate structural and functional similarities/differences among the isoforms.
Materials and methods
Human protein preparation
We expressed and purified several human V-ATPase protein subunits and their isoforms using an Escherichia coli cell-free protein synthesis system, as previously described.Citation25–27) For this report, we used several isoforms of V-ATPase subunits: E1G1, E1G2, E1G3, E2G1, E2G2, E2G3, C1, C2, a1NT, a2NT, and H. The concentrating step in case of E2G2 and E2G3 was avoided at the final step of purification.Citation25) Out of 2 splice variants of C2 isoform, we were able to express and purify C2-b. Therefore, C2 isoform in the entire text and figures of this article should be considered as C2-b splice variant of C2 isoform.
Co-expression and co-purification of human C2-E1G1 isoforms
The co-expression of human C2-E1G1 isoforms was investigated utilizing the His-tag present on each subunit and was purified using a slight modification of the previously described protocol.Citation25) The cell-free synthesizing mixture was loaded onto a His-Trap 5 mL HP column (GE Healthcare, England) equilibrated with buffer A (20 mM Tris–HCl, pH 8.0, 1 M NaCl, 20 mM imidazole), and bound proteins were eluted with buffer B (20 mM Tris–HCl, pH 8.0, 0.5 M NaCl, 500 mM imidazole). The sample buffer was exchanged to buffer C (20 mM Tris–HCl, pH 8.0, 0.5 M NaCl, 20 mM imidazole) using a HiPrep 26/10 Desalting column. To remove His-tags, the proteins were treated with Tobacco etch virus (TEV) protease (4 mg/ml, 100 μL) at 4 °C overnight and the co-expressed isoforms were filtered using 0.45-μm filter device. After filtration, the suspension was again passed through a His-Trap 5 mL HP column, the column was washed with buffer A, and then the bound proteins were eluted with buffer B. The buffer in the flow-through fraction was exchanged to buffer D (50 mM Tris–HCl, pH 7.0, 20 mM NaCl, 2 mM DTT) using a HiPrep 26/10 Desalting column. The fractions were centrifuged at 16,000 × g, 4 °C for 20 min and the supernatant was applied to a HiTrap SP 5 mL ion exchange column (GE Healthcare, England) where the eluate was collected at a flow rate of 5 ml/min using buffer D as the initial buffer. Gradient elution of the protein sample was performed using a salt linear gradient, from low salt to high salt concentration using buffer D to buffer E (50 mM Tris–HCl, pH 7.0, 1 M NaCl, 2 mM DTT). The eluted fraction was concentrated using Amicon Ultra-15, 3,000MWCO (Amicon, USA). Finally, the samples were loaded onto a HiLoad 16/60 Superdex 200 (GE Healthcare, England) column equilibrated with buffer F (20 mM Tris–HCl, pH 8.0, 150 mM NaCl, 5 mM 2-mercaptoethanol) and eluted using buffer F. The purified sample was concentrated by ultrafiltration (Amicon Ultra-4, 3,000MWCO, Amicon, USA). At the end of purification, the protein sample was filtered using Ultrafree-MC Centrifugal Filter Units (0.22 μm). The C2E1G1 complex subunits eluted as an early single, sharp, and large peak (estimated molecular weight = 85,325 Da). A subsequent smaller peak later eluted contained a small amount of C2 subunit alone.
Gel filtration chromatography
The purified human V-ATPase subunits and their isoforms were loaded individually onto a Superdex 200 (5/150) column (GE Healthcare) connected to a BioLogic Duo-Flow system (Bio-Rad) at 4 °C. Protein–protein binding interactions of different combinations of these proteins and their isoforms were analyzed by incubating mixtures of varying molar ratios of the purified proteins (subunits/isoforms) on ice for approximately 1 h and then passing the mixture through the column. Gel filtration was performed at 4 °C, in 20 mM HEPES-NaOH, 300 mM NaCl, 1 mM DTT; pH 7.5. Complexes formed by protein–protein interactions were identified by shifts of peak position and confirmed by analysis of the eluted fractions by SDS PAGE, as described previously.Citation27) The column was calibrated using blue dextran (2000 kDa), ferritin (440 kDa), aldolase (158 kDa), conalbumin (75 kDa), and ovalbumin (44 kDa).
Pull-down assay using His-tagged H subunit
His-tagged V1-H protein was mixed with non-tagged samples and incubated for 1 h on ice. The mixture was incubated with Ni Sepharose 6 Fast Flow pre-equilibrated with buffer A (20 mM HEPES-NaOH, 300 mM NaCl, and 0.1 mM DTT, pH 7.5) at 4 °C in a rotator for 1 h and washed thrice with 5 column volumes of buffer A. Loosely bound proteins were eluted by washing thrice with 5 column volumes of buffer B (20 mM HEPES-NaOH, 300 mM NaCl, 0.1 mM DTT, and 20 mM imidazole, pH 7.5). Finally, strongly bound proteins were eluted using buffer C (20 mM HEPES-NaOH, 300 mM NaCl, 0.1 mM DTT, and 500 mM imidazole, pH 7.5) and binding was analyzed as described in our previous report.Citation27)
Native PAGE
Basic native gel electrophoresis was conducted as described previously.Citation27) For analysis of binding interactions, different molar ratios of protein subunits were mixed and incubated on ice for approximately 1 h. Gel electrophoresis was performed at 4 °C for approximately 4 h, and the gel was then stained with Coomassie Brilliant Blue R250. Native complexes were analyzed in a second denaturing dimension. Bands corresponding to the respective complexes were excised from the native gel and incubated in 30 μl of SDS sample buffer overnight at 4 °C to elute the proteins. The solutions eluted from the excised bands were then loaded on a denaturing gel and SDS-PAGE was performed according to the method described by Laemmli.Citation28)
Surface plasmon resonance (SPR) analysis for real-time binding assay
Surface plasmon resonance (SPR) analysis was performed for quantitative estimation of protein–protein binding interactions. Purified human protein (30 μg/ml) C1, H, a1NT, and a2NT in 10 mM sodium acetate buffer at pH 5.0, 4.5, 4.25, and 4.25, respectively, were separately immobilized on a CM5 sensor chip using an amine coupling kit according to the manufacturer’s instructions. The running buffer used contained 20 mM HEPES-NaOH, 300 mM NaCl, 1 mM DTT, and 0.05% surfactant P20 (Tween 20) at pH 7.5. The purified sample was used as the analyte and was passed over the surface of the sensor chip with a typical flow rate of 10 μl/min at 10 °C, and the interactions were monitored. The sensor surface was then washed with a regeneration solution (0.1% sodium lauroyl sarcosinate (Sarkosyl) in 20 mM HEPES-NaOH and 150 mM NaCl, pH 7.5) for 30 s.Citation29) For determining the binding interactions of the C1-EG isoform-complexes, the association and dissociation rate constants (ka and kd) were calculated using BIAevaluation software (Version 1.1, GE Healthcare, Uppsala, Sweden) and the heterogeneous ligand-binding model. The dissociation constant (KD) was calculated from the kd/ka values. For other subunit–subunit interactions, we obtained KD from the plots of steady-state analyte binding levels (Req) against several analyte concentrations at equilibrium. The fitted curve (Req vs. concentrations of analyte) and KD values were obtained using BIAevaluation software with a single 1:1 (Langmuir) binding isotherm as discussed previously.Citation27)
Homology modeling
Homology models of the human C1 (HsC1) and C2 (HsC2) isoforms were built with the program MODELLER in Discovery Studio 3.1 (Accelrys, Inc., CA), using the yeast C subunit (PDBID: 1U7L) as the template. The homology models with the lowest PDF (probability density function) total energy were selected. The best C1 model [PDF total energy: −11200.7, PDF physical energy: −10863.4, DOPE (discrete optimized protein energy) score: −42832.4] and the C2 [PDF total energy: −11014.9, PDF physical energy: −10784.1, DOPE score: −44509.5] were evaluated by Ramachandran plot using the program RAMPAGE (http://mordred.bioc.cam.ac.uk/~rapper/rampage.php). Ramachandran plot of C1 model showed 95.7% residues in favored region, 3.5% residues in allowed region, and 0.8% residues (K28, N29, L342) in outlier region and that of C2 model showed 95.2% residues in favored region, 3.5% residues in allowed region and 1.3% residues (S2, N336, S337, E344, Y367) in outlier region. Human C1 and C2 show 62 identity and 83% similarity, indicating structural differences.Citation25) In contrast, human C1 and C2 show 39 and 36% identity and 59 and 60% similarity, respectively, with the yeast C subunit. In the crystal lattice, the yeast C subunits are arranged in a head-to-tail dimer. The putative dimer models were constructed by superimposition based on the yeast dimer. The Protein interfaces surfaces and assemblies (PISA) web server PDBePISA (http://pdbe.org/pisa/) was utilized to explore the dimer interfaces. All figures were prepared using the PyMOL molecular graphics system software.
Reagents and others
Different suppliers are listed for some reagents, Sigma–Aldrich, Tokyo, Japan; Wako Pure Chem., Tokyo, Japan and Dojindo Chemicals, Tokyo, Japan. Quantification of protein bands on SDS PAGE gel was performed using Image Studio Lite software.
Results and discussions
Expression and purification of human V-ATPase subunits and isoforms
For characterization of the human V-ATPase subunits/isoforms of the peripheral stalk, we expressed and purified all of the proteins (E1G1, E1G2, E1G3, E2G1, E2G2, E2G3, C1, C2, H, a1NT, and a2NT) successfully as reported previously.Citation25) Due to the high aggregation probability of E2G2 protein, the concentrating step was avoided at the final step of purification.Citation25) We therefore omitted E2G2 protein from our analysis of binding interactions due to the low concentration of the purified protein. Here, we utilized these purified proteins to characterize their binding interactions in different combinations. From our investigation, we observed that EG isoforms showed high affinity for the C subunit/isoforms. Thus, we attempted co-expression and co-purification of C2-E1G1 subunits/isoforms and succeeded in obtaining stable protein complexes (Fig. S1).
Binding interactions of EG-isoforms with C subunits/isoforms
We reported previously that subunits E and G alone were unstable and could not be expressed.Citation25,30) We also characterized the binding interaction of C1-E1G1, and found that C1-E1G1 formed a high-affinity complex.Citation27) To investigate differences among the isoforms, we examined subunit–subunit/isoform–isoform interactions between the EG and C isoforms. All of the EG isoforms interacted with the C isoforms in a similar manner (Fig. S2). The molecular size of the fraction peak from these complexes was higher (~220 kDa) than the calculated size (~85 kDa), probably due to the L-shaped structure of these complex subunits.Citation27) C2 alone existed as an equilibrium of both dimer and monomer;Citation25) however, it is complicated to understand whether C2 interacted with EG isoform as a monomer or dimer (Fig. ). When a mixture of E1G1 isoform and C2 was prepared in a 2:1 M ratio, the C2-E1G1 complex was eluted from the gel filtration column as a peak with a position similar to that of the C2 dimer (Fig. (A)). The peak position of the C2-E1G1 complex was not different from that of the C1-E1G1 complex.Citation27) However, the band intensity of C2 on SDS PAGE indicated that the complex peak fraction may contain a mixture of the C2-monomer-E1G1 complex and the C2 dimer or C2-dimer-E1G1 complex (Fig. (A), and S3). In a basic native gel, C2 alone appeared as 2 bands, indicating dimerization. The C2-E2G1 complex also showed 2 bands, one of which was the C2-E2G1 complex (3 bands were seen with the molecular weights of C2, E2, and G1 after the band was excised and rerun on SDS PAGE) whereas the other contained C2 alone (Fig. (B)).
Fig. 2. Interactions between EG isoforms and C2.
To measure the binding affinities and kinetics of complex formation by different isoforms, quantitative estimations were performed using SPR. Subunit C1 was immobilized as a ligand on chip, and specific binding responses were observed when solutions containing various concentrations of EG-subunit/isoforms separately were flowed over the immobilized sensor chips. It was possible to determine 2 binding affinities (high and low affinity) of subunit C1 for E1G2 and E1G3 isoforms, as we described previously (Table ) (Fig. S4A, S4B).Citation27) We omitted using E2-series isoforms (E2G1, E2G2, and E2G3) because of slight aggregation tendency for longer exposure on the chip.
Table 1. Kinetic parameters of binary subunit–subunit binding interactions obtained by Biacore experiments.
Binding interactions of EG isoforms with the H subunit
The interactions of the H subunit with EG isoforms differed depending on the isoforms investigated (Fig. ). Previously, we discussed that H-E1G1 has high binding affinity (48 nM).Citation27) However, in this study, we found that the complexes from other H-EG isoforms (E1G2, E1G3, E2G1 and E2G3) have slightly lower binding affinity than H-E1G1 in gel filtration. Here, we discussed about the binding interaction of H-E1G2 (Fig. (A)) and H-E1G3 (Fig. (B)). When a mixture of 1:1 M ratio of H and EG-isoform was subjected to gel filtration, both H-E1G2 and H-E1G3 complexes were eluted as a broader peak that probably consisted of a mixture of the complex protein and small amount of unbound-free subunits. The SDS PAGE profile from gel filtration of H-E1G3 showed fainter bands for the G3 subunit, indicating partial dissociation of G3 from the H-E1G3 complex (Fig. (B)). On native gels, the complex bands were observed for H-E1G2 and H-E1G3 interaction (Fig. ). Band corresponding to E1G2 was not detectable on the gel in lane 2 of Fig. A due to the high pI of the G2 subunit (pI ~10.9). A small amount of unbound H subunit was seen on the native gel (lane 3), resulting from the binding interaction of H-E1G3 (Fig. (B)). The complex bands in native gels were excised and rerun on SDS PAGE (Fig. , native PAGE, Panel Y) for confirmation.
Fig. 3. Interactions of EG-isoforms with the H subunit.
For the quantitative estimation of the binding affinities and kinetics of complex formation among EG-isoforms and H subunit, SPR analysis was performed where H was immobilized as ligand on a chip; specific binding responses from EG-isoforms were observed when solutions containing various concentrations of EG-isoforms were flowed over the immobilized sensor chips. Here again, we omitted using E2-series isoforms (E2G1, E2G2, and E2G3). Estimation of kinetic parameters for these interactions was not possible due to unreliable curve fitting. Thus, we calculated KD from the plots of steady-state analyte binding levels (Req) against several analyte concentrations at equilibrium. No prominent difference in kinetics or affinity was observed for the binding interactions of different H-EG-isoforms (Table ) (Fig. S4C, S4D).Citation27) However, EG-isoforms behaved differently during gel filtration when interacting with the H subunit. We think that the kinetic parameters for these interactions on chip were complicated, since the sensorgram data showed relatively fast dissociation rate.
Characterization of C isoforms
Subunit C has only 2 isoforms, C1 and C2, but C2 possesses 2 splice variants C2-a and C2-b. In mammals, C1 is found ubiquitously but C2 splice variants are tissue specific. We were able to express and purify C1 and C2-b, but failed to express C2-a. C1 was eluted as a single peak, at molecular weight corresponding to its monomer. C2 eluted as 2 peaks, suggesting a monomer–dimer equilibrium state (Fig. from reference 25).Citation25) From the results of gel filtration or native gels, the interaction of C1 with other subunits could be elucidated, but the dimerization tendency of C2 indicated that its interaction pattern was complicated. However, the interaction profile of C2 with other subunits (for example EG-isoforms) indicates that C2 interacts as a monomer. No crystal structure of the C2 isoform exists for any mammalian species; the possible reason for such structural differences between C1 and C2 is therefore unknown. To understand the structural features of these 2 isoforms, we carried out homology modeling of the C1 and C2 isoforms based on the crystal structure of the yeast C subunit.
Fig. 4. Binary and ternary interactions of H-C2-isoform.
We did not observe difference in the binary interactions of H-C1Citation27) and H-C2 in pull down assays (Fig. (A)). To understand the influence of isoforms on ternary interaction, we carried out pull down assays of the E1G1-C2-H ternary complexes. The ternary binding interaction of E1G1-C2-H was not different (Fig. (B)) from that of E1G1-C1-H.Citation27) However, in native gels, the ternary interactions of E1G1-C2-H seemed different from E1G1-C1-H,Citation27) where 3 bands were observed in lane 4 (A, B, C) of Fig. (C), which could be due to the different nature or pI of the proteins. The second dimensional gel indicated that band A consists of H:C2:E1:G1 and band B consists of C2:E1:G1, where the molar ratio of H:C2:E1:G1 is 1:1:2:2 (band A) and the molar ratio of C2:E1:G1 is 1:1:1 (band B), band C consists of the C2 subunit alone. We interpreted that the band A is the mixture of 2 independent strong complexes of C2-E1G1 and H-E1G1, as we discussed in detail in our previous report.Citation27)
Quantitative estimation of binding affinity from binary isoform–isoform interactions using surface plasmon resonance (SPR)
To measure the binding affinities and kinetics of complex formation by different isoforms, quantitative estimations were performed using SPR system. Subunits C1, H, a1NT, and a2NT were separately immobilized as ligands on a CM5 chip, and specific binding responses were observed when solutions containing various concentrations of other subunit/isoforms were flowed over the immobilized sensor chips. It was possible to determine 2 binding affinities (high and low affinity) of subunit C1 for EG isoforms using BIAevaluation software with a heterogeneous ligand-binding mode, as we described above. In other cases, we were unable to estimate the kinetic parameters because of unreliable curve fitting resulting from the low-affinity binding interactions. Although we tried to immobilize a2NT on the chip, it tended to aggregate. Therefore, we did not obtain any data using a2NT as ligand. Furthermore, because C2 was a dimer, we did not use it as a ligand on the chip to prevent disruption of the native conformation of the protein. To estimate other binary binding affinities, we calculated KD from plots of steady-state analyte binding levels (Req) against several analyte concentrations at equilibrium. We did not observe notable differences in the affinities of the isoforms in subunit–subunit interactions. The KD values from different interactions of several isoforms are summarized in Table and Fig. S5.
Quaternary binding interaction among isoforms
To understand the structural integrity of complexes with different subunit isoforms, we examined the quaternary binding interaction in different combinations. Isoform E1G1 and the H subunit was kept constant in all interactions, in order to better understand the influence of the a and C isoforms. Isoform E1 is testis specific and forms a complex with the ubiquitous G1 subunit. Although C2 has 2 splice variants, we expressed and purified only C2-b for our studies, and we assume from previous studies in ratsCitation23) that C2-b is functional during spermatogenesis (human and rat C2-b show 83% sequence identity). The a2 isoform is localized in the Golgi and it is known that the E1 and a2 isoforms are solely responsible for acrosome acidification in the testis.Citation8,17) The quaternary complexes of E1G1-C2-a2NT-H did not appear to have stronger binding than the quaternary complexes of E1G1-C1-a2NT-H (Fig. ). Previously, the influence of the a1 subunit in forming a quaternary E1G1-C1-a1NT-H complex was not observed, because of the similar relative mobility of the C1 and a1 subunits on SDS-PAGE.Citation27) Out of several different combinations of quaternary interactions, we were able to separate the a2 isoform from C-isoforms. We could not distinguish any difference in the binding pattern of the quaternary interactions in different combinations of isoforms based on peak shape. The pull-down assay in different combinations could not indicate any strong influence of isoforms in quaternary binding interaction.
Fig. 5. Quaternary binding interactions.
Homology model of C1 and C2 isoforms
The ubiquitous C1 isoform was eluted as a single peak, which corresponded to the molecular size of the monomer, but the tissue-specific C2 isoform tended to dimerize.Citation25) Since this was the first observation of dimerization of the human C2 subunit to date, we analyzed structural features that may be involved in the dimerization of C2.
In the crystal structure of the yeast C subunit, the 2 adjacent monomers related by a crystallographic twofold axis form a head-to-tail dimer.Citation31) Multiple sequence alignment of the yeast C and C1/C2 isoforms from different species showed conservation of amino acids (Fig. ). Based on the structural organization of the amino acids constituting the head, neck, and foot of the yeast C subunit, it is possible that the head domain is highly conserved among isoforms and species. Structural alignment also indicated that the foot domain was partially conserved and the neck region highly variable (Fig. ). We further investigated the amino acids conserved among species, particularly in the C1 and C2 isoforms, in Fig. .
Fig. 6. Multiple sequence alignment of yeast C (Vma5p), C1, and C2 subunit isoforms of human V-ATPase with other C1 and C2 subunit isoforms from different species. Conserved amino acids are highlighted by purple color. The amino acids constituting the head (red bar), neck (green bar), and foot (blue bar) regions are highlighted above the sequence according to the crystal structure of the yeast C subunit. Residues involved in dimer interfaces from PISA analysis are highlighted as yellow. Hs, H. sapiens; Mm, M. musculus; Xt, X. tropicalis; Dr, Danio rerio.
Fig. 7. Sequence alignment of the C1 and C2 subunit isoforms of human V-ATPase with other C1 and C2 subunit isoforms from different species.
In the ConSurf conservational analysis, we showed the structural differences between C1 and C2 isoforms (Fig. ). The ConSurf conservational analysis indicated the conservation of the structure of the yeast C subunit in a homology model of human C1 and C2 isoforms generated by multiple sequence alignment of isoforms from different species (Fig. ). The highlighted amino acids from the multiple sequence alignment (Fig. ) indicate that the conserved amino acids were mostly in the head and foot regions but hardly in the neck region.
Fig. 8. Consurf conservation analysis for the homology models.
Future studies should obtain supporting evidence to determine whether such non-conserved amino acids in the neck region are truly responsible for creating the dimer interface. In the PISA analysis, 41 amino acids were found at the dimer interface of the yeast C subunit. In contrast, 37 interacting amino acids were found to be similarly located at the interface of the homology model of the C1 isoform, where 11 amino acids were not conserved. The non-conserved amino acids in C1 were N145, G148, D235, R238, H239, R242, D250, Q252, N254, T270, and K274. In contrast, 15 amino acids were found to be non-conserved among 44 interacting amino acids at the interface of C2 homology models. The non-conserved amino acids of C2 were Q127, T144, T147, E234, K237, K241, E249, Y251, D253, K255, R259, E260, A265, S269, and Q273. It is possible that the higher number of non-conserved amino acids in C2 than in C1 is responsible in forming patches of difference that results in the dimer structure of the C2 isoform. The amino acids involved in interface formation identified in the PISA server analysis are highlighted in Fig. S6. We also calculated the electrostatic potential of the structures to determine the difference between these 2 isoforms, where C2 possesses a higher number of non-conserved acidic residues in the interface than the C1 isoform. Mutagenesis studies would help to explain the role of these non-conserved residues involved in interface patches causing dimerization
General discussion
In this report, we expressed and purified several human V-ATPase peripheral stalk subunits and their isoforms and investigated the physical interactions between different isoforms, with the aim of further characterizing the topological organization of the enzyme. The co-expression of 2 E isoforms (E1 and E2) along with 3 G isoforms (G1, G2, and G3) allowed us to express 6 EG isoforms.Citation25) However, when cellular localization is taken into account, some of these isoforms are unlikely to exist in the human body. Specifically, E1G2 and E1G3 are unrealistic combinations, because G2 is brain-specificCitation20,21) and G3 kidney-specificCitation24); therefore, they may not co-exist with the testis-specific E1 isoform. Furthermore, some of these EG-isoforms were unstable for which we were unable to investigate the diversity among isoforms sufficiently to explain the mechanism responsible for cellular localization of different isoforms in forming tissue-specific pumps. The most significant difference was observed between the C1 and C2 isoforms. C1 eluted as a single peak during purification, whereas C2 eluted as 2 peaks, suggesting dimerization.Citation25) Although C2 alone tends to dimerize, we observed that C2 interacted with other subunits/isoforms as a monomer; in the presence of other subunits/isoforms, the C2 dimer peak disappeared. However, we could not distinguish differences in binding affinities among EG and C isoforms utilizing biochemical techniques. From the crystal structure of yeast EGChead, it is known that the N-terminal of E and G both interact with the head domain of the C subunit (Chead).Citation32) Therefore, all EG isoforms can form complexes with C isoforms, and differences among isoforms were not detected in this respect. C2 dimerization has not been observed previously in any mammalian V-ATPase isoform studies, and thus it is difficult to interpret our results. Further studies are necessary to confirm this speculation. From the homology model of the human C2 subunit, we could not conclude whether the structural orientation of dimerization in the human C2 subunit is Chead–Cfoot, Cfoot–Cfoot, or Chead–Chead. However, Drory et al. observed a head-to-tail dimer related by a crystallographic twofold axis in the crystal structure of the yeast C subunit.Citation31) In the present study, multiple sequence alignment of the yeast C and C1/C2 isoforms from different species shows conservation of sequence and structural organization in the amino acids constituting the head, neck, and foot part of the crystal structure of the yeast C subunit (Fig. ). Fig. shows conservation of the C1 and C2 isoforms among species from multiple sequence alignments; Fig. shows structural differences in the same proteins from ConSurf conservational analysis. We used PISA to analyze our homology model of the human C1 and C2 isoforms, with the assumption that a head-to-tail dimer is formed, as is the case in yeast. Therefore, the query structure for PISA analysis was the artificial head-to-tail dimer (based on the yeast C crystal structure) of human C1 and C2 homology models. PISA analysis indicated a higher number of interacting residues in the dimer interface of the C2 isoform than the dimer interface of the C1 isoform, or the yeast C subunit (Fig. , and S6). Further studies are required in order to better understand the role of these interacting residues, and whether these are truly causing dimerization or not.
The C1 isoform is ubiquitously distributed in all mammalian tissues. The ATP6V1C2 gene yields 2 distinctive products by alternative mRNA splicing: C2-a (containing an insertion of 46 residues), which is lung-specific, and C2-b (without an insertion), which is restricted to the kidney and testis. Although these subunits (C1, C2-a, and C2-b) are all structurally different, their functional differences remain unclear.Citation12,23) Sun-Wada et al. showed that V-ATPase containing C2-a or C2-b exhibited a lower Km value or coupling efficiency between ATP hydrolysis and proton transport, suggesting that the C isoforms are involved in the regulation of V-ATPase activity required in different tissues.Citation18) The human C2 isoform that we expressed using a cell-free protein synthesis system and characterized was the C2-b splice variant.
We observed small differences among EG-isoforms in terms of their interaction with the H subunit in gel filtration. The complex band was eluted as a broader peak containing a mixture of the H-EG complex and unbound-free H, E, or G isoforms (Fig. ). To understand the difference of isoform-specific assembly mechanism in isoform-specific tissues, the possible interactions of every combination of isoforms should be examined and evaluated whether they exhibit similar or different affinities each other in in vitro assembly experiments. Thus, the unrealistic combination of interactions of E1G2 and E1G3 with H isoform was examined as in Fig. . Information including such unrealistic combination of interaction provides valuable information for future structural and functional studies. However, such small difference was not confidently demonstrated in case of quantitative estimation using SPR (Table ). We postulated that the kinetic parameters for the interaction of these 3 subunits would be complicated when 1 subunit (H) was immobilized on chip and the other 2 subunits (EG) were flown over as analytes. Moreover, we were naive about the number of binding sites on EG-isoforms for H subunit. The sensorgram curve shape from SPR indicates that the dissociation rate was relatively fast for all H-EG isoforms, thus it should be difficult to interpret the stability of the complex if the association and dissociation rates are too fast. Furthermore, we assume that the H subunit occupies the binding site of the E subunit only, and not of the G subunit. However, G subunit/isoforms might not possess enough strength to withhold together as a strong HEG-isoform-complex without a subunit (in vivo); the H-EG complex may be stabilized by the N-terminal region of a subunit providing a membrane anchor by interacting via the G subunit.
We also attempted to identify differences among other subunits/isoforms from their ternary and quaternary interactions in different combinations. The interactions were similar for all tested combinations of subunits/isoforms, and we could not differentiate any notable influence of isoforms on peripheral stalk formation (Fig. ).
Finally, we did not observe much difference among isoforms and strong influence of the avidity among isoforms on the stability of the complexes. The critical role that V-ATPases play in normal physiological processes seems to be complicated in eukaryotic cells, and likely accounts for both their structural complexity and the array of regulatory mechanisms, which can be controlled by their isoform-specific activity. These isoform-specific mechanisms allow V-ATPases to be localized to distinct cellular environments or organ systems, and to be independently regulated. Thus, we assume that other factors, such as organ-specific signals, posttranscriptional modifications, etc. may be critical factors leading to organ-specific differences in V-ATPase assembly, function or pH regulation. It is also plausible that cellular signals, pH levels, biochemical arrangements, and cell regulation processes might all influence the affinity of different isoforms for each other, resulting in differences in V-ATPase assembly and function at distinct subcellular locations. In mammals, isoform specific V-ATPase assembly factors may exist, analogous to the RAVE complex found in yeast.Citation33) Therefore, we believe that signals other than structural differences play an important role in the assembly of ubiquitous isoforms and tissue-specific isoforms, resulting in formation of cell-specific V-ATPase complexes. In future, high-resolution crystal structure of the mammalian peripheral stalk subunits/isoforms could shed light about the better understanding of the role of tissue-specific isoforms in our cell system.
Conclusion
In this study, we have expressed and purified several isoforms of the human V-ATPase peripheral stalk region and investigated the subunit–subunit/isoform–isoform interactions in different combination. This is the first detail isoform–isoform interaction report from any mammalian V-ATPase. We observed minor difference among isoforms in respect to their subunit–subunit/isoform–isoform interactions from our in vitro studies. Such structural information will facilitate the understanding of the proton translocation mechanism and might clarify the regulation mechanism of tissue-specific V-ATPase.
Authors contribution
Conceived and designed the experiments: Suhaila Rahman, Ichiro Yamato, Takeshi Murata. Performed the experiments: Suhaila Rahman. Analyzed the data: Suhaila Rahman, Ichiro Yamato, Shinya Saijo, Takeshi Murata. Contributed reagents/materials/analysis tools: Ichiro Yamato, Kenji Mizutani, Yuuki Takamuku, Yoshiko Ishizuka-Katsura, Noboru Ohsawa, Takaho Terada, Mikako Shirouzu, Shigeyuki Yokoyama. Wrote the paper: Suhaila Rahman, Ichiro Yamato, Takeshi Murata.
Funding
This work was supported by the ‘Platform Project for Supporting in Drug Discovery and Life Science Research’ (Platform for Drug Discovery, Informatics, and Structural Life Science) from the Ministry of Education, Culture, Sports, Science and Technology of Japan (MEXT); Japan Agency for Medical Research and development (AMED).
Supplemental materials
The supplemental material for this paper is available at http://dx.doi.org/10.1080/09168451.2015.1135043.
Disclosure statement
No potential conflict of interest was reported by the authors.
Supplementary_files.zip
Download Zip (3.5 MB)Acknowledgments
The authors thank Dr. M. Toyoma, M. Inoue and K. Honda for technical support with cloning experiments.
Notes
Abbreviations: V-ATPase, vacuolar-type H+-ATPases; V1, soluble domain of the vacuolar ATPase; Vo, membrane bound domain of the vacuolar ATPase; Cfoot, foot domain of yeast C subunit; Chead, head domain of yeast C subunit; HEPES, 2-[4-(2-hydroxyethyl)-1-piperazinyl] ethanesulfonic acid; SPR, surface plasmon resonance; Sarkosyl, sodium lauroyl sarcosinate (sodium [dodecanoyl(methyl)amino]acetate or sarkosyl).
Related Research Data
References
- Stevens TH, Forgac M. Structure, function and regulation of the vacuolar (H+)-ATPase. Annu. Rev. Cell Dev. Biol. 1997;13:779–808.10.1146/annurev.cellbio.13.1.779
- Futai M, Oka T, Moriyama Y, et al. Diverse roles of single membrane organelles: factors establishing the acid lumenal pH. J. Biochem. 1998;124:259–267.10.1093/oxfordjournals.jbchem.a022105
- Futai M, Oka T, Sun-Wada G, et al. Luminal acidification of diverse organelles by V-ATPase in animal cells. J. Exp. Biol. 2000;203:107–116.
- Nelson N, Harvey WR. Vacuolar and plasma membrane proton adenosinetriphosphatases. Physiol. Rev. 1999;79:361–385.
- Nishi T, Forgac M. The vacuolar (H+)-ATPases – nature’s most versatile proton pumps. Nat. Rev. Mol. Cell Biol. 2002;3:94–103.10.1038/nrm729
- Gluck SL, Underhill DM, Iyori M, et al. Physiology and biochemistry of the kidney vacuolar H+-ATPase. Annu. Rev. Physiol. 1996;58:427–445.10.1146/annurev.ph.58.030196.002235
- Wieczorek H, Brown D, Grinstein S, et al. Animal plasma membrane energization by proton-motive V-ATPases. BioEssays. 1999;21:637–648.10.1002/(SICI)1521-1878(199908)21:8<>1.0.CO;2-D
- Imai-Senga Y, Sun-Wada GH, Wada Y, et al. A human gene, ATP6E1, encoding a testis-specific isoform of H+-ATPase subunit E. Gene. 2002;289:7–12.10.1016/S0378-1119(02)00542-5
- Smith AN, Lovering RC, Futai M, et al. Revised nomenclature for mammalian vacuolar-type H+-ATPase subunit genes. Mol. Cell. 2003;12:801–803.10.1016/S1097-2765(03)00397-6
- Blake-Palmer KG, Su Y, Smith AN, et al. Molecular cloning and characterization of a novel form of the human vacuolar H+-ATPase e-subunit: an essential proton pump component. Gene. 2007;393:94–100.10.1016/j.gene.2007.01.020
- Miranda KC, Karet FE, Brown D. An extended nomenclature for mammalian V-ATPase subunit genes and splice variants. PLoS One. 2010;5:e9531.10.1371/journal.pone.0009531
- Sun-Wada GH, Wada Y. Vacuolar-type proton pump ATPases: roles of subunit isoforms in physiology and pathology. Histol. Histopathol. 2010;25:1611–1620.
- Toyomura T, Oka T, Yamaguchi C, et al. Three subunit a isoforms of mouse vacuolar H+-ATPase. Preferential expression of the a3 isoform during osteoclast differentiation. J. Biol. Chem. 2000;275:8760–8765.10.1074/jbc.275.12.8760
- Oka T, Murata Y, Namba M, et al. a4, a Unique kidney-specific isoform of mouse vacuolar H+-ATPase subunit a. J. Biol. Chem. 2001;276:40050–40054.10.1074/jbc.M106488200
- Nishi T, Forgac M. Molecular cloning and expression of three isoforms of the 100-kDa a subunit of the mouse vacuolar proton-translocating ATPase. J. Biol. Chem. 2000;275:6824–6830.10.1074/jbc.275.10.6824
- Smith AN, Finberg KE, Wagner CA, et al. Molecular cloning and characterization of Atp6n1b: a novel fourth murine vacuolar H+-ATPase a-subunit gene. J. Biol. Chem. 2001;276:42382–42388.10.1074/jbc.M107267200
- Sun-Wada GH, Imai-Senga Y, Yamamoto A, et al. A proton pump ATPase with testis-specific E1-subunit isoform required for acrosome acidification. J. Biol. Chem. 2002;277:18098–18105.10.1074/jbc.M111567200
- Sun-Wada GH, Murata Y, Namba M, et al. Mouse proton pump ATPase C subunit isoforms (C2-a and C2-b) specifically expressed in kidney and lung. J. Biol. Chem. 2003;278:44843–44851.10.1074/jbc.M307197200
- Sun-Wada GH, Yoshimizu T, Imai-Senga Y, et al. Diversity of mouse proton-translocating ATPase: presence of multiple isoforms of the C, d and G subunits. Gene. 2003;302:147–153.10.1016/S0378-1119(02)01099-5
- Crider BP, Andersen P, White AE, et al. Subunit G of the vacuolar proton pump. Molecular characterization and functional expression. J. Biol. Chem. 1997;272:10721-10728.
- Murata Y, Sun-Wada GH, Yoshimizu T, et al. Differential localization of the vacuolar H+ pump with G subunit isoforms (G1 and G2) in mouse neurons. J. Biol. Chem. 2002;277:36296–36303.10.1074/jbc.M200586200
- Hayashi K, Sun-Wada GH, Wada Y, et al. Defective assembly of a hybrid vacuolar H+-ATPase containing the mouse testis-specific E1 isoform and yeast subunits. Biochim. Biophys. Acta. 2008;1777:1370–1377.10.1016/j.bbabio.2008.06.011
- Feng NH, Lin HI, Wang JS, et al. Differential expression of a V-type ATPase C subunit gene, Atp6v1c2, during culture of rat lung type II pneumocytes. J. Biomed. Sci. 2005;12:899–911.10.1007/s11373-005-9020-3
- Norgett EE, Borthwick kJ, Al-Lamki RS, et al. V1 and V0 domains of the human H+-ATPase are linked by an interaction between the G and a subunits. J. Biol. Chem. 2007;282:14421–14427.10.1074/jbc.M701226200
- Rahman S, Ishizuka-Katsura Y, Arai S, et al. Expression, purification and characterization of isoforms of peripheral stalk subunits of human V-ATPase. Protein Expr. Purif. 2011;78:181–188.10.1016/j.pep.2011.02.012
- Terada T, Murata T, Shirouzu M, et al. Cell-free expression of protein complexes for structural biology. Methods Mol. Biol. 2014;1091:151–159.10.1007/978-1-62703-691-7
- Rahman S, Yamato I, Saijo S, et al. Biochemical and biophysical properties of interactions between subunits of the peripheral stalk region of human V-ATPase. PLoS One. 2013;8:e55704.10.1371/journal.pone.0055704
- Laemmli UK. Cleavage of structural proteins during the assembly of the head of bacteriophage T4. Nature. 1970;227:680–685.10.1038/227680a0
- Rahman S, Arai S, Saijo S, et al. Sarkosyl is a good regeneration reagent for studies on vacuolar-type ATPase subunit interactions in Biacore experiments. Anal. Biochem. 2011;418:301–303.10.1016/j.ab.2011.07.009
- Féthière J, Venzke D, Diepholz M, et al. Building the stator of the yeast vacuolar-ATPase. J. Biol. Chem. 2004;279:40670–40676.10.1074/jbc.M407086200
- Drory O, Frolow F, Nelson N. Crystal structure of yeast V-ATPase subunit C reveals its stator function. EMBO Rep. 2004;5:1148-1152.10.1038/sj.embor.7400294
- Oot RA, Huang LS, Berry EA, et al. Crystal structure of the yeast vacuolar ATPase heterotrimeric EGC (head) peripheral stalk complex. Structure. 2012;20:1881–1892.10.1016/j.str.2012.08.020
- Smardon AM, Diab HI, Tarsio M, et al. The RAVE complex is an isoform-specific V-ATPase assembly factor in yeast. Mol. Biol. Cell. 2014;25:356–367.10.1091/mbc.E13-05-0231