
Abstract
A stable isotope dilution assay (SIDA) for two taste-active pyroglutamyl decapeptide ethyl esters (PGDPE1; (pGlu)LFGPNVNPWCOOC2H5, PGDPE2; (pGlu)LFNPSTNPWCOOC2H5) in sake was developed using deuterated isotopes and high-resolution mass spectrometry. Recognition thresholds of PGDPEs in sake were estimated as 3.8 μg/L for PGDPE1 and 8.1 μg/L for PGDPE2, evaluated using 11 student panelists aged in their twenties. Quantitated concentrations in 18 commercial sake samples ranged from 0 to 27 μg/L for PGDPE1 and from 0 to 202 μg/L for PGDPE2. The maximum levels of PGDPE1 and PGDPE2 in the sake samples were approximately 8 and 25 times higher than the estimated recognition thresholds, respectively. The results indicated that PGDPEs may play significant sensory roles in the sake. The level of PGDPEs in unpasteurized sake samples decreased during storage for 50 days at 6 °C, suggesting PGDPEs may be enzymatically decomposed.
Fermented foodstuffs contain many functional and/or taste-active peptides.Citation1–3) Noteworthy peptides have been reported in sake,Citation4–10) a Japanese traditional alcoholic beverage fermented from rice and water with simultaneous saccharification by koji mold enzymes and alcoholic fermentation by sake yeast. Peptides previously isolated from sake have been reported to have angiotensin I converting enzyme inhibitory activityCitation5,7) or hepatoprotective ability.Citation10) Most of the reported peptides consist of 5 or fewer amino acid residues;Citation5,9,10) however, hydrophobic oligopeptides of 6 to 14 amino acid residues have been identified. These peptides are derived from two different N-termini of the rice glutelin acidic subunit and are reported to be prolyl endopeptidase inhibitorsCitation6) and/or distinct bitter-tasting constituents.Citation8) The levels of bitter-tasting peptides in charcoal untreated sake are far higher than their thresholds; however, they are easily removed by charcoal treatment which is commonly applied as a final refining step in sake manufacturing.Citation8) In recent years, charcoal untreated sake products have increased because treatment damages the harmony of sake flavors. Interest in hydrophobic tasting compounds from sake is increasing; therefore, we performed taste dilution analysis.Citation11) Two pyroglutamyl decapeptides whose carboxylic-termini were esterified by ethanol (PGDPE1: (pGlu)LFGPNVNPWCOOC2H5 and PGDPE2: (pGlu)LFNPSTNPWCOOC2H5) were found in the analysis, together with tryptophol, ferulic acid, ethyl ferulate, and other bitter-tasting peptides.Citation11) The concentration of PGDPEs in the sake sample was far lower than other taste-active constituents, and could not be determined by UV-monitoring HPLC. The sensory properties of some bitter-tasting peptides,Citation8) ferulic acid and ethyl ferulate have been examined;Citation12) however, the sensory properties of PGDPEs have not been studied because authentic compounds have not been commercially available.
Low molecular weight peptides in sake have previously been analyzed by LC-MS or LC-MS/MS.Citation9,10,13) PGDPEs are relatively large molecules (more than 1,000 Da) which often form Na+ additives and divalent ions during MS sample preparation. In addition, their ionization ratios in ESI–MS are strongly influenced by the coexistent constituents. Hence, accurate quantification of PGDPEs in sake samples requires an appropriate pre-treatment and compensation in MS analysis. Stable isotope dilution assays (SIDA) have been employed in quantitating targets in alcoholic beverages or in ingredient materials with analytical difficulties such as trace odorants,Citation14–17) flavor precursors,Citation18–20) and mycotoxins.Citation21) We determined whether SIDA would resolve the problems in PGDPE quantitation.
The first aim of this study was to establish a reliable SIDA for quantitation of PGDPEs in sake using high-resolution MS apparatus and determine the level of PGDPEs in commercial sake samples. The second aim was to examine the sensory properties of PGDPEs in sake, including thresholds. The third aim was to evaluate the sensory significance of PGDPEs in sake from quantitation and sensory data. The results of this study may provide an effective analytical tool and fundamental knowledge on the sensory properties of PGDPEs.
Materials and methods
Chemicals and materials
Pyroglutamyl decapeptides, (pGlu)LFGPNVNPW and (pGlu)LFNPSTNPW, were obtained from Medical & Biological Laboratories Co., Ltd. (Nagoya, Japan). Super dehydrated ethanol (99.5%), anhydrous ethanol (D, 99%), acetyl chloride (98%), and ethanol (95%) were purchased from Wako Pure Chemical Industries Co. Ltd. (Osaka, Japan). Acetonitrile (LC/MS grade) was obtained from Thermo Fisher Scientific Co. (Kanagawa, Japan). Sake samples were purchased from local markets in Tokyo or Akita city.
Synthesis of PGDPEs
Ethyl esterification of pyroglutamyl decapeptides was conducted according to the method of Kim et al.Citation22) Acetyl chloride (0.75 mL) was dropped into dehydrated ethanol (4.25 mL) to produce alcoholic HCl and the solution was mixed with10 mg of pyroglutamyl decapeptides in a glass vessel. After the reaction at 37 °C for 3 h, volatiles were removed using a rotary evaporator. The residue was dissolved in approximately 0.5 mL of 47.5% (v/v) aqueous ethanol solution, before being applied to HPLC for purification. Target fractions were collected and analyzed by MS and then solvent was removed under vacuum. From 10 mg of (pGlu)LFGPNVNPW, 4.4 mg of (pGlu)LFGPNVNPWCOOC2H5 (PGDPE1) (purity 96% by HPLC) was obtained: MS (ESI+) m/z: 1182.57 [M + H]+, 591.79 [M+2H]2+, 1204.56 [M+Na]+. (pGlu)LFNPSTNPW (10 mg) produced 4.2 mg of (pGlu)LFNPSTNPWCOOC2H5 (PGDPE2) (purity 90%): MS (ESI+) m/z: 1214.59 [M+H]+, 607.80 [M+2H]2+, 1236.57 [M+Na]+. Synthesized compounds were stored at –20 °C until use and dissolved in 47.5% (v/v) aqueous ethanol solution when required. Deuterated PGDPEs were synthesized using anhydrous ethanol-D6 (D, 99%) using a 1/10 scale of natural PGDPE synthesis. The obtained residue was dissolved in 100 μL of 50% (v/v) aqueous acetonitrile solution and purified by HPLC. Synthesized PGDPEs contained d5-d10 labeled isotopes; d7 was the largest in both PGDPE samples: MS (ESI+) m/z: 1189.63 [M+d7+H]+ for PGDPE1 and MS (ESI+) m/z: 1221.62 [M+d7+H]+ for PGDPE2.
HPLC
HPLC was conducted using a Gilson HPLC system consisting of two pumps (models 305 and 307) (Gilson Inc., Middleton, WI, USA) and a UV-visible detector (model SPD-20A, Shimadzu, Kyoto, Japan) with a Capcell Pak C18 Type MG column(4.5 mm × 150 mm, 5 μm)(Shiseido, Tokyo, Japan). Solvent A was acetonitrile, and solvent B was 0.1% phosphoric acid/water. A linear gradient was used from A: B = 30: 70 to A: B = 45: 55 over 30 min at a flow rate of 1.0 mL/min. Absorbance at 200 nm was monitored. Injection volume was 20–200 μL for purification and 5–20 μL for analysis.
Quantitation of PGDPEs in sake
Deuterated PGDPEs in 10 μL of 25 μg/mL 50% (v/v) aqueous acetonitrile solution (each PGDPE, 0.25 μg) were added to 1.0 mL of sake sample. The solution was then applied to a pre-conditioned (7 mL of methanol and then 7 mL of water) Bond Elute C18 LRC 500MG column (Agilent Technologies, Santa Clara, CA, USA). The column was washed with 2 mL of water and then 2 mL of 38% (v/v) aqueous ethanol solution successively. Trapped constituents were eluted with 0.6 mL of 95% ethanol into a glass vial. After solvent removal under vacuum, the residue was dissolved in 40 μL of 47.5% (v/v) aqueous ethanol solution and 5 μL was applied to MS analysis. The ESI–MS analysis was conducted using an Exactive mass spectrometer (Thermo Fisher Scientific, Waltham, MA, USA) without LC separation. The flow-rate for injection was 200 μL/min and the injection solvent was 80% (v/v) aqueous methanol solution. The voltage for ESI was +4.0 kV in the positive mode. Signal abundance of 0.02–0.2 min after injection was used for quantitation. For quantitation, MS signal intensities from Na adducts of natural and deuterated peptides were used: PGDPE1 m/z = 1204.5, PGDPE2 m/z = 1236.5, PGDPE1-d7 m/z = 1211.6, and PGDPE2-d7 m/z = 1243.6. Calibration curves were constructed using a model sake solution consisting of 17% (v/v) aqueous ethanol solution with 50 mM Na-succinate buffer (pH 4.3) to which natural and deuterated PGDPEs were added (natural/deuterated = 0.23–2.33 for PGDPE1, 0.12–1.23 for PGDPE2). The concentration of natural or deuterated PGDPEs used in this experiment was adjusted according to the UV (200 nm) -monitored HPLC data. An accuracy and precision assessment was conducted using a commercial sake (ethanol concentration, 13–14% (v/v)) in which the absence of PGDPEs was previously confirmed. Natural PGDPEs were added to the sake, at 50 μg/L: 8 samples were prepared and analyzed 3 times each using MS to calculate the relative standard deviation (RSD) and recovery ratio. The detection limit was calculated from the standard deviation values of the quantitated data in which PGDPEs were added at 10 μg/L. Data were obtained from 10 sample preparations analyzed 3 times using MS.
Threshold assessment of PGDPEs in sake
The threshold of PGDPEs in sake was examined according to the BCOJ sensory analysis method (Brewery Convention of Japan, 2002)Citation23) which is founded on the forced-choice ascending concentration series method of limits of ASTM E-679. The base sake used was the same as that used in the quantitation experiments. Assessors were made up of 11 undergraduate student panelists aged in their twenties who were trained using authentic PGDPE compounds. Assessors dropped 0.2 mL of sample onto their tongues using a pipette and assessed the taste.Citation12) We presented four sets of the triangular test, even though the official method demanded 6 sets of the triangular test, this was to prevent sensory fatigue of the assessor. If the threshold was not found in the presented test set, another set of triangular tests which included the lower or the higher level was presented to the assessor. We were able to obtain threshold differences using this method, in addition, a recognition threshold was estimated using the concentration at which the assessor vocally communicated they recognized the taste.
Results and discussion
Synthesis of PGDPEs
Ethyl esterification of pyroglutamyl decapeptides was performed using commercially available dehydrated ethanol or anhydrous ethanol-D6. Synthesized PGDPEs and deuterated PGDPEs showed the same retention time in HPLC analysis as PGDPEs isolated from sake samples. In the deuterated PGDPE samples, d6–d10 isotopes were found together with the d5 isomer which might be the ester of d5-ethanol. The d6–d10 isotopes might be formed by a substitution between the exchangeable H in pyroglutamyl decapeptides and the D+ formed in the reaction mixture. The amide hydrogen which forms the hydrogen bond in proteins is easily exchanged by deuterium in the D2O solution.Citation24) The amide hydrogen in the side chain of amino acid residues in peptides is also easily exchangeable;Citation25) however, synthesized d6–d10 PGDPE isotopes were stable during 50 days of storage in the 50% (v/v) aqueous acetonitrile solution (Table ). The observed stability of synthesized PGDPE isotopes suggested that the H→D substitution in the esterification reaction did not occur at the amide hydrogen in PGDPEs. It was suggested that the substitution occurred at the D+ exchangeable but more stable hydrogen, for example, at the indole ring substituted hydrogen.
Table 1. Ratio of deuterated PGDPE isotopes immediately after synthesis and after 50 days storage.
Verification of the developed SIDA
Verification data for the developed SIDA are shown in Table . Calibration curves showed good linearity and the gradients of two calibration curves were stable for 50 days after synthesis. The RSDs were both under 3.5% and recovery ratios of spiked PGDPEs at 50 μg/L were over 90%. The estimated detection limits were lower than the estimated thresholds (Table ). These results indicated that the developed method was accurate and reliable in the quantitation of PGDPEs in sake using only 1 mL of sample.
Table 2. Verification data of SIDA.
Table 3. Best estimated threshold (BET) values and their range values.
Quantitation of PGDPEs in sake
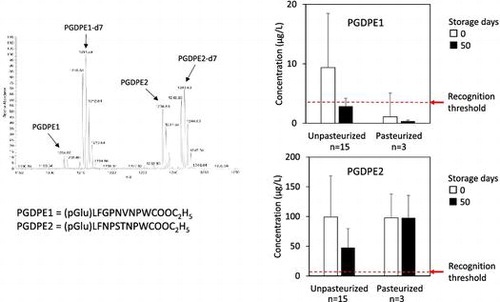
PGDPEs in 18 commercial sake samples (unpasteurized 15, pasteurized 3) were quantitated immediately after purchase and after storage for 50 days at 6 °C. MS analysis is shown in Fig. . In the quantitation procedure, the volume of 38% (v/v) aqueous ethanol solution used in the Bond Elute column washing was crucial as it affected the amount of residual coexistent constituents: excess coexistent constituents significantly suppressed ionization of PGDPEs in ESI–MS analysis. Each isotope was clearly detected according to their m/z signals. The concentration of PGDPE1 in the samples immediately after purchase ranged from 0 to 27 μg/L (Fig. A), and that of PGDPE2 ranged from 0 to 202 μg/L (Fig. B); the averages for 18 samples were 8.0 μg/L and 99.0 μg/L, respectively. The level of PGDPEs was far lower than the levels of other bitter tasting peptides previously measured in sake.Citation11) Differences in the concentration of PGDPEs among the samples were large. No clear correlations were observed between rice cultivars or between pasteurized and non-pasteurized sake samples. Unpasteurized samples showed a decrease in PGDPEs when measured after 50 days storage which was not observed in the pasteurized samples except for PGDPE1 in the sample No. 18. The decrease might be due to decomposition by koji enzyme(s) still active in the sake sample. PGDPEs in two sake samples (No. 5 and 13) were below the detection limits at 0 storage days even though they were charcoal untreated products. This may have been due to fast enzymatic decomposition of PGDPEs in the moromi mash and in the sake product.
Fig. 1. MS analysis of sake sample No. 14.
Fig. 2. Quantitated levels of PGDPE1 (Fig. A) and PGDPE2 (Fig. B) in commercial sake samples.
Sensory analysis of PGDPEs in sake
Estimated sensory PGDPE thresholds are shown in Table . Recognition thresholds were very similar to the difference thresholds. The panelists’ best estimated recognition thresholds (BETs) were widely distributed. At the recognition threshold, 5/11 panelists described PGDPE1 in a negative manner, such as bitter and/or astringent; however, 4/11 panelists described PGDPE1 in a positive manner: rich, full, mild, and/or good sake likeness. Similar comments were obtained for PGDPE2: positive expressions were obtained from 5/11 panelists and negative expressions from 4/11 panelists. The results suggested that PGDPEs have bilateral taste characteristics. From the low thresholds and taste characteristics, it was suggested that PGDPEs play positive roles for some people and negative roles for others. In a previous study, no positive expressions were reported for bitter-tasting peptides, in spite of the high similarity in molecular structure with PGDPEs.Citation11) It was suggested that ethyl esterification of the C-terminal carboxyl group in PGDPEs might change the taste characteristics to produce similar effects as the methyl or ethyl esterifications of the carboxyl group of particular dipeptides such as aspartylphenylalanine, which is very sweet.Citation26) The estimated thresholds for PGDPEs were far lower than previously reported for bitter-tasting peptides,Citation11,27–29) where elongation of the peptide chain is sometimes a bitter taste increasing factor; however, the low threshold for PGDPEs could not be explained by the peptide lengths because they were comparable to the bitter-tasting peptides.Citation11) Although PGDPEs are not simple bitter-tasting compounds, their thresholds were comparable with denatonium benzoate, the most bitter compound ever known.Citation30) It was reported that acetylation of the amino group and ethyl esterification of the carboxyl group of tryptophan lowered its threshold more than 10 times that of the free amino acid.Citation31) Similar effects may contribute to the observed low threshold in PGDPEs.
Conclusion
A newly developed SIDA, using deuterated isotopes and high-resolution MS, accurately quantitated PGDPEs in a small sake sample (1 mL). This is the first study to report estimated thresholds of PGDPEs in sake. The maximum level of PGDPE1 and PGDPE2 in the sake samples was approximately 8 and 25 times higher than each recognition threshold, respectively, suggesting PGDPEs may play significant sensory roles in sake taste. The newly developed SIDA method could be used in future studies to help determine how PGDPEs are formed in the sake manufacturing process and what affects the level of PGDPEs in sake.
Author contribution
K.H. designated the study. All authors performed the experiments. K.H. and T.I. wrote the manuscript.
Funding
This work was supported by JSPS KAKENHI [grant number 26450181].
Acknowledgments
We are grateful to the students of the Food and Brewing Group, Department of Biological Resource Sciences of Akita Prefectural University for their assistance with the sensory analysis.
Disclosure statement
No potential conflict of interest was reported by the authors.
References
- Korhonen H, Pihlanto A. Food-derived bioactive peptides-opportunities for Designing Future foods. Curr Pharm Des. 2003;9:1297–1308.10.2174/1381612033454892
- Maehashi K, Huang L. Bitter peptides and bitter taste receptors. Cell Mol Life Sci. 2009;66:1661–1671.10.1007/s00018-009-8755-9
- Martínez-Maqueda D, Miralles B, Recio I, et al. Antihypertensive peptides from food proteins: a review. Food Funct. 2012;3:350–361.10.1039/c2fo10192k
- Takahashi K, Tadenuma M, Kitamoto K, et al. L-Prolyl-L-leucine anhydride. A bitter compound fromed in aged sake. Agric Biol Chem. 1974;38:927–932.10.1080/00021369.1974.10861271
- Saito Y, Wanezaki (Nakamura) K, Kawato A, et al. Structure and activity of angiotensin I converting enzyme inhibitory peptides from sake and sake lees. Biosci Biotechnol Biochem. 1994;58:1767–1771.10.1271/bbb.58.1767
- Saito Y, Ohura S, Kawato A, et al. Prolyl endopeptidase inhibitors in sake and its byproducts. J Agric Food Chem. 1997;45:720–724.10.1021/jf9604706
- Yamada T, Furukawa K, Hara S, et al. Isolation of copper-tolerant mutants of sake yeast with defective peptide uptake. J Biosci Bioeng. 2005;100:460–465.10.1263/jbb.100.460
- Hashizume K, Okuda M, Numata M, et al. Bitter-tasting sake peptides derived from the N-terminus of the rice glutelin acidic subunit. Food Sci Technol Res. 2007;13:270–274.10.3136/fstr.13.270
- Sugimoto M, Kaneko M, Onuma H, et al. Changes in the charged metabolite and sugar profiles of pasteurized and unpasteurized Japanese sake with storage. J Agric Food Chem. 2012;60:2586–2593.10.1021/jf2048993
- Kiyono T, Hirooka K, Yamamoto Y, et al. Identification of pyroglutamyl peptides in Japanese rice wine (sale): presence of hepatoprotective pyroGlu-Leu. J Agric Food Chem. 2013;61:11660–11667.10.1021/jf404381w
- Hashizume K, Ito T, Shimohashi M, et al. Taste-guided fractionation and instrumental analysis of hydrophobic compounds in sake. Biosci Biotechnol Biochem. 2012;76:1291–1295.10.1271/bbb.120046
- Hashizume K, Ito T, Shimohashi M, et al. Ferulic acid and ethyl ferulate in sake: comparison of levels between sake and mirin and analysis of their sensory properties. Food Sci Technol Res. 2013;19:705–709.10.3136/fstr.19.705
- Takahashi K, Tokuoka M, Kohno H, et al. Comprehensive analysis of dipeptides in alcoholic beverages by tag-based separation and determination using liquid chromatography/electrospray ionization tandem mass spectrometry and quadrupole-time-of flight mass spectrometry. J Chromatogr A. 2012;1242:17–25.10.1016/j.chroma.2012.03.076
- Pollnitz AP, Jones GP, Sefton MA. Determination of oak lactones in barrel-aged wines and in oak extracts by stable isotope dilution analysis. J Chromatogr A. 1999;857:239–246.10.1016/S0021-9673(99)00785-2
- Steinhaus M, Fritsch HT, Schieberle P. Quantitation of (R)- and (S)-linalool in beer using solid phase microextraction (SPME) in combination with a stable isotope dilution assay (SIDA). J Agric Food Chem. 2003;51:7100–7105.10.1021/jf0347057
- Kotseridis YS, Spink M, Brindle ID, et al. Quantitative analysis of 3-alkyl-2-methoxypyrazines in juice and wine using stable isotope labelled internal standard assay. J Chromatogr A. 2008;1190:294–301.10.1016/j.chroma.2008.02.088
- Luisier JL, Buettner H, Völker S, et al. Quantitation of cysteine S-conjugate of 3-sulfanylhexan-1-ol in must and wine of Petite Arvine vine by stable isotope dilution analysis. J Agric Food Chem. 2008;56:2883–2887.10.1021/jf072963o
- Roland A, Schneider R, Guernevé C, et al. Identification and quantification by LC-MS/MS of a new precursor of 3-mercaptohexan-1-ol(3MH) using stable isotope dilution assay: elements for understanding the 3MH production in wine. Food Chem. 2010;121:847–855.10.1016/j.foodchem.2009.12.095
- Dungey KA, Hayasaka Y, Wilkinson KL. Quantitative analysis of glycoconjugate precursors of guaiacol in smoke-affected grapes using liquid chromatography-tandem mass spectrometry based stable isotope dilution analysis. Food Chem. 2011;126:801–806.10.1016/j.foodchem.2010.11.094
- Isogai A, Kanda R, Sudo S, et al. Quantitation of the DMTS precursor, 1,2-dihydroxy-5-(methylsulfinyl) pentane-3-one (DMTS-P1) in alcoholic beverages and fermented solutions by a stable isotope dilution analysis. J Brew Soc Jpn. 2013;108:605–614.
- Rychlik M, Asam S. Stable isotope dilution assays in mycotoxin analysis. Anal Bioanal Chem. 2008;390:617–628.10.1007/s00216-007-1717-x
- Kim TY, Brun YV, Reilly JP. Effects of tryptic peptide esterification in MALDI mass spectrometry. Anal Chem. 2005;77:4185–4193.10.1021/ac0481250
- Brewery Convention of Japan, BCOJ Kanno Hyoka Ho. Threshold of added substances. Tokyo: Nippon Jozo Kyokai; 2002.
- Smith DL, Deng Y, Zhang Z. Probing the non-covalent structure of proteins by amide hydrogen exchange and mass spectrometry. J Mass Spectro. 1997;32:135–146.10.1002/(ISSN)1096-9888
- Bai Y, Milne JS, Mayne L, et al Primary structure effects on peptide group hydrogen exchange. Proteins: Struct Funct Genet. 1993;17:75–86.10.1002/(ISSN)1097-0134
- Mazur RH, Schlatter JM, Goldkamp AH. Structure-taste relationships of some dipeptides. J Am Chem Soc. 1969;91:2684–2691.10.1021/ja01038a046
- Otagiri K, Nosho Y, Shinoda I, et al. Studies on a model of bitter peptides including arginine, proline and phenylalanine rsidues. I. Bitter taste of di- and tripeptides, and bitterness increase of the model peptides by extension of the peptide chain. Agric Biol Chem. 1985;49:1019–1026.
- Tamura M, Miyoshi T, Mori N, et al. Mechanism for the bitter tasting potency of peptides using O-aminoacyl sugars as model compounds. Agric Biol Chem. 1990;54:1401–1409.
- Kim HO, Li-Chan ECY. Quantitative structure−activity relationship study of bitter peptides. J Agric Food Chem. 2006;54:10102–10111.10.1021/jf062422j
- Schiffman SS, Gatlin LA, Sattery-Miller EA, et al. The effect of sweeteners on bitter taste in young and elderly subjects. Brain Res Bull. 1994;35:1892–1892.
- Matoba T, Hata T. Relationship between bitterness of peptides and their chemical structures. Agric Biol Chem. 1972;36:1423–1431.10.1080/00021369.1972.10860410