
Abstract
We evaluated the effect of heat–moisture treatment (HMT) on the main chemical components, physical properties, and enzyme activities of two types of brown rice flour: high-amylose Koshinokaori and normal-quality Koshiibuki. Five different HMTs using brown rice (moisture content was 12.0%) were assessed: 0.1 MPa/120 °C for 5 or 10 min, 0.2 MPa/134 °C for 5 or 10 min and 0.3 MPa/144 °C for 10 min. HMT, decreased the α-amylase and lipase activities, and fat acidity, and slightly increased the dietary fiber and resistant starch levels. After 2 months’ storage at 35 °C, rice samples that were treated with 0.2 MPa/134 °C or 0.3 MPa/144 °C for 10 min had a lower fat acidity than untreated samples, which would be useful for long-term storage and export of rice flour. And HMT exhibited inhibition of retrogradation in the pasting and physical properties, which is profitable to promote the qualities of the rice products.
Graphical abstract
There was no increase in the fat acidity of the samples treated with 0.3 MPa/10 min HMT during 2 months’ storage at 35 °C.
Rice (Oryza sativa L.) is one of the main food crops in the world and a staple food for over half of the global population. Therefore, it is necessary to improve the quality of rice. As diabetes is one of the lifestyle diseases, disease prevention is very important in addition to the development of curing technology. Low glycemic index (GI) foods inhibit rapid increases in blood glucose and insulin secretion after meals.
Several studies have reported on the development of rice that is high in resistant starch rice,Citation1,2) or amylose and dietary-fiber through physical or chemical mutation.Citation3) Furthermore, both animal and clinical studies have shown that indigestible dextrin (ID)Citation4) regulates the functions of the intestines, moderates the postprandial blood glucose levels, lowers serum lipid levels, and reduces body fat.Citation5)
The glycemic effect of food depends on numerous factors, including the structure of the amylose and amylopectin it contains.Citation6) Kurahashi et al.Citation7) and Taniguchi et al.Citation8) reported that starch that has been subjected to heat–moisture treatment (HMT) is rich in RS, while Saito et al.Citation9) and Itou et al.Citation10) showed that the short-chain fatty acid concentration is higher in high-amylose corn starch and HMT high-amylose corn starch than in ordinary corn starch. HMT also appears to change the granules of wheat flour, causing them to have a flattened shape when viewed under a scanning electron microscope (SEM).Citation11) Kawabata et al.Citation12) reported that the swelling power and solubility of starch is considerably suppressed following HMT, while Takahashi et al.Citation13,14) and Billiaderis et al.Citation15) showed that amylose-lipid complexes are formed in rice flour during HMT by examining X-ray diffraction patterns. Cereal starch usually has lipids bound firmly in the granules.Citation16) Furthermore, Fukui and NikuniCitation17) and Kitahara et al.Citation18) reported that a new crystalline structure of helical starch complexes is formed in cereal starch, following HMT, which includes the lipid materials that are usually firmly bound in the starch granules. Lagendijik and PenningsCitation19) further reported that monoglycerides that consist of linear and saturated fatty acids easily form complexes with starches, whereas those that consist of unsaturated fatty acids such as oleic acid rarely do so because of the bending structure of the double bonds in the fatty acids. In rice, the main lipids are triglycerides in the bran, free fatty acids in the endosperm, and almost exclusively monoacyl lipids in the rice starch.Citation20–22)
Fat acidity is one of the most important factors affecting the quality of rice during storage. Fat acidity generally increase as storage progresses, but the rate of increase is suppressed by heating, with higher temperature and longer periods of heating leading to lower fat acidity.Citation23,24) In addition, Shibuya et al.Citation25) reported that the fat acidity of milled rice increases more rapidly than brown rice, moreover, during storage, resulting in greater changes in the flavor and taste of milled rice.
In Japan, rice flour is classified into two types: raw and pre-gelatinized, which is prepared by heating (steaming or boiling), drying and pulverizing the rice grain.Citation26) HMT changes the physicochemical properties of starches by facilitating starch chain interactions within the amorphous and crystalline domains, and/or by disrupting starch crystallites.Citation27,28)
The brown rice contains many molecules with antioxidant activity, including phenolic acids, flavonoids, anthocyanins, proanthocyanidins, tocopherols, tocotrienols, γ-oryzanol, and phytic acid. Rice bran also contains various functional substances, such as γ-oryzanol, ferulic acid, sterol, wax, ceramide, phytin, inositol, and protein.Citation29) Furthermore, rice bran oil, which is the only domestic edible vegetable oil made from rice bran that is produced in Japan, is known to have high oxidative stability and serum cholesterol-lowering activity.Citation30,31)
HMT is a physical method that can be used to improve the functional properties of starch according to the required application, with the source of the starch and the treatment conditions, including time and temperature, affecting the final characteristics.
We aimed to develop new brown rice flour, of which quality would be improved, and its quality deterioration during the storage would be inhibited. Therefore, in the present study, we investigated the properties and storage stability of two types of brown rice flour under five different HMTs; 0.1 MPa/5 min, 0.1 MPa/10 min, 0.2 MPa/5 min, 0.2 MPa/10 min and 0.3 MPa/10 min. We then used the finding to determine the optimal HMT conditions for each of these rice cultivars. The present study would contribute to judge if we try to commercialize the HMT rice flour as a basic research.
Materials and methods
Materials
The high-amylose rice cultivar Koshinokaori was given by Bourbon Co. Ltd. And the normal-quality rice cultivar Koshiibuki was purchased from a local market. All of the rice samples were stored at 4 °C prior to the experiments.
Heat–moisture treatment of brown rice
Brown rice samples (500 g) with an initial moisture content of 12.0% (on wet basis) were put in stainless sieve basket in stainless vessels with grass lid. The device made use of a vacuum steam heating apparatus (SP-20-S28, As on Inc, Manufactured by Stainless Labotech Inc., tank volume was 28 L) with through flow boiler (SZ60, Miura Co. Ltd). After reducing the pressure using vacuum pump, they were then applied pressure with steam at 0.1 MPa (added water vapor pressure) 120 °C, 0.2 MPa, 134 °C, 0.3 MPa, and 144 °C for 5 min or 10 min. The apparatus were reduced to atmospheric pressure rapidly, and brown rice in the sieve baskets was then cooled to room temperature with air flow. After treating brown rice grains for 5 min or 10 min, steam was immediately evacuated to the normal pressure (0.1 MPa). Thus, brown rice samples were treated, in an oven set, at 0.1 MPa/120 °C, 0.2 MPa/134 °C, and 0.3 MPa/144 °C for 5 min or 10 min. In the present paper, values of pressure indicate added pressure onto normal pressure (0.1 MPa). The vessels were then cooled to room temperature, and opened, following which the HMT brown rice samples were dried in an oven to a moisture content of approximately 12.0%. HMT of each samples were carried out by National institute of technology, Nagaoka College.
Preparation of brown rice flour
Brown rice flour was prepared from each sample using a cyclone mill (SFC-S1; Udy, Corp., Fort Collins, Co, USA) with a screen containing 1-mm-diameter pores.
Moisture content
The moisture content was measured using an oven-drying method. Samples of 2 g were dried for 1 h at 135 °C.
α-Amylase activity
Theα-amylase activity of samples were determined with an enzyme kit (Megazyme Ltd, Wicklow, Ireland). Brown rice flour (0.5 g) was extracted with 1 mL of extraction buffer, (pH 5.4) at 40 °C for 20 min and then centrifuged for 10 min at 1000×g. The extraction solution (0.1 mL) and substrate (0.1 mL) were pre-incubated at 40 °C for 5 min, and then incubated at 40 °C for exactly 20 min, following which a stopping reagent (1.5 mL) was added. The absorbance was measured at 400 nm.
Lipase activity
The lipase activity of each sample was determined with an enzyme kit (Cayman Chemical Co, USA). Brown rice flour (0.1 g) was extracted with 0.3 mL of 80% ethanol for 1 h at room temperature and then centrifuged for 15 min at 3000×g. The extraction buffer (170 μL), fluorescent buffer (10 μL), extraction solution (10 μL), and substrate (10 μL) were then added in order to a 96-well tissue culture plate (AS One Corporation), and pre-incubated at 37 °C for 15 min. The absorbance was measured at 380 nm (excitation) and 510 nm (emission) using a fluorescent microplate reader (Grating Based Multimode Reader SH-9000: Corona Electric Co, Ltd.).
Starch damage ratio
The starch damage ratio of each sample was determined using a starch damage kit (Megazyme, Ltd, Wicklow, Ireland). Each sample (corresponding to 0.1 g of dry matter) was placed in a tube and 1.0 mL of a pre-equilibrated fungalα-amylase solution (50 U/mL) was added. The solution was then incubated at 40 °C for exactly 10 min. Following incubation, 8.0 mL of dilute sulfuric acid (0.2%, v/v) was added to solution. After 10 min of digestion, the acidified solution was centrifuged at 1000×g for 5 min. The clear supernatant (0.1 mL) was mixed with 0.1 mL of amyloglucosidase (20U/mL), stirred on a vortex mixer and incubated at 40 °C for 10 min. A glucose oxidase/peroxidase (GOPOD) reagent (4 mL) was then added to the solution and the mixture was incubated at 40 °C for 20 min. The absorbance of the solution was measured at 510 nm with a UV–1600 spectrophotometer (Shimadzu, Kyoto, Japan), and the glucose content was calculated and converted to the starch damage ratio according to the manufacturer’s manual.
Color difference
The difference in color between the samples was measured using a color-difference meter (Color Meter NW-11; NIPPON DENSHOKU INDUSTRIES CO., LTD, Tokyo, Japan).
Dietary fiber
Measurement of the dietary fiber content of each sample was carried out by the Food Analysis Technology Center using a total dietary fiber assay kit (Megazyme, Ltd, Wicklow, Ireland).
Glucose content
The glucose content was measured by adding 1 mL of 60% ethanol to each brown rice flour sample (0.1 g) and subjecting the mixture to glucose extraction by rotating the tube at 20 °C for 1 h. The solution was then centrifuged 1500×g for 15 min, and the supernatant was collected as the sample solution. The glucose content of the sample solution was measured using the NADPH enzyme assay method with a glucose assay kit (Roche, Darmstadt, Germany).
Resistant starch
The RS contents of the samples were measured according to the AOAC method using an RS assay kit (Megazyme, Ltd, Wicklow, Ireland). Each sample (100 mg) was digested with pancreatin and amyloglucosidase at 37 °C for 6 h, and the glucose content was then measured with a spectrophotometer at 510 nm.
Hydrophilic and lipophilic oxygen radical absorbance capacities
The hydrophilic and lipophilic oxygen radical absorbance capacities (H-ORAC and L-ORAC, respectively) of samples were measured as described by Prior et al.Citation32) Ito et al.Citation33), and Watanabe et al.Citation34,35) For the hydrophilic antioxidant assay, each sample (0.1 g) was extracted with 10 mL of hexane at room temperature for 2 min, and then centrifuged for 15 min at 3000×g. The hexane layer was then removed, and the process was repeated. Residual hexane was evaporated using a water bath at 70 °C for 10 min and the residue was extracted with 10 mL of acetone/water/acetic acid (70:29.5:0.5, v/v/v), following which the solution was sonicated (Ultrasonic Cleaner 3510J-MTH; Branson Ultrasonics Co, Ltd.) at 37 °C for 15 min. The tube was then kept at room temperature for 15 min, following which it was centrifuged for 15 min at 3000×g. The supernatant was removed and transferred to a volumetric flask and diluted to 25 mL total volume.
For the lipophilic antioxidant assay, each sample (0.1 g) was extracted with 1 mL of hexane at room temperature for 2 min and then centrifuged for 15 min at 3000×g. The hexane layer was then collected and the process was repeated. The hexane was evaporated using a water bath at 70 °C for 10 min, and the dried hexane extract was then dissolved in 250 μL of acetone and diluted with 750 μL of 7% randomly methylated β-cyclodextrin (RMCD; prepared by dissolving 0.7 g of methyl-β-cyclodextrin (Sigma Chemical Co.) in 10 mL of 50% acetone. Trolox calibration solutions (50, 25, 12.5, and 6.25 μmol/L in assay buffer solution) were prepared to obtain a standard curve. The trolox calibration solutions, blank (dilute buffer), diluted test samples (35 μL), fluorescein solution (115 μL, 110.7 nmol/L), and 2,2’-azobis (2-amidinopropane) dihydrochloride (AAPH) solution (50 μL, 31.7 mmol/L: H-ORAC, 63.4 mmol/L: L-ORAC) were added in order to a fluorometer 96-well plate (AS One Corporation), and absorbance values were immediately measured at 37 °C for 90 min at 485 nm (excitation) and 530 nm (emission) using a fluorescent microplate reader (Grating Based Multimode Reader SH-9000: Corona Electric Co, Ltd.).
Iodine absorption spectrum
The iodine absorption spectrum of each sample was measured using a Shimadzu UV–1800 spectrophotometer. The apparent amylose content (AAC) of milled rice was estimated using the iodine colorimetric method, as described by Juliano et al.Citation36) The iodine absorption spectrumCitation37) was analyzed from 200 to 900 nm using a square cell with inner dimension of 1 cm × 1 cm. Distilled water was added to the same cell as a control. The absorbance was measured at λmax, i.e. the peak wavelength, in the visible light range of iodine staining of starch, which is highly correlated with the length of the glucan chain, the molecular size of amylose, and the super-long chain (SLC) of amylopectin.
Pasting properties
The pasting properties of each sample were measured using a RVA (model Super 4; Newport Scientific Pty Ltd, Warriewood, Australia). Each sample (4.0 g based on 14% moisture content) was combined with 25 mL of water. The sample cup was then fitted to the rotor of the RVA and heated at 50 °C for 1 min and then to 93 °C over 4 min. The sample temperature was held at 93 °C for 7 min, and then cooled to 50 °C over 4 min, where it was allowed to stand for 3 min. The programmed heating and cooling cycle followed that of Toyoshima et al.Citation38) Novel indices such as the Set/Cons ratio and Max/Fin ratio are very strongly correlated with the proportion of intermediate and long chains of amylopectin: Fb1+2+3 (DP 13).Citation39)
Physical properties of gelatinous brown rice flour
Gelatinized samples were prepared using an RVA, and then immediately cooled in ice water for 1 h. The physical properties of retrogradation of the gelatinized samples (10 g) were measured based on bulk measurement using a Tensipresser (My Boy System, Taketomo Electric Co., Tokyo, Japan) according to the method described by Okadome et al.Citation40,41) The bulk measurements were repeated six times, and the mean value was calculated.
Fatty acid composition
Measurement of the fatty acid composition of each sample was carried out by the Food Analysis Technology Center (using a gas chromatography method).
Fat acidity
The fat acidity of each sample was measured using a colorimetric method, as described by Ohtsubo et al.Citation24) Each sample (1.0 g) was extracted with 3.0 mL of toluene at 30 °C for 1 h and then filtrated through filter paper (110 mm, ADVANTEC CO Ltd., Tokyo, Japan). Chloroform (4.0 mL), and copper reagent (2.5 mL) were then added to the filtrate solution (1.0 mL), following which the mixture was shaken well and centrifuged for 5 min at 3000×g. The supernatant (Cu-fatty acid compound) was then removed, and the remaining solution was used as the sample solution. The clear sample solution (3.0 mL) was mixed with 0.5 mL of coloring substance (0.1% sodium diethyldithiocarbamate with isobutyl alcohol), stirred on a vortex mixer and incubated at room temperature for 15 min. The absorbance of the solution was then measured at 440 nm with a UV–1600 spectrophotometer (Shimadzu, Kyoto, Japan). Linoleic acid solution (0, 0.3, 0.7, and 1.1) with toluene was used to produce a calibration curve.
Thermal measurement by differential scanning calorimetry (DSC)
The gelatinization properties of each sample were analyzed using a differential scanning calorimeter (DSC8000; Perkin Elmer Japan, Yokohama, Japan). Each sample (15 mg) was placed in a stainless steel pan (Perkin Elmer Japan, Yokohama, Japan) and combined with 40 μL of deionized water, following which the pan was sealed hermetically and equilibrated overnight. The pan was then placed in the DSC instrument and scanned from 30 to 130 °C at a heating rate of 5 °C/min to measure gelatinization start, peak, and end temperatures (Ts, Tp, and Tc, range of application : 60–90 °C and 90–115 °C, respectively), and endothermic enthalpy (ΔH).
Storage test at 35 °C for 2 months
To evaluate the characteristics of the various rice flour with storage, the HMT and untreated brown rice flour were stored at 35 °C for 2 months in a Bio Multi Incubator (MODEL LH-30-8CT; Nippon Medicals and Chemical Instruments Co., LTD, Osaka, Japan).
Statistical analyses
All results, including the significance of regression coefficients, were statistically analyzed using Student’s t-test, one-way analysis of variance, and Tukey’s test with Excel Statistics (ver. 2006; Microsoft Corp., Tokyo, Japan).
Results and discussion
Moisture content
The quality of preserved rice flour is greatly affected by its moisture content. As shown in Table , the moisture contents of the HMT samples (KSK: 12.3–12.8%, mean = 12.5%, KSI: 11.8–12.4%, mean = 12.2%) were almost identical to those of the untreated samples (KSK: 12.6%; KSI: 12.0%). It means that HMT does not change the moisture contents of the rice flour samples by the processing.
Table 1. Component analysis, enzyme activities, and anti-oxidative activity of HMT and untreated brown rice flour.
α-Amylase activity
Unlike α-glucosidase, which is mainly localized in the inner layers of rice grains, α-amylase is predominantly localized mainly in the outer endosperm.Citation42) and so it would be affected by HMT more severely. As shown in Table , theα-amylase activity was 1.4-fold higher in KSK than in KSI, and was significantly lower in the HMT samples (KSK: 0.000–0.038 CU/g, mean = 0.012 CU/g; KSI: 0.000–0.015 CU/g, mean = 0.007 CU/g) than in the untreated samples (KSK: 0.048 CU/g; KSI: 0.035 CU/g) (p < 0.05), being completely inactivated with the 0.2 MPa/10 min and 0.3 MPa/10 min treatments, and decreased 0.8-fold for KSK and 0.3-fold for KSI with the 0.1 MPa/5 min treatment.α-Amylase activity was significantly negative correlation with the starch damage ratio (r = –0.68) and color difference (r = –0.68) (p < 0.05; data not shown).
Lipase activity
The presence of lipase, galactolipase, and phospholipase has previously been confirmed, in rice grains, with an activity ratio of 100:64:9, respectively.Citation43) The free fatty acid content of grains is often employed as a measure of deterioration during storage with Katsuhara et al.Citation44) reporting that the amounts of free fatty acids increases during storage, as a result of lipase hydrolysis. In the present study, lipase activity was 1.1-fold higher in KSI than in KSK, and was lower in the HMT samples (KSK: 4.4–5.0 nmol/min/mL, mean = 4.8 nmol/min/mL; KSI: 4.6–6.1 nmol/min/mL, mean = 5.4 nmol/min/mL) than in the untreated samples (KSK: 5.3 nmol/min/mL; KSI: 6.0 nmol/min/mL), with a significantly difference being observed for both KSK and KSI with 0.3 MPa/10 min HMT (p < 0.05; Table ). It seems that the strong HMT tends to damage the lipase activity, which would be profitable to prevent the deterioration of rice flour quality during the storage.
Starch damage ratio
Flour has a granular size of 25–85 μm when milled with an SM-250 mill and 90–110 μm when milled with an UDY mill,Citation45) and the milling of cereals causes partial physical damage to the starch granules they contain. In the present study, the starch damage ratio was 1.4-fold higher in KSI than in KSK, and was significantly higher in the HMT samples (KSK: 7.3–14.4%, mean = 9.5%; KSI: 9.8–17.8%, mean = 13.5%) than in the untreated samples (KSK: 7.0%; KSI: 9.8%) (p < 0.05). Furthermore, the starch damage ratio of the HMT samples gradually increased with increase in strength of the treatment, with samples treated with 0.3 MPa/10 min showing the highest values (Table ). The starch damage ratio of was positively correlated with the color difference (r = 0.90; data not shown). It would be necessary for us to select the suitable utilization even though the starch was damaged slightly.
Color difference
The color of the samples became more yellowish with HMT. Previous studies have indicated that the browning reaction is caused by the amino-carbonyl-reaction.Citation15,46) The color difference [ΔE * (ab))] was increased 1.1-fold higher in KSI than in KSK, and was higher in the HMT samples (KSK: 23.8–26.9, mean = 25.4; KSI: 28.2–31.4, mean = 29.8) than in the untreated samples (KSK: 23.8; KSI: 27.1). Furthermore, the color difference [ΔE*(ab))] of the HMT samples also increased with increase in strength of the treatment (Table ). The discoloration seems to be caused by Maillard reaction. From this result, we should select the suitable processing condition, such as 0.1 MPa/5 min, to less the discoloration in the case of color of the final products is important.
Dietary fiber
Brown rice is more nutritious than white rice, particularly with respect to dietary fiber, vitamin, and mineral.Citation47) Short-chain fatty acids, which are the end products of the fermentation of dietary fibers by the anaerobic intestinal microbiota, have been shown to exert multiple beneficial effects on mammalian energy metabolism.Citation48) The dietary fiber content was 1.1-fold higher in KSI than in KSK, and was similar or slightly higher in the HMT samples (KSK: 2.9–3.2; mean = 3.1, KSI: 2.9–3.5; mean = 3.2) than in the untreated samples (KSK: 3.2; KSI: 2.8), being significantly higher in KSI samples treated with 0.1 MPa/5 min, 0.1 MPa/10 min, 0.2 MPa/10 min, and 0.3 MPa10 min (p < 0.05; Table ). High dietary fiber products would be promising to prevent obesity or diabetes or improve the microsphere of the intestine.
Glucose content
α-Amylase activity and α-glucosidase decompose starch and generate glucose during the early stage of cooking. The glucose content was almost identical between all of the HMT samples and the untreated samples except KSI treated with 0.3 MPa/10 min HMT, which had significantly lower glucose content than the untreated sample (p < 0.05) due to the almost complete inactivation of α-amylase activity by HMT (Table ). It seems to be promising for HMT brown rice flour that glucose content did not increase by processing.
Resistant starch
Yang et al.Citation1) have reported that mutant rice is rich in RS, and Nakamura et al.Citation49) showed that ae mutant rice grains contain markedly higher amounts of RS than other rice grains. RS is expected to promote body fat consumption, and has been shown to reduce the GI and improve glucose tolerance in rats, indicating that its use over the long term could help to prevent and improve type 2 diabetes.Citation50) Furthermore, RS improves mineral availability through increased absorption in the large intestine.Citation51) It has previously been shown that HMT may be able to increase the RS content of wheat (Triticum aestivum), although the treatment of wheat starch was not as effective as that of corn starch.Citation8) In the present study, we examined the gelatinization properties of samples using DSC. ΔH (first heating peak: 60–90 °C) was slightly lower in the HMT KSK samples (6.8–10.3, mean = 9.3) than the untreated sample (10.3), with the 0.1 MPa/5 min, 0.1 MPa/10 min, 0.2 MPa/5 min, 0.2 MPa/10 min, and 0.3 MPa/10 min treatments being 0.98-, 0.96-, 0.93-, 0.91-, and 0.65-fold lower, respectively (Supplementary Table 1). Similarly, ΔH (first heating peak) was also slightly lower in the HMT KSI samples (8.1–11.0, mean = 9.9) than in the untreated (14.2) (data not shown). Thus, we consider that the gelatinization properties of the HMT samples gradually increased with increase in strength of HMT (Table ). ΔH (second heating peak: 90–115 °C) was also generally slightly lower in the HMT samples (0.0–1.2, mean = 0.6) than in the untreated sample (0.7), however, samples treated with 0.1 MPa/5 min and 0.1 MPa /10 min HMT showed higher values than the untreated sample, while no data were obtained for HMT KSI (data not shown). Therefore, we believe that ΔH (second heating peak) represented the melting transition or complex formation between amylose and native lipids, as both ΔH (first heating peak) and ΔH (second heating peak) showed a significant positive correlation with the RS content (r = 0.89 and 0.82, respectively; data not shown). Similarly, Hoover and VasanthanCitation28) showed that heat treatment induced complex formation between amylose and native lipids, with DSC indicating that the heat-treated samples exhibited a broadening of the gelatinization temperature range and a shifting of the endothermal transition toward higher temperatures.
The RS content was 7.4-fold higher in KSK than in KSI, and was similar or markedly lower in the HMT samples (KSK: 9.5–11.9, mean = 11.0; KSI: 0.3–0.7, mean = 0.5) than in the untreated samples (KSK: 11.1; KSI: 1.5). In particularly, the KSK sample treated with 0.1 MPa/10 min had a significantly higher RS content, while those treated with 0.2 MPa/10 min and 0.3 MPa/10 min had significantly lower RS contents than the untreated sample (p < 0.05; Table.). HooverCitation52) showed that HMT alters the extent of starch-chain associations within the amorphous regions and the degree of crystalline order. Consequently, we believe that the RS contents of HMT samples were derived from the amylose-lipid complexes.
Oxygen radical absorbance capacity (ORAC)
L-ORAC was 1.3-fold higher in KSK than in KSI, and was lower in the HMT samples (KSK: 46.3–84.0, mean = 65.2; KSI: 27.7–56.4, mean = 38.8) than in the untreated samples (KSK: 87.1; KSI: 66.3). Furthermore, L-ORAC gradually decreased with increase in strength of HMT, with the 0.2 MPa/10 min and 0.3 MPa/10 min treatments showed very low values (Table ). Similarly, H-ORAC was 1.1-fold higher in KSK than in KSI, and was significantly lower in the HMT KSK samples (KSK: 37.2–51.8, mean = 47.5) than in the untreated sample (58.1) (p < 0.05; Table ). By contrast, H-ORAC of the HMT KSI samples (KSI: 44.1–53.3, mean = 49.3) was more similar to that of the untreated sample, with only the 0.2 MPa/5 min and 0.3 MPa/10 min treatments resulting in significantly lower values (p < 0.05). It was shown that strong conditions of HMT decrease oxygen radical absorbance capacity of the brown rice flour.
Iodine absorption spectrum
AAC is considered a useful parameter for estimating the cooking or eating quality of rice grains, and can be measured using the iodine colorimetric method at 620 nm, which was developed by Juliano et al.Citation53) AAC comprises a large amount of amylose and a small amount of SLC of amylopectin. In general, low amylose rice becomes soft and sticky after cooking, whereas high amylose rice becomes hard and separated.Citation54) AAC was 2.2-fold higher in KSK than in KSI, and was higher in the HMT KSK samples (28.3–29.6%, mean = 29.0%) than in the untreated sample (28.1%) with significant differences being observed for the 0.2 MPa/5 min, 0.2 MPa/10 min, and 0.3 MPa/10 min treatments [p < 0.05; Table (A) ]. By contrast, AAC was significantly lower in the HMT KSI samples (10.8–12.0%, mean = 11.3%) than in the untreated sample (12.7%) (p < 0.05). We believe that these finding resulted from HMT causing the large amount of amylose and small amount of SLC of amylopectin in KSK to swell, but only having a small effect on KSI due to the small amount of amylose and lack of SLC of amylopectin it contains. Hoover and VasanthanCitation52) similarly showed that the extent of changes as a result of HMT is influenced by the starch composition, moisture content and temperature during treatment, and by organization of amylose and amylopectin chains within native starch granules. AAC was positively correlated with Cons (r = 0.95), Setback (r = 0.94), Toughness (r = 0.96), and fat acidity (r = 0.97), but negatively correlated with the Max/Final ratio (r = –0.94) and Ad/Tou ratio (r = –0.95) (p < 0.01; data not shown).
Table 2. Analysis of iodine absorption curve and amylose content of HMT and untreated brown rice flour.
The molecular structures of many starches have been reported previously, including the molecular sizes of amylose and the amylopectin branch chain lengths.Citation55–58) High molecular-weight amyloses tend to have a longer wavelengths for λmax, and it has previously been shown that the glutinous rice cultivars have very low λmax values, while indica rice, japonica-indica hybrid rice cultivars have higher λmax values, with normal japonica rice cultivar having intermediate values.Citation37) In the present study, we found that the λmax values were slightly higher for KSK than or KSI [Table (A)]. Furthermore, λmax was almost identical in the HMT KSK samples (KSK: 574.0–579.0 nm, mean = 576.4 nm) and the untreated sample (576.5 nm), but were slightly lower in the HMT KSI samples (557.0–561.5 nm, mean = 559.0 nm) than in the untreated sample (562.5 nm), with significant differences being observed with the 0.1 MPa/10 min, 0.2 MPa/5 min, 0.2 MPa/10 min, and 0.3 MPa/10 min treatments (p < 0.05).
Here, we found that Aλmax was 1.4-fold higher in KSK than in KSI, and was almost identical in the HMT samples (KSK: 0.42–0.44, mean = 0.40; KSI: 0.29–0.31, mean = 0.30) as in the untreated samples (untreated KSK: 0.42; untreated KSI: 0.31) [Table (A)]. It means that HMT does not decompose starch molecule.
Nakamura et al.Citation59) showed that AAC was negatively correlated with the λmax/Aλmax ratio. The λmax/Aλmax ratio was 1.3-fold higher in KSI than in KSK [Table (A)]. However, although this ratio was almost identical for the HMT KSK samples (1321.2–1361.9, mean = 1341.3) and the untreated sample (1384.3), it was slightly higher in the HMT KSI samples (1844.1–1907.8, mean = 1872.4) than in the untreated sample (1800.0) with significant differences being observed with the 0.1 MPa/10 min, and 0.3 MPa/10 min treatments (p < 0.05).
Physical properties
The physical properties of gelatinous samples were measured based on bulk measurement using a Tensipresser. Differences were detected in the values of hardness, toughness, adhesion, stickiness, the adh/Tou ratio, and the Sti/Tou ratio (overall balance), which are important indices when evaluating the palatability of riceCitation60) with toughness showing a similar tendency to hardness (Table ).
Table 3. Physical properties of gelatinous HMT and untreated brown rice flour.
HMT KSK samples had slightly lower values for hardness (0.12–0.22, mean = 0.17), stickiness (79.48–94.57, mean = 87.4), the Ad/Tou ratio (4.83–6.88, mean = 5.90), and the Sti/Tou ratio (7.88––11.48, mean = 9.89), and higher values for toughness (7.64–10.10, mean = 9.02) and adhesion (48.59–54.28, mean = 52.2) than the untreated sample. By contrast, HMT KSI samples had almost identical values for hardness, toughness, stickiness, and the Sti/Tou ratio as the untreated samples, but higher values for adhesion (63.90–86.33, mean = 71.4) and the Ad/Tou ratio (15.82–21.97, mean = 17.40). These finding indicate that the gel texture of the KSK samples became harder and less sticky following HMT, while that of the KSI samples became more adherent and elastic.
Pasting properties
As affecting the eating quality of rice, it is useful to test the gelatinization properties as quality indicators. Breakdown (Break.d) indicates the degree of ease with which the starch granules are disintegrated. It has been shown that high-amylose rice cultivars have higher final viscosities (Final.vis) than low-amylose cultivars, and that Final.vis is related to the degree of starch retrogradation during cooling.Citation61)
In a previous study,Citation62) we developed a novel index for the ratios of Max/Mini and Max/Fin, which have stronger negative correlations with RS content than the conventional indexes obtained using RVA. KiribuchiCitation63) and KawashimaCitation64) reported that the amylogram patterns for non-defatted and defatted rice show that the viscosity of rice is affected by the presence of lipids.
HMT KSK samples had slightly lower values for Max.vis (282.9–388.5, mean = 354.5), Mini.vis (129.6–167.5, mean = 155.5), Break.d (153.3–221.0, mean = 199.0), Final.vis (319.4–402.5, mean = 377.2), Cons (189.8–235.4, mean = 221.7), Max/Mini ratio (2.18–2.34, mean = 2.27), and Max/Final ratio (0.89––0.96, mean = 0.94), but slightly higher values for Setback (14.7–36.5, mean = 22.7), Past.t (75.1–76.1, mean = 75.7), and Set/Cons ratio (0.06–0.19, mean = 0.11) than the untreated sample [Table (A)]. By contrast, the HMT KSI samples had slightly higher values for Max.vis (330.2–449.9, mean = 417.3), Mini.vis (139.1–150.3, mean = 144.2), Break.d, (187.0–300.5, mean = 273.2), Final.vis, (256.0–280.3; mean = 268.5), Cons (116.9–135.0; mean = 124.3) and Max/Final ratio (1.19–1.67, mean = 1.56), and slightly lower values for Setback (−179.8 to −52.0, mean = −148.8), Past.t (62.2–68.4, mean = 66.9) and the Set/Cons ratio (−1.49 to −0.39; mean = −1.22) than the untreated sample.
Table 4. Pasting properties of HMT and untreated brown rice flours.
These results indicate that HMT KSK and HMT KSI samples had opposite pasting properties from each other, and that samples that were treated with 0.2 MPa/5 min, 0.2 MPa/10 min and 0.3 MPa/10 min HMT significantly differed from the untreated samples. HMT affected to the opposite direction depending on the rice cultivars.
Fatty acid composition
Linoleic, oleic and palmitic acids are the major fatty acids contained in the lipids of brown rice.Citation65) The essential fatty acid contents of rice may increase with temperature during grain development, but this is at the expense of the total oil content, which is concurrently reduced.Citation66) Sato et al.Citation67) showed that glutinous rice appears to have quite similar fatty acid composition to nonglutinous rice with the exception of a slightly higher proportion of palmitic acid. Furthermore, Ikemoto and NaganumaCitation68) reported that the ratio of saturated/monounsaturated/polyunsaturated fatty acids was relatively constant between rice varieties, although the n − 6/n − 3 ratio of polyunsaturated fatty acids showed higher diversity in japonica rice varieties. BarberCitation69) showed that saturated free fatty acids are shorter than unsaturated free fatty acids and can efficiently re-form amylose/free fatty acid complexes, whereas the unsaturated fatty acid linoleic acid does not form a complex in corn (Zea mays) based on the DSC reheating curve. Mano et al.Citation70) showed that the C14-20/C21-26 ratio of the hydroxyl fatty acids in cerebroside was 1.18 in japonica and 0.62 in indica.
The myristic acid, palmitic acid, palmitoleic acid, stearic acid, oleic acid, linoleic acid, arachidic acid, behenic acid and lignoceric acid contents, and the oleic acid /(linoleic acid + α-linolenic acid) and linoleic acid/α-linolenic acid ratios significantly differed between the KSK and KSI cultivars (p < 0.05; data not shown).
The palmitic acid was slightly higher in the HMT KSK samples (23.50–23.70, mean = 23.60) than in the untreated sample (23.50), with significant differences being observed with the 0.1 MPa/5 min, 0.1 MPa/10 min and 0.3 MPa/10 min treatments (Supplementary Table 2). However, overall, there was little difference in the composition of lipid classes between HMT and untreated samples.
It seems that fatty acid composition varies depending on rice cultivars, but fatty acid composition changes little except saturated fatty acid, such as palmitic acid, by HMT.
Correlation between fat acidity, fatty acid composition, pasting properties, physical properties and the iodine absorption curve
The pasting properties Final.vis, Setback, Past.t, Cons, and Set/Cons ratio were positively correlated with the fat acidity, palmitic acid content, oleic acid content, and oleic acid/(linoleic acid + α-linolenic acid) ratio, but negatively correlated with the linoleic acid content and (linoleic acid/α-linolenic acid) ratio (p < 0.01; Table ). By contrast, Break.d, and the Max/Mini and Max/Final ratios were negatively correlated with the fat acidity, palmitic acid content, oleic acid content, and oleic acid/(linoleic acid + α-linolenic acid) ratio, but positively correlated with the linoleic acid content and (linoleic acid/α-linolenic acid) ratio (p < 0.01).
Table 5. Correlation between fat acidity, fatty acid composition, pasting properties, physical properties and iodine absorption curve of HMT and untreated brown rice flour.
The physical properties hardness, toughness, and stickiness were positively correlated with the fat acidity, palmitic acid content, oleic acid content, and oleic acid/(linoleic acid + α-linolenic acid) ratio, but negatively correlated with the linoleic acid content and linoleic acid/α-linolenic acid) ratio (p < 0.01; Table ). By contrast, adhesion was negatively correlated with the fat acidity, palmitic acid content, oleic acid content, and oleic acid/(linoleic acid + α-linolenic acid) ratio, but positively correlated with the linoleic acid content and (linoleic acid/α-linolenic acid) ratio (p < 0.01).
The λmax, Aλmax, and AAC of the iodine absorption curve were positively correlated with the fat acidity, palmitic acid content, oleic acid content, and oleic acid/(linoleic acid + α-linolenic acid) ratio, but negatively correlated with the linoleic acid content and (linoleic acid/α-linolenic acid) ratio (p < 0.01; Table ). By contrast, the λmax/Aλmax was negatively correlated with the fat acidity, palmitic acid content, oleic acid content, and oleic acid/(linoleic acid + α-linolenic acid) ratio, but positively correlated with the linoleic acid content and (linoleic acid/α-linolenic acid) ratio (p < 0.01).
Thus, the pasting properties (Final.vis, Setback, Past.t, and Cons,), physical properties (hardness, toughness, and stickiness) and iodine absorption curve parameters (λmax, Aλmax, and AAC) were significant positively correlated with the fat acidity, palmitic acid content, and oleic acid content, but correlated negatively with the linoleic acid content, andα-linolenic acid showed a similar trend to linoleic acid.
Effect of 2 months’ storage at 35 °C of fat acidity
Takano et al. showed that at the initial of stage, phospholipase D reacted with the phospholipid membrane of spherosome to damage its structure, which then allowed triacylglycerol to get out through the spherosome membrane. After that lipase decomposed triacylglycerol to free fatty acids.Citation71) Furthermore, Takano et al.Citation72) reported that phospholipids, triacylglycerol, and glycolipids decreased during 2 months’ storage at 37 °C, while lipolytic enzyme activities were retained 30–60%; and Yasumatsu and MoritakaCitation73) showed that rice stored at room temperature had a higher oleic acid content and a lower linoleic acid content in the free fatty acid fraction than rice stored at 9 °C. Furthermore, Hikida et al.Citation23) showed that the fat acidity of rice grains increased as storage progressed, but that rate of increase was suppressed in heated samples, due to the inactivation of lipid decomposing enzymes.
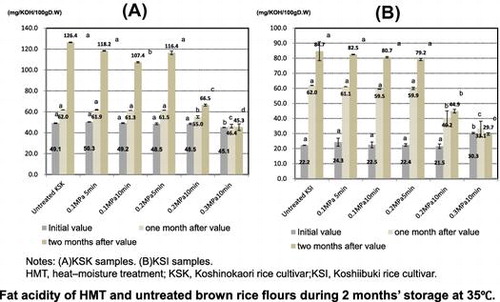
In the initial stage of storage, the fat acidity was slightly lower in the HMT KSK samples (45.1–50.3, mean = 48.3 mgKOH−1 100 g−1D.W.) than in the untreated sample (49.1 mgKOH−1 100 g−1D.W.), with a significant difference being observed with the 0.3 MPa/10 min treatment [(p < 0.05; Fig. (A)]. Moreover, the fat acidity of the HMT KSK samples was significant positively correlated with ΔH (first heating peak; r = 0.96) and ΔH (second heating peak; r = 0.94) (p < 0.01).
Fig. 1. Fat acidity of HMT and untreated brown rice flour during 2 months’ storage at 35 °C.
By contrast, the fat acidity was slightly higher in the HMT KSI samples (21.5–30.3, mean = 24.2 mg KOH−1 100 g−1 D.W.) than in the untreated sample (22.2 mg KOH−1 100 g−1
D.W.), with a significant difference being observed with the 0.3 MPa/10 min treatment [(p < 0.05; Fig. (B)]. We think that non-enzymatic decompose, namely phospholipid membrane of spherosome was damaged by treatment conditions including high pressure and long time. The freshness determine check result, the KSI sample treated with 0.3 MPa/10 min HMT showed a yellow color with the MB method: (pH indicator; methyl red and bromothymol blue; data not shown).
After 1 month of storage at 35 °C, the fat acidity was lower in the HMT samples (KSK: 46.4–61.9, mean = 57.2 mg KOH−1 100 g−1 D.W.; KSI: 33.1–61.1, mean = 50.8 mg KOH−1 100 g−1 D.W.) than in the untreated samples (KSK: 62.0 mg KOH−1 100 g−1 D.W.; KSI: 62.0 mgKOH−1 100 g−1 D.W.), with significant differences being observed with the 0.2 MPa/10 min, and 0.3 MPa/10 min treatments (p < 0.05; Fig. ). Moreover, fat acidity was positively correlated with lipase acidity in the HMT samples (KSK: r = 0.91, p < 0.05; KSI: r = 0.95, p < 0.01; data not shown).
After 2 months’ storage at 35 °C, the fat acidity was lower in the HMT samples (KSK: 45.3–118.2, mean = 90.8 mg KOH−1 100 g−1 D.W., KSI: 29.7–82.5, mean = 63.4 mgKOH−1 100 g−1 D.W.) than in the untreated samples (KSK: 126.4 mg KOH−1 100 g−1 D.W., KSI: 84.7 mgKOH−1 100 g−1 D.W.), with significant differences being observed with the 0.2 MPa/10 min, and 0.3 MPa/10 min treatments (p < 0.05; Fig. ). Moreover, fat acidity was positively correlated with lipase acidity in the HMT samples (KSK: r = 0.95, p < 0.01; KSI: r = 0.95, p < 0.01 data not shown).
Thus, the fat acidity of samples treated with 0.1 MPa/5 min, 0.1 MPa/10 min, and 0.2 MPa/5 min HMT was almost identical to that of the untreated samples during 2 months’ storage at 35 °C. However, samples that were treated with 0.2 MPa/10 min HMT decreased 0.89-fold, for KSK and 0.65-fold, for KSI, while those that were treated with 0.3 MPa/10 min HMT decreased by 0.75-fold for KSK and 0.53-fold for KSI compared with the untreated samples after 1 month of storage; and samples that were treated with 0.2 MPa/10 min HMT decreased 0.53-fold for both cultivars, while those that were treated with 0.3 MPa/10 min HMT decreased 0.36-fold for KSK and 0.35-fold for KSI compared with the untreated samples after 2 months’ storage. There was no increase in the fat acidity of the samples treated with 0.3 MPa/10 min HMT during 2 months’ storage at 35 °C, because the lipase activity decreased 0.83-fold for KSK, and 0.76-fold for KSI compared with the untreated samples.
As a result, strong HMT would be useful for the prevention of quality deteriorations of brown rice flour during the storage by inhibiting the increase of free fatty acids.
Effect of 2 months’ storage at 35 °C of iodine absorption curve
Amylose is a non-branched α-1,4-glucan, that is component of rice starch, and greatly affects the quality and gelatinization properties of cooked rice, with the starch of low-amylose rice not being easily retrograded.Citation74) The high-amylose starch group includes two types of rice starches with similar AAC contents but different SLC contents of amylopectin. Hoover and VasanthanCitation28) previously demonstrated that the extent of starch-chain associations within the amorphous regions and the degree of crystalline order altered during HMT.
We measured the iodine absorption curve values after 2 months’ storage at 35 °C, and found that HMT samples of both cultivars had almost identical λmax values [Table (B)]. However, KSK exhibited a slightly lower Aλmax values, a 1.1-fold higher λmax/Aλmax ratio, and a 0.7-fold lower AAC value than was observed initially, while KSI exhibited almost no change in any of these values. Furthermore, AAC was positively correlated with fat acidity at the end of the 2 months storage period (p < 0.01; data not shown). Whistler and JohnsonCitation75) and Foster and PaschallCitation76) showed that alongside the retrogradation of amylose, the iodine reaction was also decreased.
As shown in Fig. (A), the fat acidity of retrograded brown rice flour was estimated with multiple regression analysis using fat acidity as the response variable and each of the parameters from the iodine absorption curve as predictor variables based on 12 samples (KSK or KSI that was untreated, or treated with 0.1 MPa/5 min, 0.1 MPa/10 min, 0.2 MPa/5 min, 0.2 MPa/10 min, or 0.3 MPa/10 min). The resulting equation was:
Fig. 2. Formula for estimating the fat acidity based on the iodine absorption curve and pasting properties of retrograded brown rice flour.
and had a multiple regression coefficient of 0.90 based on the calibration. This formula for estimating fat acidity provides an easy and low-cost spectroscopic method for evaluating the quality of brown rice flour.
Effect of 2 months’ storage at 35 °C of the physical properties
The textural properties of starch gels affect the quality of the final products. HMT leads to changes in the physical properties of starch by changing from the crystal structure to the semi-amorphous structure in the starch granules. In the case of potato starch, HMT causes the “B” pattern of X-ray diffraction to be changed to “A” or “C” pattern.Citation77) Furthermore, the gel hardness increases as a result of HMT and treatment time significantly enhances this parameter.Citation78) Kulp and LorenzCitation79) reported that HMT alters the physical order of starch granules and causes a certain degree of starch degradation, under stronger treatment conditions, which is greater in wheat than in tuber starch.
We measured the physical properties of gelatinous brown rice flour after 2 months’ storage at 35 °C, and found that hardness and toughness were 0.5- and 0.7-fold lower, respectively, in KSK but 1.1-fold higher in KSI compared with the initial values [Table (B)]. By contrast, adhesion was 1.3-fold higher in KSK and 1.1-fold higher in KSI compared with the initial values, while stickiness was almost identical in KSK and 1.2-fold higher in KSI after 2 months’ storage. Consequently, we believe that the physical properties of retrograded brown rice flour depended on the source of the starch, fat acidity content, fatty acid component ratio, and proportion of unsaturated fatty acids (i.e. the number of double bounds).
Effect of 2 months’ storage at 35 °C of the pasting properties
Katsuhara et al. reported that the increase in free fatty acids that occurs during rice storage results in an increase in the maximum viscosity of cooked rice due to free fatty acids forming a helical structure with starch molecules.Citation80) Furthermore, Dhaliwal et al.Citation81) found that the peak viscosity of milled rice increases with storage time due to an increase in the free fatty acid content and a decrease in the diastatic activity. However, Shin et al.Citation82) showed that the decrease in amylase activity that occurs during storage has very little effect on the total setback of undefatted brown rice flour.
We measured the pasting properties of brown rice flour after 2 months’ storage at 35 °C, and found that the Final.vis, and Cons.vis values were significantly lower in HMT samples than in untreated samples [p < 0.05; Table (B)]. By contrast, the Max.vis and Mini.vis values were similar to the untreated sample for KSK samples treated with 0.1 MPa/5 min and 0.1 MPa/10 min HMT, but significantly higher than the untreated sample for the HMT KSI samples (p < 0.05).These findings demonstrate that retrogradation of the pasting properties after 2 months’ storage at 35 °C was inhibited by HMT.
As shown in Fig. (B), the fat acidity of retrograded brown rice flour was estimated with multiple regression analysis, using fat acidity as the response variable and each of the pasting property parameters as predictor variables using 12 samples (KSK or KSI that was untreated, or treated with 0.1 MPa/5 min, 0.1 MPa/10 min, 0.2 MPa/5 min, 0.2 MPa/10 min, or 0.3 MPa/10 min). The resulting equation was:
And had a multiple regression coefficient of 0.99 based on the calibration. This formula is the novel one which makes it possible to estimate fat acidity without dissolution of fatty acid by organic solvent and titration of free acid by KOH. This formula for estimating fat acidity provides an easy and rapid method for evaluating the quality of brown rice flour during the storage.
Conclusions
HMT resulted in new functional properties in brown rice flour. The treatment conditions, i.e. the pressure, temperature and time, affected the physicochemical characteristics of the modified starch, including the structural characteristics, which were particularly affected by 0.3 MPa/10 min HMT.
HMT led to a decrease in α-amylase activity, lipase activity, L-ORAC and H-ORAC, and an increase in the starch damage ratio, and color difference in both cultivars, as well as an increase in AAC of KSK and a decrease in AAC of KSI compared with untreated sample.
The pasting and physical properties of KSK samples treated with 0.1 MPa/10 min HMT were the same as for the untreated sample. However, the gelatinization enthalpy andα-amylase activity decreased, while the RS content, AAC and gelatinization temperature slightly increased compared with the untreated sample. Furthermore, the fat acidity exhibited a 0.8-fold decrease compared with the untreated sample, after 2 months’ storage at 35 °C. By contrast, the pasting and physical properties of the KSI samples treated with 0.1 MPa/10 min HMT were almost the same as the untreated sample, but the dietary fiber content slightly increased 1.1-fold.
The starch gel texture became harder, and less sticky in the KSK samples, but more adherent and elastic in the KSI samples by HMT. Furthermore, the pasting properties of KSK and KSI were also opposite from each other, following HMT. The pasting properties (Final.vis, Setback, Past.t, and Cons,), physical properties (hardness, toughness, and stickiness) and iodine absorption curve parameters (λmax, Aλmax, and AAC) in HMT samples were also positively correlated (significant) with fat acidity, palmitic acid, and oleic acid contents, but negatively correlated with the linoleic acid content, andα-linolenic acid.
After storage for 2 months at 35 °C, sample treated with 0.2 MPa/10 min and 0.3 MPa/10 min HMT showed lower AAC and fat acidity values, and inhibition of retrogradation of the pasting and physical properties compared with untreated samples. Although the fat acidity usually increase as storage progresses, in the present study, lipase activity decreased 0.8-fold in samples treated with 0.3 MPa/10 min HMT compared with the untreated samples, which resulted in no increase in fat acidity being observed in HMT samples during the storage for 2 months at 35 °C.
Furthermore, we propose estimation formulas for the fatty acid contents of retrograded brown rice flour based on the iodine absorption curve and pasting properties, which will enable the quality of brown rice flour to be evaluated with an easy and rapid iodine colorimetric method.
Based on our findings, we believe that the physical and pasting properties of retrograded brown rice flour changed or unchanged depended on the source of the starch, the fatty acid component ratio, and proportion of unsaturated fatty acids and the condition of HMT.
Finally, it would be necessary to continue and accelerate our research, for example, quality evaluation of the brown rice flour made by the enlarged pilot-scale manufacturing system, in the near future as a collaborative research.
Authors contribution
Ken’ichi Ohtsubo, Sumiko Nakamura, and Masayoshi Sugawara conceived and designed the experiments. Sumiko Nakamura and Wataru Noro, Hisako Okumura, and Noriyuki Honma performed the experiments. Sumiko Nakamura wrote the manuscript with assistance from Ken’ichi Ohtsubo. All authors reviewed the results and approved the final version of the manuscript.
Disclosure statement
No potential conflict of interest was reported by the authors.
Funding
This work was supported by a Grant in Aid for Scientific Research (C), Ministry of Education, Culture, Sports, Science and Technology [grant number 17K00829]; and Research Program (Development of brown rice flour with high-storability and bio-functionality by HMT, NARO Bio-oriented Technology Research Advancement Institution).
Supplemental materials
The supplemental material for this paper is available at https://doi.org/10.1080/09168451.2017.1387047.
NakamuraSupplement0927.pdf
Download PDF (88.2 KB)Acknowledgment
We express our gratitude to Mr Naoto Murohashi, Bourbon Co. Ltd. for kind gift of rice sample, high-amylose rice, Koshinokaori.
Notes
Abbreviations: 0.1 MPa/5 or 10 min, heat-moisture treatment at 0.1 MPa for 5 or 10 min; 0.2 MPa/5 or 10 min, heat-moisture treatment at 0.2 MPa for 5 or 10 min; 0.3 MPa/10 min, heat-moisture treatment at 0.3 MPa for 10 min; AAC, apparent amylose content; Ad/Tou, adhesion/toughness; Break.d, break down; Cons, consistency; HMT, heat-moisture treatment; KSI, Koshiibuki rice cultivar; KSK, Koshinokaori rice cultivar; Max/Final, maximum/final viscosity; Max/Mini, maximum/minimum viscosity; Past. t, pasting temperature; RS, resistant starch; RVA, Rapid Visco Analyzer; Set/Cons, setback/consistency; Sti/Tou, stickiness/toughness.
Related Research Data
References
- Yang CZ, Shu XL, Zhang LL, et al. Starch properties of mutant rice high in resistant starch. J Agric Food Chem. 2006;54:523–528.10.1021/jf0524123
- Goddard M, Yong G, Marcus R. The effect of amylose content on insulin and glucose responses to ingested rice. Am J Clin Nutr. 1984;39:388–392.
- Kang HJ, Hwang IK, Kim KS, et al. Comparative structure and physicochemical properties of Ilpumbyeo, a high-quality Japonica rice, and its mutant, Suweon 464. Agric Food Chem. 2003;51:6598–6603.10.1021/jf0344946
- Goda T, Kajiya K, Suruga H, et al. Availability, fermentability, and energy value of resistant maltodextrin; modeling of short-term indirect calorimetric measurements in healthy adults. Am J Clin Nutr. 2006;83:1321–1330.
- Miyazato S, Nakagawa C, Kishimoto Y, et al. Promotive effects of resistant maltodextrin on apparent absorption of calcium, magnesium, iron and zinc in rats. Eur J Nutr. 2010;49:165–171.10.1007/s00394-009-0062-6
- Nishi A, Nakamura Y, Tanaka N, et al. Biochemical and genetic analysis of the effects of amylase-extender mutation in rice endosperm. Plant Physiol. 2001;127:459–472.10.1104/pp.010127
- Kurahashi Y, Yoshino Z. Heat-moisture-treated starch; its production, properties, and uses. J Appl Glycosci. 2000;47:125–132.10.5458/jag.47.125
- Taniguchi M, Aiuchi R, Niwa J, et al. Contents and heat-moisture treatment effect of resistant starch in high amylose wheat starch. J Jpn Assoc Dietary Fiber Res. 2003;7:20–25.
- Saito K, Ito T, Kuribayashi T, et al. Effect of raw and heat-moisture treated high-amylose corn starch on fermentation by the rat cecal bacteria. Starch/Starke. 2001;53:424–430.10.1002/(ISSN)1521-379X
- Itoh Y, Yamanaka N, Ogawa N, et al. Effect of the heat-moisture-treated high-amylose starch on cecal fermentation and lipid metabolism. Mem Fac Intgr Arts Gifu Women’s university. 2007;3:121–130.
- Ikeda M, Matsumori S, Akuzawa S. Effect of heat-moisture treatment on the digestibility and viscous characteristics of hard wheat flour and separated wheat starch. Food Preserv Sci. 2008;34:15–20.
- Kawabata A, Takase N, Kuzawa S, et al. Gelatinization characteristics of heat-moisture treated potato and corn starches. J Appl Glycosci. 1996;43:471–477.
- Takahashi T, Shinoda K, Miura M, et al. Effect of heat treatment on physicochemical properties of rice flour. Nippon Shokuhin Kagaku Kogaku Kaishi. 2002;49:757–764.10.3136/nskkk.49.757
- Takahashi T, Miura M, Kobayashi S. Physicochemical properties of pastes and gels of heat-treated rice flour. Nippon Shokuhin Kagaku Kogaku Kaishi. 2003;5:230–236.
- Biliaderis CG, Tonogai JR, Perez CM, et al. Thermophysical properties of milled rice starch as influenced by variety and parboiling method. Cereal Chem. 1993;70:512–516.
- Morrison WR. Lipids in cereal starches: a review. J Cereal Sci. 1988;8:1–15.
- Fukui T, Nikuni Z. Heat-moisture treatment of cereal starch observed by x-ray diffraction. Note. Agr. Biol. Chem. 1969;33:460–462.10.1080/00021369.1969.10859338
- Kitahara K, Suganuma T, Nagahama T. Susceptibility of amylose-lipid complexes to hydrolysis by glucoamylase from Rhizopus niveus. Cereal Chem. 1996;73:428–432.
- Lagendijk J, Pennings HJ. Relation between complex formation of starch with monoglycerides and the firmness of bread. Cereal Sci Today. 1970;15:354–365.
- Ohtsubo K. Chemical components of rice (Rice-bran oil). In: Science of rice (in Japan). Tokyo: Asakurashoten; 1995. p. 172–174.
- Fujino Y. Rice lipid. Cereal Chem. 1978;55:559–571.
- Godber JS, Juliano BO. Rice lipids. In: Champagne ET, editor. Rice, chemistry and technology. 3rd ed. St. Paul (USA): Am. Assoc. Cereal Chem; 2004.
- Hikida Y, Abe T, Ofoche CE. The effect of heating operation on fat acidity development in rice grain. Jpn Soc of Agric Mach. 1993;55:51–57.
- Ohtsubo K, Yanase H, Isima T. Colorimetric determination of fat acidity of rice: relation between quality change of rice during storage and fat acidity determined by improved Duncombe method. Rep Nat Food Res Inst. 1987;51:59–65.
- Shibuya N, Iwasaki T, Yanase H. Studies on deterioration of rice during storage. Nippon Shokuhin Kagaku Kogaku Kaishi. 1974;21:597–603.10.3136/nskkk1962.21.597
- Saito S. Rice starch and rice powder as materials for food industry (in Japanese). J Jpn Soc Starch Sci. 1980;27:295–313.10.5458/jag1972.27.295
- Hoover R. The impact of heat-moisture treatment on molecular structures and properties of starches isolated from different botanical sources. Crit Rev Food Sci Nutr. 2010;50:835–847.10.1080/10408390903001735
- Hoover R, Vasanthan T. Effect of heat-moisture treatment on the structure and physicochemical properties of cereal, legume, and tuber starches. Carbohydr Res. 1994;252:33–53.10.1016/0008-6215(94)90004-3
- Taniguchi H, Hashimoto H, Hosoda A, et al. Functionality of compounds contained in rice bran and their improvement. Nippon Shokuhin Kagaku Kogaku Kaishi. 2012;59:301–318.10.3136/nskkk.59.301
- Plat J, Mensink RP. Plant stanol and sterol esters in the control of blood cholesterol levels: mechanism and safety aspects. Am J Cardiol. 2005;96:15–22.10.1016/j.amjcard.2005.03.015
- Ha T-Y, Han S, Kim S–R, et al. Bioactive components in rice bran oil improve lipid profiles in rats fed a high-cholesterol diet. Nutr Res. 2005;25:597–606.10.1016/j.nutres.2005.05.003
- Prior RL, Hoang H, Gu L, et al. Assay for hydrophilic and lipophilic antioxidant capacity(oxygen radical absorbance capacity (ORACFL) of plasma and other biological and food samples. J Agric Food Chem. 2003;51:3273–3279.10.1021/jf0262256
- Ito M, Ohara E, Kobayashi A, et al. Antioxidant capacities and polyphenol content of colored rice cultivars. Nippon Shokuhin Kagaku Kogaku Kaishi. 2011;58:576–582.10.3136/nskkk.58.576
- Watanabe J, Oki T, Takebayashi J, et al. Method validation by interlaboratory studies of improved hydrophilic oxygen radical absorbance capacity methods for the determination of antioxidant capacities of antioxidant solutions and food extracts. Anal Sci. 2012;28:159–165.10.2116/analsci.28.159
- Watanabe J, Oki T, Takebayashi J, et al. Improvement of the lipophilic-oxygen radical absorbance capacity (L-ORAC) method and single-laboratory validation. Biosci Biotechnol Biochem. 2013;77:857–859.10.1271/bbb.120786
- Juliano BO, Onate LU, Mundo AM. A simplified assay for milled rice amylose. Food Technol. 1965;19:1006–1011.
- Nakamura S, Satoh H, Ohtsubo K. Development of formulae for estimating amylose content, amylopectin chain length distribution, and resistant starch content based on the iodine absorption curve of rice starch. Biosci Biotechnol Biochem. 2015;79:443–455.10.1080/09168451.2014.978257
- Toyoshima H, Okadome H, Ohtsubo K, et al. Cooperative test on the small-scale rapid method for the gelatinization properties test of rice flours with a rapid visco analyser (in Japanese). Nippon Shokuhin Kagaku Kogaku Kaishi. 1997;44:579–584.10.3136/nskkk.44.579
- Nakamura S, Katsura J, Kato K, et al. Development of formulae for estimating amylose content and resistant starch content based on the pasting properties measured by RVA of Japonica polished rice and starch. Biosci Biotechnol Biochem. 2016;80:329–340.10.1080/09168451.2015.1088373
- Okadome H, Toyoshima H, Ohtsubo K. Many–sided evaluation of physical properties of cooked rice grains with a single apparatus. Nippon Shokuhin Kagaku Kogaku Kaishi. 1996;43:1004–1011.10.3136/nskkk.43.1004
- Okadome H, Kurihara M, Kusuda O, et al. Multiple measurements of physical properties of cooked rice grains with different nitrogenous fertilizers. Jpn J Crop Sci. 1999;68:211–216.10.1626/jcs.68.211
- Tsuyukubo M, Ookura T, Mabashi Y, et al. Different distributions ofα- glucosidases and amylases in milling fractions of rice grains. Food Sci Technol. 2010;16:523–530.
- Matsuda H, Hirayama O. Changes of lipid components and lipolytic acyl-hydrolase activities in rice grains during their storage. Biosci Biotechnol Biochem. 1973;47:379–384.
- Katsuhara Y, Moritaka S, Kakinuma T. Effect of the change during storage in lipid composition of rice on its amylogram. Agr Biol Chem. 1964;28:265–272.
- Nakamura S, Ohtsubo K. Influence of physicochemical properties of rice flour on oil uptake of tempura frying batter. Biosci Biotechnol Biochem. 2010;74:2484–2489.10.1271/bbb.100584
- Muramoto Y, Ohtani K, Inamura M, et al. Characterization of cooking properties of heat/moisture-treated Kuzu(Pueraria lobata) starch. Trance Nutri Res. 2010;27:1–6.
- Ohtsubo K. Chemical components of rice (Rice-bran oil). In: Science of rice (in Japan). Tokyo: Asakurashoten; 1995. p. 20–38.
- Hague A, Manning AM, Hanlon KA, et al. Sodium butyrate induces apoptosis in human colonic tumour cell lines in a p53-independent pathway: Implications for the possible role of dietary fibre in the prevention of large-bowel cancer. Int J Cancer. 1993;55:498–505.10.1002/(ISSN)1097-0215
- Nakamura S, Satoh H, Ohtsubo K. Characteristics of pregelatinized ae mutant rice flours prepared by boiling after preroasting. J Agr Food Chem. 2011;59:10665–10676.10.1021/jf200973x
- Higgins JA. Resistant starch: metabolic effects and potential health benefits. J AOAC Int. 2004;87:761–768.
- Hayakawa T, Tsuge H. Starch intake and health-physiological effects of resistant starch. J Jpn Assoc Dietary Fiber Res. 1999;3:55–64.
- Hoover R. The impact of heat-moisture treatment on molecular structures and properties of starches isolated from different botanical sources. Crit Rev Food Sci Nutr. 2010;50:835–847.10.1080/10408390903001735
- Juliano BO, Onate LU, Mundo AM. A simplified assay for milled rice amylose. Food Technol. 1965;19:1006–1011.
- Okadome H, Kurihara M, Kusuda O, et al. Multiple measurements of physical properties of cooked rice grains with different nitrogenous fertilizers. Jpn J Crop Sci. 1999;68:211–216.10.1626/jcs.68.211
- Gallant DJ, Bouchet B, Baldwin PM. Microscopy of starch evidence of a new level of granule organization. Carbohydrate Polym. 1997;32:177–191.10.1016/S0144-8617(97)00008-8
- Nakamura Y, Sakurai A, Inaba Y, et al. The fine structure of amylopectin in endosperm from asian cultivated rice can be largely classified into two classes. Starch /Starke. 2002;54:117–131.10.1002/1521-379X(200204)54:3/4<117::AID-STAR117>3.0.CO;2-2
- Hizukuri S. Polymodal distribution of the chain lengths of amylopectins and its significance. Carbohydr Res. 1986;147:342–347.10.1016/S0008-6215(00)90643-8
- Robin JP, Mercier C, Charbonniere R, et al. Gel filtration and enzymatic studies of insoluble residues from prolonged acid treatment of potato starch. Cereal Chem. 1974;51:389–406.
- Nakamura S, Cui J, Zhang X, et al. Comparison of eating quality and physicochemical properties between Japanese and Chinese rice cultivars. Biosci Biotechnol Biochem. 2016;80:2437–2449.10.1080/09168451.2016.1220823
- Nakamura S, Ohtsubo K. Improvement of palatability and inhibition of abrupt increase in postprandial blood glucose level by the boiled rice after soaking with functional food ingredients. J Appl Glycosci. 2015;62:53–63.10.5458/jag.jag.JAG-2014_014
- Nilsson AC, Ostman EM, Granfeldt Y, et al. Effect of cereal test breakfasts differing in glycemic index and content of indigestible carbohydrates on daylong glucose tolerance in healthy subjects. J Clinic Nutr. 2008;87:645–654.
- Nakamura S, Katsura J, Kato K, et al. Development of formulae for estimating amylose content and resistant starch content based on the pasting properties measured by RVA of Japonica polished rice and starch. Biosci Biotechnol Biochem. 2016;80:329–340.10.1080/09168451.2015.1088373
- Kiribuchi T, Kubota K. Studies on lipid components and heat dependent pasting behavior of rice and waxy rice grains. Biosci Biotechnol Biochem. 1977;51:621–624.
- Kawashima K, Kiribuchi T. Studies on lipid components and heat dependent pasting behavior of non-waxy and waxy-rice starches. J Home Econ Jpn. 1980;31(9):625–628.
- Taira H, Nakagahra M, Nagamine T. Fatty acid composition of Indica, Sinica, Javanica, Japonica groups of nonglutinous brown rice. J Agric Food Chem. 1988;36:45–47.10.1021/jf00079a011
- Taira H, Taira H, Fujii K. Influence of cropping season on lipid content and fatty acid composition of lowland non-glutinous brown rice. Jpn J Crop Sci. 1979;48:371–377.10.1626/jcs.48.371
- Sato Y, Ogata J, Nakazawa F, et al. Fatty acid composition of lipids in nonglutinous and glutinous rice. J Home Econ Jpn. 1977;28:403–407.
- Ikemoto A, Naganuma S. Varietal differences in lipid content and fatty acid composition of milled rice and their influence on dietary balance of lipid nutrition. Mem Fac Intgr Arts Akita university. 2007;62:19–28.
- Barber S. Basic studies on aging of milled rice and application to discriminating quality factors. Project E-25, AMS-9, final report. USDA, ARS, Foreign Research and Technical Program Division. 189 pp.
- Mano Y, Kawaminami K, Kojima M, et al. Comparative composition of brown rice lipids(lipid fractions) of Indica and Japonica rices. Biosci Biotechnol Biochem. 1999;63:619–626.10.1271/bbb.63.619
- Takano K, Kamoi I, Obara T. Properties and degradation of rice bran spherosome. Nippon Shokuhin Kagaku Kogaku Kaishi. 1989;6:468–474.
- Takano K, Kamoi I, Obara T. Change in lipid components and lipolytic enzyme activities of rice bran during storage. Nippon Shokuhin Kagaku Kogaku Kaishi. 1986;33:310–315.10.3136/nskkk1962.33.5_310
- Yasumatsu K, Moritaka S. Fatty acid compositions of rice lipid and their changes during storage. Agr Biol Chem. 1964;28:257–264.10.1080/00021369.1964.10858241
- Takami K, Koriyama T, Ohtsubo K. Staling characteristics of cooked low-amylose rice and proposal of evaluation method. Nippon Shokuhin Kagaku Kogaku Kaishi. 1998;45:469–477.10.3136/nskkk.45.469
- Whistler RL, Johnson C. Effect of acid hydrolysis on the retrogradation of amylose. Cereal Chem. 1948;25:418–424.
- Foster JF, Paschall EP. Effect of disaggregation of amylase on the properties of the iodine complex. J Am Chem Soc. 1953;75:1181–1183.10.1021/ja01101a051
- Kuge T, Kitamura S. Annealing of starch granules – warm water treatment and heat-moisture treatment. J Jpn Soc Starch Sci. 1985;32:65–83.10.5458/jag1972.32.65
- Hormdok R, Noomhorm A. Hydrothermal treatment of rice starch for imporvment of rice noodle quality. LWT-Food Sci Technol. 2007;40:1723–1731.10.1016/j.lwt.2006.12.017
- Kuip K, Lorenz K. Heat-moisture treatment of starches. 1. Physicochemical properties. Cereal Chem. 1981;58:46–48.
- Katsuhara Y, Moritaka S, Kakinuma T. Effect of the change during storage in lipid composition of rice on its amylogram. Agr Biol Chem. 1964;28:265–272.
- Dhaliwal YS, Sekhon KS, Nagi HPS. Enzymatic activities and rheological properties of stored rice. Cereal Chem. 1991;68:18–21.
- Shin MG, Rhee JS, Kwon TW. Effects of amylase activity on changes in amylogram characteristics during storage of brown rice. Rapid Paper Agr Biol Chem. 1985;49:2505–2508.