
ABSTRACT
Progress in metabolomic analysis now allows the evaluation of food quality. This study aims to identify the metabolites in meat from livestock using a metabolomic approach. Using gas chromatography–mass spectrometry (GC/MS), many metabolites were reproducibly detected in meats, and distinct differences between livestock species (cattle, pigs, and chickens) were indicated. A comparison of metabolites between tissues types (muscle, intramuscular fat, and intermuscular fat) in marbled beef of Japanese Black cattle revealed that most metabolites are abundant in the muscle tissue. Several metabolites (medium-chain fatty acids, etc.) involved in triacylglycerol synthesis were uniquely detected in fat tissue. Additionally, the results of multivariate analysis suggest that GC/MS analysis of metabolites can distinguish between cattle breeds. These results provide useful information for the analysis of meat quality using GC/MS-based metabolomic analysis.
ABBREVIATIONS: GC/MS: gas chromatography-mass spectrometry; NMR: nuclear magnetic resonance; MS: mass spectrometry; IS: 2-isopropylmalic acid; MSTFA: N-Methyl-N-trimethylsilyltrifluoroacetamide; CV: coefficient of variation; TBS: Tris-buffered saline; MHC: myosin fast type; PCA: principal component analysis; OPLS-DA: orthogonal partial least-squares discriminant analysis; O2PLS: two-way orthogonal partial least-squares
Graphical Abstract
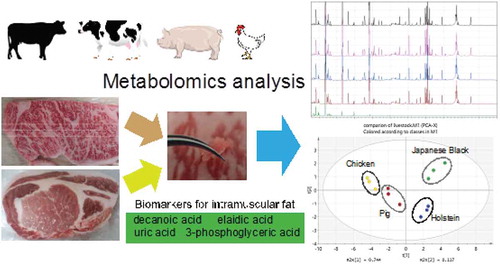
Comparative metabolomics of Japanese Black cattle beef and other meats using gas chromatography–mass spectrometry.
The use of metabolomics is expanding to agricultural fields as a promising technology. Metabolomic studies are used for the comprehensive analysis of the nutritional composition of foods, and the data are used for evaluating food quality for use in trait selection for the market [Citation1–Citation3]. Recently, metabolomic studies have been conducted using nuclear magnetic resonance (NMR) and mass spectrometry (MS) technologies [Citation4]. NMR-based metabolomics enables rapid analysis in food science studies [Citation5–Citation7]. In contrast, MS-based metabolomics provides superior sensitivity for the detection of metabolites at nanomolar levels and can be used to analyze a wide variety of metabolites, depending on the resolution capability of the chromatographic device [Citation8,Citation9]. Despite these advances in metabolomic technology, few reports describe the use of metabolomic analysis in meat science studies [Citation4].
The quality of meat required for human consumption varies according to the food culture in different countries. Chickens, pigs, and cattle are bred as major livestock worldwide. Japanese Black cattle, also known as “Japanese Wagyu,” is a very popular meat in many countries [Citation10]. The beef of Japanese Black cattle has unique marbling derived from intramuscular fat deposition in the muscle. Holstein cattle is also well-known dairy steer breed in Japan [Citation11]. The development of muscle and intramuscular fat deposition of Japanese Black cattle is different from Holstein [Citation12,Citation13]. Since the level of marbling (fat to muscle ratio) contributes to favorable features, such as extreme tenderness [Citation11] and delicious flavor [Citation14,Citation15], all carcasses are judged with respect to the degree of beef marbling by visual inspection using the Beef Marbling Standard in Japan. Japanese Black cattle beef with a high marbling score is sold as high-quality meat [Citation16]. To date, the accurate metabolomic analysis of endogenous metabolites in solid tissue, such as meat, has been difficult due to the uneven distribution of tissue components. In addition, in non-target analysis, the identification of metabolites from complex peaks is difficult. Gas chromatography (GC)/MS can detect volatile compounds with high sensitivity and is widely used for the identification of metabolites in medical research [Citation17,Citation18].
This study aims to identify the metabolites in meat from major livestock using a metabolomic approach and to improve the reproducibility of metabolomic analyses. We sought to optimize the preparation and analysis of meat samples for a variety of meats. We were able to analyze 475 metabolites and to detect more than 100 metabolites for comparison between livestock species, tissue types, and breed using GC/MS-based metabolomics analysis.
Materials and methods
Reagents
Most chemical reagents were purchased from Wako Pure Chemical Industries, Ltd. (Osaka, Japan). 2-isopropylmalic acid (IS) and methoxyamine hydrochloride were purchased from Sigma-Aldrich (Tokyo, Japan). N-Methyl-N-trimethylsilyltrifluoroacetamide (MSTFA) was purchased from GL Sciences (Tokyo, Japan).
Sample collection
The longissimus thoracis from Japanese Black cattle (31–32 months old), Holstein cattle (dairy steer, 21 months old), and crossbred Camborough/Duroc pigs (150–190 days old) and the pectoralis major of broiler chicken (63–65 days old) were purchased from meat processing plants. The meats of Japanese Black cattle and Holstein cattle were vacuum packed after slaughter. The block of longissimus muscle was stored at 4°C for 20 days and sliced into 1-cm-thick steaks. These steaks were individually re-packaged and frozen-stocked at −30°C. After overnight slow thawing at 4°C (total postmortem time, 21 days), several pieces of beef and pork were collected from the center portion of the steak. Several pieces of chicken were collected from breast meat. Pigs and chicken were collected from fresh meat without ageing period. All Japanese Black cattle used in this study were Grade 4 or 5 according to the Japan Meat Grading Association.
Preparation of water-soluble extracts from samples
Muscle tissue (0.1 g) was homogenized with 990 μL of extraction solvent (methanol:chloroform:water, 2.5:1:1) containing IS (1.2 μg/mL) at 3000 rpm for 30 s by a shaker (ThermoMixer, Eppendorf Japan Co., Tokyo, Japan). In the comparison of the tissue types, muscle and fat tissue (0.1 g) were initially dissolved in 220 μL of chloroform and homogenized with 770 μL of methanol solution (methanol:water, 2.5:1) containing IS. These suspensions of muscle or fat tissue were added to 200 μL of water and shaken at 1200 rpm by the shaker for 30 min at 37°C. After centrifugation at 16,000 × g for 5 min, 600 μL of the supernatant (A) was collected.
In another preparation of marbled beef, 0.45 g of minced beef was sufficiently homogenized with 4.5 mL of extraction solvent containing IS to avoid bias due to uneven distribution of the marbling. To the suspension, 900 μL of water was added, followed by shaking at 280 rpm for 30 min. After centrifugation at 14,000 × g for 5 min, 600 μL of the supernatant (B) was collected. For all samples, supernatant (A) or (B) was added to 560 μL of water and suspended by shaking at 3000 rpm for 30 s. After centrifugation at 16,000 × g for 5 min, 720 μL of the supernatant was collected as the water-soluble extract.
Preparation of sample for GC/MS analysis
The water-soluble extract was completely dried using centrifugal drying for 60 min and freeze drying for 16 h. The dried samples were dissolved in 80 μL of pyridine containing 20 mg/mL of methoxyamine hydrochloride for 30 min with shaking at 1200 rpm by the shaker. The mixture was derivatized with 40 μL of MSTFA for 30 min with shaking at 1200 rpm at 37°C. After centrifugation of samples at 16,000 × g for 5 min at 4°C, 50 μL of the resulting supernatant was used for GC/MS analysis.
GC/MS analysis
GC/MS analysis was performed on a GCMS-QP2010 Ultra (Shimadzu Co., Kyoto, Japan) with a DB-5 capillary column (30 m × 0.25 mm; film thickness, 1.0 μm) (Agilent Technologies, Santa Clara, CA, USA). The column temperature was held at 100°C for 4 min and then raised by 10°C/min to 320°C and held at 320°C for 6–11 min. The front inlet temperature was held at 280°C. The helium gas flow rate was 39.0 cm/s. The injected sample volume was 1 μL. The interface and ion-source temperatures were 280°C and 200°C, respectively. The mass range of the scan mode was set at 45–600 m/z. The mass spectrum was analyzed using GC/MS Metabolite Database Ver. 2. The amount of each metabolite was calculated using the intensity (peak area of metabolites/peak area of IS) indicated in the GC/MS spectrum [Citation2,Citation19].
Immunoblotting
For the immunoblot analysis, equal amounts of protein (7.5 μg/lane) were separated by SDS-PAGE and electrotransferred to a PVDF membrane as described in our previous reports [Citation20,Citation21]. After blocking with 5% skim milk in Tris-buffered saline (TBS) containing 0.05% Tween 20, the membranes were incubated with anti-myosin fast type (MHC) antibody (#M4276; Sigma-Aldrich) and anti-perilipin antibody (bs-6765R; Bioss Antibodies, MA, USA) diluted in TBS with 0.05% Tween 20 for 1 h. The bound antibodies were detected by chemiluminescence (LumiCube Plus; Liponics, Inc., Tokyo, Japan) using a horseradish peroxidase-conjugated secondary antibody (Jackson Immunoresearch Laboratories.) and ImmunoStar Zeta detection reagents (Wako). The amounts of protein applied were confirmed by Ponceau S (Sigma-Aldrich) staining of the membrane.
Sensory evaluation
The evaluation was performed on retronasal aroma [Citation22] by trained panelists in Japan Meat Science and Technology Institute. According to the sensory evaluation guidelines of meat (National Livestock Breeding Center, Tokyo, Japan), sensory evaluation was performed on five items on 4-point scales using slice beef which were boiled for 2 min in 1% NaCl solution at 80°C [Citation15].
Statistical analysis
Statistical significance was determined from the p-value (Student’s t-test). The correlation coefficient and Venn diagrams were determined using JMP12 software (SAS Ins., Japan, Tokyo, Japan). Multivariate data analysis of principal component analysis (PCA) and orthogonal partial least-squares discriminant analysis (OPLS-DA) and two-way orthogonal partial least-squares (O2PLS) [Citation23] was performed using SIMCA14 software (Inforcom Co., Tokyo, Japan).
Results
Metabolomic analysis of meat extracts using GC/MS
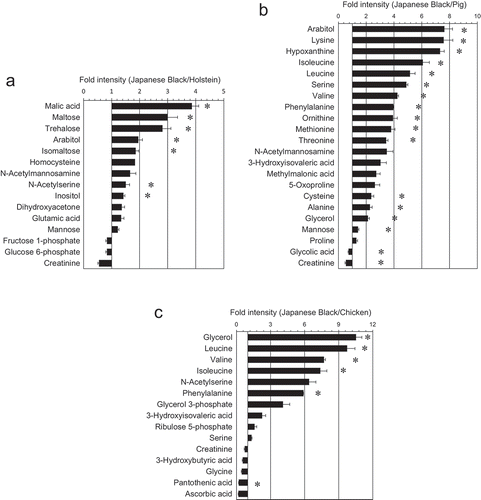
Before conducting the metabolomic studies, we evaluated the accuracy of GC/MS using the coefficient of variation (CV%). In a 100-mg sample, the largest number of metabolites was 83 metabolites (77 metabolites below CV20%), with reproducibility confirmed. The list of metabolites is shown in Table S1. To compare metabolites between Japanese Black cattle and other livestock, we collected only the muscle tissue of each livestock and analyzed muscle tissue extracts using GC/MS. Comparison of the muscle tissue chromatograms between livestock is shown in ()). In Japanese Black cattle, 90 metabolites were detected in the 100 mg sample. The total number of metabolites detected and the number of metabolites below the CV20% are shown in ()). The Venn diagram indicates the number of specific metabolites and/or commonly detected metabolites below the CV20% ()). Metabolic profiles were compared between livestock species using a scatter diagram ()). Based on correlation coefficients, the highest correlation observed was between Japanese Black and Holstein cattle (R2 = 0.964), followed by Japanese Black cattle and pigs (R2 = 0.915), and Japanese Black cattle and chickens (R2 = 0.691). An overview of the metabolic profiles of livestock species was determined using PCA () and )). The score plot in ()) shows the variation between livestock species (t [Citation1] axis, 74.4%; t [Citation2] axis = 11.7%). The loading plot shows the variation in metabolites between livestock species ()). The details of metabolites that differ significantly between livestock species are listed in ().
Figure 1. Evaluation of GC/MS for analysis of meat metabolites.
(a) Chromatogram shows the total ion content of muscle tissues isolated from livestock. These chromatographs show a comparison among Japanese black cattle, Holstein, pig, and chickens. Asterisk indicates the peak of IS (16.5 minutes). (b) Venn diagram showing the number of overlapping metabolites with reproducibility between livestock species.
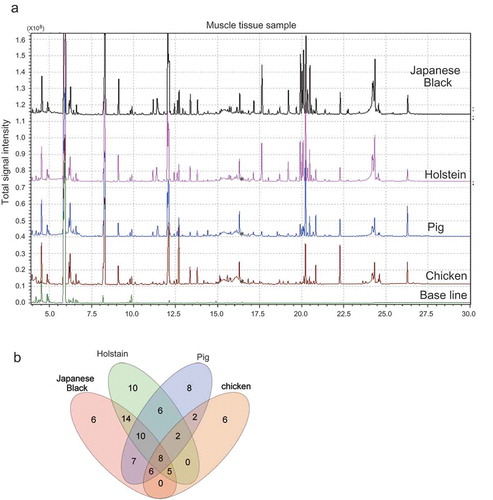
Figure 2. Comparison of detected metabolites between meats.
(a) Scatter plot shows the mean peak intensity of metabolites as indicated by GC/MS (each type of livestock, n = 3). The R2 values indicate the degree of correlation. Numbers in A and C indicate the following compounds: 1, mannose; 2, phospholic acid; 3, fructose 1-phosphate; 4, allose; 5, lactic acid; 6, urea; 7, glycine; 8, inositol. (b) PCA score plot demonstrating the correlation in metabolites between livestock species (Scaling, Pareto variance). The PCA model was analyzed using fitting parameters (Components, 4; R2 [cum] = 0.960; Q2 [cum] = 0.868). (c) The loading plot demonstrates the relationship between metabolite attributes and the PCA plot.
![Figure 2. Comparison of detected metabolites between meats.(a) Scatter plot shows the mean peak intensity of metabolites as indicated by GC/MS (each type of livestock, n = 3). The R2 values indicate the degree of correlation. Numbers in A and C indicate the following compounds: 1, mannose; 2, phospholic acid; 3, fructose 1-phosphate; 4, allose; 5, lactic acid; 6, urea; 7, glycine; 8, inositol. (b) PCA score plot demonstrating the correlation in metabolites between livestock species (Scaling, Pareto variance). The PCA model was analyzed using fitting parameters (Components, 4; R2 [cum] = 0.960; Q2 [cum] = 0.868). (c) The loading plot demonstrates the relationship between metabolite attributes and the PCA plot.](/cms/asset/29f65c2e-9586-42e8-b926-9a4b402c21bf/tbbb_a_1528139_f0002_oc.jpg)
Figure 3. Metabolites that differ significantly between Japanese Black cattle and other livestock.
Fold changes in graphed data indicate significant differences in metabolites (n = 3; p < 0.05). (a) Japanese Black vs. Holstein cattle. (b) Japanese Black cattle vs. pigs. (c) Japanese Black cattle vs. chickens. The data represent the relative values of the normalized peak intensity of meats compared with that of Japanese Black cattle. *significant difference (p < 0.01)
Metabolomic analysis of metabolites in muscle, intramuscular fat, and intermuscular fat in marbled beef
Samples of the muscle, the intramuscular fat, and the intermuscular fat were cautiously picked-up from steak cut beef. The photograph of ()) shows the closeup image of the picked-up muscle sample. The purity of the isolated tissue samples was confirmed by immunoblotting with antibodies for specific tissue markers ()). Immunoblotting revealed a strong signal for MHC (muscle-specific marker) in muscle tissue; the adipose-specific marker perilipin [Citation24] was predominantly detected in intramuscular fat and intermuscular fat. In this analysis, the signal intensity of GC/MS from both intramuscular fat and intermuscular fat were weaker than muscle tissue sample (Fig. S2). The PCA score plot demonstrates two clusters, indicating the two types of tissue: muscle and fat (t [Citation1] axis = 83.5 %; t [Citation2] axis = 6.5 %; data not shown). These data were further analyzed using OPLS-DA [Citation25]. The OPLS-DA score plot indicates a clear distinction between muscle and fat tissue ()). The loading plot indicates the variation in metabolites between muscle and fat tissue ()). Decanoic acid, uric acid, elaidic acid, and 3-phosphoglyceric acid were only detected in fat tissues. Quantitative measurements of these metabolites for potential use as biomarkers for marbling are shown in ()).
Figure 4. Comparison of metabolite levels between muscle and fat tissue.
(a) Photograph showing the collection of small samples of muscle tissue from marbled beef. (b) To confirm the purity of isolated tissues, tissue-specific marker proteins were detected with immunoblotting. Several pieces of the muscle tissue and intramuscular fat were collected from the center of steak-cut beef. The intermuscular fat was collected from the peripheral area of the steak. (c) OPLS-DA score plot demonstrates the relationship between metabolites in muscle and fat tissue (each tissue type, n = 4; Scaling, Pareto variance). The OPLS-DA model was analyzed using fitting parameters (Components, [1 + 2]; R2 [cum] = 0.996; Q2 [cum] = 0.987). (d) S-plot of OPLS-DA demonstrates the correlation in metabolites between tissue types. Positive p-values (0 to 1.0) indicate a greater abundance of the metabolite in fat than in muscle; negative p-values (0 to −1.0) indicate a greater abundance of the metabolite in muscle than in fat. (e) The graph demonstrates (mean ± standard error, n = 4) represent the values of metabolites in each tissue.
![Figure 4. Comparison of metabolite levels between muscle and fat tissue.(a) Photograph showing the collection of small samples of muscle tissue from marbled beef. (b) To confirm the purity of isolated tissues, tissue-specific marker proteins were detected with immunoblotting. Several pieces of the muscle tissue and intramuscular fat were collected from the center of steak-cut beef. The intermuscular fat was collected from the peripheral area of the steak. (c) OPLS-DA score plot demonstrates the relationship between metabolites in muscle and fat tissue (each tissue type, n = 4; Scaling, Pareto variance). The OPLS-DA model was analyzed using fitting parameters (Components, [1 + 2]; R2 [cum] = 0.996; Q2 [cum] = 0.987). (d) S-plot of OPLS-DA demonstrates the correlation in metabolites between tissue types. Positive p-values (0 to 1.0) indicate a greater abundance of the metabolite in fat than in muscle; negative p-values (0 to −1.0) indicate a greater abundance of the metabolite in muscle than in fat. (e) The graph demonstrates (mean ± standard error, n = 4) represent the values of metabolites in each tissue.](/cms/asset/2a85a47e-bdc3-4c19-8ab3-9490f54bcc82/tbbb_a_1528139_f0004_oc.jpg)
Comparative analysis of beef metabolites between different cattle breeds
The metabolites in marbled beef, including muscle and intramuscular fat tissues, were compared between Japanese Black cattle (types A and B) and Holstein cattle. Japanese Black cattle of type A are described as having “excellent body weight growth,” whereas those of type B have “excellent meat quality” ((a)). A total of 90 metabolites were detected; high reproducibility below CV20% was confirmed for 44 and 41 metabolites in type A and type B Japanese Black cattle and 22 metabolites in Holstein cattle. All detected metabolites were compared using PCA (Fig. S3) and OPLS-DA ()). The score plot demonstrates three clusters, representing the three breeds of cattle (t [Citation1] axis = 85.5 %; t [Citation2] axis = 6.5 %) ((a)). The distribution of metabolites between breeds is shown in the loading plot ()). To analyze the correlation between the metabolites and beef quality, sensory evaluation was performed using the analyzed beef. In comparison with Holstein, the Japanese Black cattle showed significantly higher values at oily flavor, sweet flavor, wagyu beef aroma and the overall evaluation. On the other hand, Holstein showed the highest values at beef flavor ()). O2PLS score plot using the data of sensory evaluation indicates good discrimination between Holstein and Japanese Black cattle. This model showed Holstein is strongly related to beef flavor, and Japanese Black cattle type B is related to sweet flavor ()). The related loading plot demonstrates the relation between metabolites and the flavor ()). This model showed the presence of strong markers, such as decanoic acid and glutamine for oily flavor, wagyu beef aroma and the overall evaluation.
Figure 5. Comparison of metabolites in different cattle breeds using GC/MS.
(a) OPLS-DA score plot visualizes the relationship between metabolites in Japanese Black and Holstein cattle. Types A and B are genetically different Japanese Black cattle (each type of cattle, n = 6; Scaling, Pareto variance). The OPLS-DA model was used for analysis with fitting parameters (Components, [1 + 2]; R2 [cum] = 0.940; Q2 [cum] = 0.838). (b) S-plots of OPLS-DA data demonstrating the relationship between metabolites in different cattle breeds. Positive p-values (0 to 1.0) indicate a greater abundance of the metabolite in Holstein than in Japanese Black cattle; negative p-values (0 to −1.0) indicate a greater abundance of the metabolite in Japanese Black than in Holstein cattle. The P [Citation1] axis indicates the metabolites responsible for the difference in score plots. Color gradation in the plots indicates the metabolite classes. (c) Presence of decanoic acid as determined by GC/MS. The signal intensity of decanoic acid was significantly greater in Japanese Black than in Holstein cattle.
![Figure 5. Comparison of metabolites in different cattle breeds using GC/MS.(a) OPLS-DA score plot visualizes the relationship between metabolites in Japanese Black and Holstein cattle. Types A and B are genetically different Japanese Black cattle (each type of cattle, n = 6; Scaling, Pareto variance). The OPLS-DA model was used for analysis with fitting parameters (Components, [1 + 2]; R2 [cum] = 0.940; Q2 [cum] = 0.838). (b) S-plots of OPLS-DA data demonstrating the relationship between metabolites in different cattle breeds. Positive p-values (0 to 1.0) indicate a greater abundance of the metabolite in Holstein than in Japanese Black cattle; negative p-values (0 to −1.0) indicate a greater abundance of the metabolite in Japanese Black than in Holstein cattle. The P [Citation1] axis indicates the metabolites responsible for the difference in score plots. Color gradation in the plots indicates the metabolite classes. (c) Presence of decanoic acid as determined by GC/MS. The signal intensity of decanoic acid was significantly greater in Japanese Black than in Holstein cattle.](/cms/asset/2efcdcaf-eb3d-4a1a-84e0-565d0d9f91d7/tbbb_a_1528139_f0005_oc.jpg)
Figure 6. Relationships between metabolites and sensory evaluation.
(a) The graph demonstrates the values of flavor intensity in each cattle. For the sensory evaluation, the same sample of the Japanese Black type A, type B and Holstein cattle in were used. (mean ± standard error, each type of cattle, n = 6). (b) O2PLS score plot visualizes the relationship between Japanese Black type A, type B and Holstein cattle using data of metabolites for X variable and result of the sensory evaluation for Y variable (each type of cattle, n = 6; Scaling, UV). The O2PLS model was used for analysis with fitting parameters (Components, [1 + 2]; R2 [cum] = 0.825; Q2 [cum] = 0.967). (c) The loading plot demonstrates the relationship between metabolite and items of sensory evaluation.
![Figure 6. Relationships between metabolites and sensory evaluation.(a) The graph demonstrates the values of flavor intensity in each cattle. For the sensory evaluation, the same sample of the Japanese Black type A, type B and Holstein cattle in Figure 5 were used. (mean ± standard error, each type of cattle, n = 6). (b) O2PLS score plot visualizes the relationship between Japanese Black type A, type B and Holstein cattle using data of metabolites for X variable and result of the sensory evaluation for Y variable (each type of cattle, n = 6; Scaling, UV). The O2PLS model was used for analysis with fitting parameters (Components, [1 + 2]; R2 [cum] = 0.825; Q2 [cum] = 0.967). (c) The loading plot demonstrates the relationship between metabolite and items of sensory evaluation.](/cms/asset/c2112a9c-9b8a-4594-bfce-78a5d9fce6cc/tbbb_a_1528139_f0006_oc.jpg)
Discussion
Our results show that GC/MS-based metabolomic analysis can reproducibly detect more than 80 metabolites in a small piece of meat. The number of metabolites detected in muscle tissue was sufficient to distinguish between Japanese Black cattle, Holstein cattle, pigs, and chickens in PCA multivariate analysis ( and ). The index of reproducibility for GC/MS analysis was determined as the percentage of detected metabolites with a CV < 20% for Japanese Black cattle (62.2%), Holstein cattle (62.5%), pigs (57.6%), and chickens (34.5%) (). One reason for the low CV20% in chickens is that metabolites in poultry muscle are known to change with the passage of time, even with attention to temperature. Because postmortem aging occurs more rapidly in chickens than in other livestock, it is thought that nucleic acids (ATP) and peptides are metabolized to the final decomposition product (eg. hypoxanthine, phosphoric acid, and free amino acid), which cause to increase the CV among chicken samples [Citation26]. Our protocol was able to simultaneously analyze meat of chickens, pigs and cattle by a simple protocol. Since GC/MS has advantages of lower cost of analysis than other mass spectrometry, our protocol is expected to be applicable in various fields such as meat quality evaluation for good quality meat production.
Comparison of GC/MS analyses between livestock species indicated a significant difference (p < 0.05, or *p < 0.01) in 15 metabolites (Japanese Black cattle vs Holstein), 22 metabolites (Japanese Black cattle vs porcine), and 15 metabolites (Japanese Black cattle vs chicken), as determined by Student’s t-test (). Consistent with data from conventional studies, GC/MS detected more branched-chain amino acids (isoleucine, leucine, and valine) in cattle than in pigs or chicken (). In this GC/MS analysis, the metabolites were reproducibly detected in muscle (89 metabolites), intramuscular fat (79 metabolites), and intermuscular fat (79 metabolites). Of the metabolites in fat tissues, 94% metabolites were confirmed with high reproducibility.
Clear differences in metabolites were noted between muscle and fat tissues. We observed that the signal intensity of metabolites in fat tissue is weaker than that in muscle. This observation may reflect the fact that adipocytes account for > 90% of the nonvolatile triacylglycerol (based on weight) (Fig. S2). On the other hand, in comparison between intramuscular fat and intermuscular fat, fructose 1-phosphate, glucose 6-phosphate, trehalose, maltose, homocysteine, threonic acid, asparagine, ribose, and tyrosine in intermuscular fat were detected significantly higher (> 3-fold). OPLS-DA analysis clearly discriminated between tissue types ()). Four metabolites (decanoic acid, uric acid, elaidic acid, and 3-phosphoglyceric acid) were detected only in fat tissues ( and ). The medium-chain fatty acid, decanoic acid, is an intermediate product in fatty acid synthesis [Citation27]. Uric acid and 3-phosphoglyceric acid are involved in triacylglycerol synthesis [Citation28]. Elaidic acid is a trans-isomer of oleic acid that arises from the decomposition of fatty acids [Citation29]. These metabolites likely derive from adipocytes and increase in concentration depending on the degree of marbling [Citation30,Citation31]. Therefore, these metabolites are expected to be useful as biomarkers for marbling, allowing for the setting of internal standards for the evaluation of marbling.
We compared the metabolites in two strains of Japanese Black cattle (type A and B) and Holstein cattle (). GC/MS analysis revealed the presence of 90 metabolites in fat tissue, but the reproducibility was less than that of muscle tissue samples (). As shown for decanoic acid (), the decrease in reproducibility is presumed to be caused by the inclusion of intramuscular fat in the sample. In comparative analyses, the signal intensity for many organic acids and amino acids was 50% lower in type B than in type A, despite the similar degree of marbling ( and ). A significant difference was observed between cattle breeds for 31 metabolites (type A vs type B), 25 metabolites (type A vs Holstein), and 19 metabolites (type B vs Holstein) according to Student’s t-test (p < 0.05) (data not shown). Large variations in metabolites were observed in samples of the same origin, even though we strictly selected the postmortem day of meat processing and paid careful attention to sample preparation. These variations are thought to reflect differences in metabolite concentrations depending on the storage conditions as well as the degree of marbling. For accurate comparison of metabolites between varieties, further studies should be conducted such as large-scale analysis using a greater number of samples and improvement of sample preparation.
The results of this study suggest that GC/MS analysis is a candidate metabolomic approach for the evaluation of meat because of its high reproducibility and range of detection that covers the major metabolites (amino acids, organic acids, and carbohydrates). Recently, other metabolomic approaches (NMR, CE-MS, and LC-MS) have also provided metabolic profiles of meat [Citation6,Citation8,Citation9]. However, further studies are needed to reveal all the metabolites related to meat quality of Japanese Black cattle, which affect flavor, texture, and tenderness [Citation14,Citation32,Citation33]. The detection of false positives or false negatives is another problem with the present technology. In the future, meat analysis using multiple metabolomic approaches is expected to expand the detection range and increase the accuracy of such studies [Citation4].
Conclusion
Using optimized conditions, we identified over 80 metabolites in animal meat using GC/MS-based metabolomic analysis. This report is the first metabolomic study of Japanese Black cattle using GC/MS analysis. The results of this study suggest that several metabolites (decanoic acid, uric acid, elaidic acid, and 3-phosphoglyceric acid) are potential biomarkers for intramuscular fat to assess marbling levels by GC/MS analysis. This study also suggests that decanoic acid and glutamine are potential biomarkers for oily flavor, wagyu beef aroma and the overall evaluation of sensory evaluation. The results of this study may be useful for improving the evaluation of meat quality by metabolomic analysis. In the future, we hope that our results will be used to improve excellent meat production.
Author Contributions
SU designed the experiments and drafted the manuscript. EI managed sample collection of livestock. SU conducted the major experiment and YK supported it. EI, MS, YS, and MY provided valuable advice and assisted with this study. All authors read and approved the final manuscript.
Ueda_Sup_Fig_3.pdf
Download PDF (312 KB)Ueda_Sup_Fig_2.pdf
Download PDF (509 KB)Ueda_Sup_Fig_1.pdf
Download PDF (1,001.8 KB)Acknowledgments
We thank the staff of Shimadzu techno-research Inc. (Kyoto, Japan) for technical advice. This investigation was supported by a grant-in-aid for COE Program (Hyogo, Japan) and the Project study (developing technology for creating new businesses for domestic livestock and their products) for the Agriculture and Livestock Industries Corporation (Tokyo, Japan).
Disclosure statement
No potential conflict of interest was reported by the authors.
Supplementary material
Supplementary data for this article can be accessed here.
Additional information
Funding
Related Research Data
References
- Tian H, Lam SM, Shui G. Metabolomics, a powerful tool for agricultural research. Int J Mol Sci. 2016 Nov 17;17;17(11):1871. . PubMed PMID: 27869667; PubMed Central PMCID: PMCPMC5133871.
- Putri SP, Yamamoto S, Tsugawa H, et al. Current metabolomics: technological advances. J Biosci Bioeng. 2013 Jul;116(1):9–16. PubMed PMID: 23466298.
- Kim S, Kim J, Yun EJ, et al. Food metabolomics: from farm to human. Curr Opin Biotechnol. 2016 Feb;37:16–23. PubMed PMID: 26426959.
- Goldansaz SA, Guo AC, Sajed T, et al. Livestock metabolomics and the livestock metabolome: A systematic review. PloS one. 2017;12(5):e0177675. . PubMed PMID: 28531195; PubMed Central PMCID: PMCPMC5439675
- Straadt IK, Aaslyng MD, Bertram HC. An NMR-based metabolomics study of pork from different crossbreeds and relation to sensory perception. Meat Sci. 2014 Feb;96(2Pt A):719–728. . PubMed PMID: 24200563
- Kodani Y, Miyakawa T, Komatsu T, et al. NMR-based metabolomics for simultaneously evaluating multiple determinants of primary beef quality in Japanese Black cattle. Sci Rep. 2017 May 02;7(1):1297. PubMed PMID: 28465593; PubMed Central PMCID: PMCPMC5431055.
- Kim J, Jung Y, Song B, et al. Discrimination of cabbage (Brassicarapa ssp. pekinensis) cultivars grown in different geographical areas using (1)H NMR-based metabolomics. Food Chemistry. 2013 Apr 15;137(1–4):68–75. PubMed PMID: 23199992.
- Muroya S, Oe M, Nakajima I, et al. CE-TOF MS-based metabolomic profiling revealed characteristic metabolic pathways in postmortem porcine fast and slow type muscles. Meat Sci. 2014 Dec;98(4):726–735. PubMed PMID: 25105492.
- Graham SF, Farrell D, Kennedy T, et al. Comparing GC-MS, HPLC and (1)H NMR analysis of beef longissimus dorsi tissue extracts to determine the effect of suspension technique and ageing. Food Chemistry. 2012 Oct 1;134(3):1633–1639. PubMed PMID: 25005992.
- Sasaki K, Ooi M, Nagura N, et al. Classification and characterization of Japanese consumers’ beef preferences by external preference mapping. J Sci Food Agric. 2017 Aug;97(10):3453–3462. PubMed PMID: 28071797.
- Albrecht E, Gotoh T, Ebara F, et al. Cellular conditions for intramuscular fat deposition in Japanese Black and Holstein steers. Meat Science. 2011 Sep;89(1):13–20. PubMed PMID: WOS:000291962400003; English.
- Huang W, Guo Y, Du W, et al. Global transcriptome analysis identifies differentially expressed genes related to lipid metabolism in Wagyu and Holstein cattle. Sci Rep. 2017 Jul 13;7(1):5278. 10.1038/s41598-017-05702-5. PubMed PMID: 28706200; PubMed Central PMCID: PMCPMC5509646.
- Albrecht E, Komolka K, Ponsuksili S, et al. Transcriptome profiling of Musculus longissimus dorsi in two cattle breeds with different intramuscular fat deposition. Genom Data. 2016 Mar;7:109–111. PubMed PMID: 26981380; PubMed Central PMCID: PMCPMC4778623.
- Inagaki S, Amano Y, Kumazawa K. Identification and characterization of volatile components causing the characteristic flavor of wagyu beef (Japanese Black cattle). J Agric Food Chem. 2017 Oct 4;65(39):8691–8695. . PubMed PMID: 28889748.
- Matsuishi M, Fujimori M, Okitani A. Wagyu beef aroma in wagyu (Japanese Black Cattle) beef preferred by the Japanese over Imported Beef. Anim Sci J. 2001;72(6):498–504.
- Iida F, Saitou K, Kawamura T, et al. Effect of fat content on sensory characteristics of marbled beef from Japanese Black steers. Anim Sci J. 2015 Jul;86(7):707–715. PubMed PMID: 25492124.
- Suzuki M, Nishiumi S, Matsubara A, et al. Metabolome analysis for discovering biomarkers of gastroenterological cancer. J Chromatogr B Analyt Technol Biomed Life Sci. 2014 Sep 1;966:59–69. PubMed PMID: 24636738.
- Yonezawa K, Nishiumi S, Kitamoto-Matsuda J, et al. Serum and tissue metabolomics of head and neck cancer. Cancer Genomics Proteomics. 2013 Sep-Oct;10(5):233–238. PubMed PMID: 24136976.
- Nishiumi S, Kobayashi T, Ikeda A, et al. A novel serum metabolomics-based diagnostic approach for colorectal cancer. PloS one. 2012;7(7):e40459. PubMed PMID: 22792336; PubMed Central PMCID: PMC3394708.
- Ueda S, Tu-Sekine B, Yamanoue M, et al. The expression of diacylglycerol kinase theta during the organogenesis of mouse embryos. BMC Dev Biol. 2013;13:35. PubMed PMID: 24079595; PubMed Central PMCID: PMC3850696.
- Ueda S, Kokaji Y, Simizu S, et al. Chicken heat shock protein HSPB1 increases and interacts with alphaB-crystallin in aged skeletal muscle. Biosci Biotechnol Biochem. 2015;79(11):1867–1875. PubMed PMID: 26139560.
- Migita K, Iiduka T, Tsukamoto K, et al. Retort beef aroma that gives preferable properties to canned beef products and its aroma components. Anim Sci J. 2017 Dec;88(12):2050–2056. PubMed PMID: 28752557.
- Bouhaddani SE, Houwing-Duistermaat J, Salo P, et al. Evaluation of O2PLS in Omics data integration. BMC Bioinformatics. 2016 Jan 20;17(Suppl 2):11. 10.1186/s12859-015-0854-z. PubMed PMID: 26822911; PubMed Central PMCID: PMCPMC4959391.
- Brasaemle DL, Subramanian V, Garcia A, et al. Perilipin A and the control of triacylglycerol metabolism. Mol Cell Biochem. 2009 Jun;326(1–2):15–21. PubMed PMID: WOS:000266043800004; English.
- Wiklund S, Johansson E, Sjostrom L, et al. Visualization of GC/TOF-MS-based metabolomics data for identification of biochemically interesting compounds using OPLS class models. Anal Chem. 2008 Jan 1;80(1):115–122. PubMed PMID: WOS:000252026900021; English.
- Koohmaraie M. The role of Ca(2+)-dependent proteases (calpains) in post mortem proteolysis and meat tenderness. Biochimie. 1992 Mar;74(3):239–245. PubMed PMID: 1610937.
- Kim S, Gonzalez R. Selective production of decanoic acid from iterative reversal of beta-oxidation pathway. Biotechnol Bioeng. 2018 May;115(5):1311–1320. . PubMed PMID: 29315475.
- Mannaerts GP, Van Veldhoven PP, Casteels M. Peroxisomal lipid degradation via beta- and alpha-oxidation in mammals. Cell Biochem Biophys. 2000;32:73–87. Spring. PubMed PMID: 11330072.
- Debbabi M, Zarrouk A, Bezine M, et al. Comparison of the effects of major fatty acids present in the Mediterranean diet (oleic acid, docosahexaenoic acid) and in hydrogenated oils (elaidic acid) on 7-ketocholesterol-induced oxiapoptophagy in microglial BV-2 cells. Chem Phys Lipids. 2017 Oct;207(Pt B):151–170. PubMed PMID: 28408132.
- Cerk IK, Wechselberger L, Oberer M. Adipose triglyceride lipase regulation: an overview. PubMed PMID: 28925902 Curr Protein Pept Sci. 2018;192:221–233.
- Engin A. Fat cell and fatty acid turnover in obesity. Adv Exp Med Biol. 2017;960:135–160. PubMed PMID: 28585198.
- Sasaki K, Motoyama M, Narita T, et al. Characterization and classification of Japanese consumer perceptions for beef tenderness using descriptive texture characteristics assessed by a trained sensory panel. Meat Sci. 2014 Feb;96(2 Pt A):994–1002. PubMed PMID: 24231677.
- Migita K, Takahama Y, Takahagi Y, et al. Analysis of aroma compounds of heated fats from wagyu beef and other cattle using headspace SPME. J Jpn Soc Food Sci. 2012;59(3):127–138. PubMed PMID: WOS:000301895800004; Japanese.