
ABSTRACT
We examined the effect of long-term exercise on the prevention of sarcopenia using a senescence-accelerated-prone mice (SAMP8) model. Mice were housed in a wheel cage for 25 weeks to increase voluntary exercise. At week 23, endurance running capacity was examined using a treadmill. In a treadmill running test, the wheel cage group had increased endurance running capacity, which suggests that aging-related loss of muscle function was recovered by long-term exercise. Mice were sacrificed and microarray analysis revealed that genes involved in protein synthesis and degradation were upregulated in the skeletal muscles of the wheel cage group, suggesting accelerated protein turnover. Total body and adipose tissue weights decreased following the use of the wheel cage. Thus, long-term, spontaneous physical exercise may assist in recovering from aging-related sarcopenia (loss of muscle function) and obesity.
Graphical Abstract
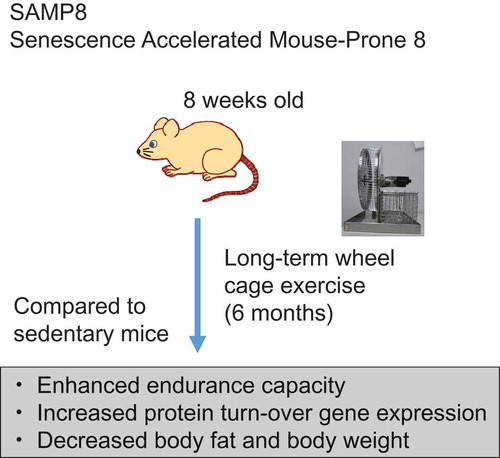
Aging-related sarcopenia was recovered by long-term exercise.
KEYWORDS:
Sarcopenia is an age-induced, progressive loss of skeletal muscle mass and function, accompanied by poor muscle performance. Skeletal muscle mass is critical for functions such as exercise, energy expenditure, and glucose metabolism. Thus, muscle loss is associated with diabetes and obesity and leads to decreased physical activity. In aging populations, which are increasing in many developed countries, the prevention and cure of sarcopenia are particularly important. Recently, the concept of sarcopenic obesity has been introduced, which is a combination of sarcopenia and obesity. The rapidly increasing prevalence and serious consequences of sarcopenic obesity present a critical public health problem in aging societies. Sarcopenia and obesity share several pathophysiological mechanisms and may potentiate each other [Citation1].
Exercise is crucial for an aging population to maintain or regain muscle mass and function. However, aging is a lengthy process, and it is difficult to observe the effect of continuous exercise on sarcopenia, especially in humans. Senescence-accelerated-prone 8 mouse (SAMP8) is a murine model that has accelerated senescence with a reduced life span [Citation2–Citation4]. Because SAMP8 mice show sarcopenia symptoms at 8 months (32 weeks) of age, they are useful for studying this condition [Citation5]. Here, we examined the effect of long-term exercise on the prevention of sarcopenia using SAMP8 mice.
Materials and methods
Animals and ethics statement
Male SAMP8 mice (SAMP8/Ta Slc) were purchased from Shimizu Co. (Kyoto, Japan) at 7 weeks of age. After allowing the mice to stabilize for a week, they were divided into two groups: sedentary (N = 8) and wheel cage (N = 8) groups. The mice were allowed ad libitum access to food (a standard laboratory diet, CE2, Clea, Tokyo, Japan) and water. They were maintained at a constant temperature of 24 °C with fixed artificial light (12-h light and 12-h dark cycle). Mice were euthanized at 32 weeks of age. The total body, adipose tissue, liver, and skeletal muscle (gastrocnemius, soleus, and tibialis anterior) weights were measured. Skeletal muscle samples were used for RNA analysis. All surgeries were performed under somnopentyl (Kyoritsu Seiyaku Corporation, Tokyo, Japan) anesthesia, and all efforts were made to minimize suffering. The mice were cared for in accordance with the National Institutes of Health (NIH) Guide for the Care and Use of Laboratory Animals and our institutional guidelines. All animal experiments were performed with the approval of the Institutional Animal Care and Use Committee of Kyoto Prefectural University (No. KPU260407).
Running wheel activity
Mice were individually housed in cages (9 × 22 × 9 cm) equipped with a running wheel (20-cm diameter, Shinano Co., Tokyo, Japan). Each wheel’s revolution number was recorded using a magnetic switch connected to a counter [Citation6]. Seven-week-old mice were divided into two groups after 1 week: sedentary (N = 8) and wheel cage (N = 8) groups. Two weeks after initiating the experiments, the daily revolution numbers of each wheel were recorded once a week.
Treadmill running test
Exercise capacity was determined based on an exercise tolerance test as previously described with slight modifications [Citation7]. The mice were subjected to a running test on a treadmill. They were challenged, starting at 10 m/min for 5 min, followed by an increase of 2 m/min every 2 min until reaching 20 m/min. Three hours after initiating treadmill running, the speed was increased by 2 m/min every 2 min until reaching 25 m/min. In total, treadmill running continued for 6 h or until the mice were exhausted, which was indicated by animals remaining on a shocker plate for more than 20 s.
cDNA microarray analysis
RNA was isolated from mice skeletal muscles (gastrocnemius). Samples from sedentary (N = 4) and wheel cage (N = 4) mice were used. Each sample was labeled with cyanine 3-CTP using a Low Input Quick Amp Labeling Kit (Agilent Technologies, Inc., Santa Clara, CA, USA) and hybridized to the Agilent whole mouse genome microarray (8 × 60), which contains 34,000 genes including expressed sequence tags. Signal detection and data analysis were performed in accordance with the manufacturer’s instructions [Citation8].
Quantitative real-time RT-PCR analysis
Total RNA was isolated from tissue and cell homogenates using TRIzol reagent (Thermo Fisher Scientific Inc., Tokyo, Japan). cDNA was synthesized from 500 ng of each RNA sample using the ReverTra Ace kit (Toyobo, Tokyo, Japan). Gene expression levels were measured as previously described [Citation8]. The primer sequences were Rpl6, Forward 5ʹ-ACTCCCGGAACTGTCCTGATC-3ʹ, Reverse 5ʹ-AGAGGCCCAGTCACAAGCAG-3ʹ; Akt1, Forward 5ʹ-GCCCAACACCTTTATCATCC-3ʹ, Reverse 5ʹ-GTCCATCGTCTCTTCTTCCTG-3ʹ; Atrogin1, Forward 5ʹ-TCGGCAAGTCTGTGCTGGT-3ʹ, Reverse 5ʹ-CCATCCGATACACCCACATGT-3ʹ; and MuRF1, Forward 5ʹ-GCTGGTGGAAAACATCATTGACAT-3ʹ, Reverse 5ʹ-CATCGGGTGGCTGCCTTT-3ʹ.
Statistical analyses
Statistical comparison was performed by Student’s t-test. P < 0.05 was considered significant and was indicated by *P < 0.05, **P < 0.01, and ***P < 0.001.
Results and discussion
We used SAMP8 to examine the effect of spontaneous locomotive activity (keeping mice in a wheel cage). As shown in ), the wheel revolution number significantly decreased at week 5 after wheel cage entry (12 weeks of age) when compared with the first time recorded (2nd week after wheel cage entry). The wheel revolution number remained constant until approximately week 17 after wheel cage entry (24 weeks of age) and decreased afterwards. At week 23 after the experiment start (30 weeks of age), a treadmill running test was performed (described below), and each wheel’s revolution number further decreased.
Figure 1. Wheel revolution number and body weight change. a) Wheel revolution number every 24 h measured once a week. The horizontal axis shows the period after wheel cage entry (weeks) and the age of the mice (weeks). Asterisk indicates a comparison of the wheel revolution number between week 2 after wheel cage entry (9 weeks of age) and the indicated time points. Each value represents the mean ± SE (N = 7). ***P < 0.001, **P < 0.01, *P < 0.05. b) Body weight was measured at 7 weeks of age with similar values for both groups. After 14 weeks of age (7 weeks after experiment start), body weights were recorded weekly. Open circle, sedentary group; filled circle, wheel cage group. Statistical differences between the sedentary and wheel cage groups at each time point are shown. Each value represents the mean ± SE (N = 6 for the sedentary group, N = 7 for the wheel cage group). ***P < 0.001, **P < 0.01, *P < 0.05.
In the sedentary group, body weight gradually increased until week 13 of the experiment (20 weeks of age) after which it was maintained. After performing the treadmill running test, body weight decreased ()). In the wheel cage group, body weight was significantly lower at week 7 after the experiment start (14 weeks of age) compared with that of the sedentary group. From 14 to 32 weeks of age, body weight did not change markedly. Thus, spontaneous exercise (wheel cage group) suppressed the body weight increase observed in the sedentary group.
A treadmill running test was performed to determine if endurance running capacity increased by spontaneous exercise (wheel cage). In the sedentary group, all mice were exhausted and stopped running during the experimental time (6 h). In the wheel cage group, three of seven mice continued running until the end of the experiment (6 h). The mean running times were 159 ± 31 min for the sedentary group and 320 ± 21 min for the wheel cage group ()). Thus, continuous running time on the treadmill increased about 2-fold. The mean running distance was 3150 ± 668 m for the sedentary group and 6978 ± 522 m for the wheel cage group (increased approximately 2.2-fold) ()). These data show that long periods of spontaneous exercise (e.g., using the wheel cage) markedly increased the endurance running capacity of mice (assessed by treadmill running capacity).
Figure 2. Treadmill running test. a) Time of continuous running, and b) distance of continuous running. Mice were challenged with treadmill running for 6 h or until exhaustion. Open bar, sedentary group; filled bar, wheel cage group. Each value represents the mean ± SE (N = 6 for the sedentary group, N = 7 for the wheel cage group). ***P < 0.001, **P < 0.01.
At 32 weeks of age (25 weeks after the beginning of the experiment and 2 weeks after treadmill running start), mice were sacrificed. Total body, adipose tissue, liver, and skeletal muscle (gastrocnemius, soleus, and tibialis anterior) weights were measured (). The mean body weight at the time of sacrifice was 33.3 ± 0.78 g for the sedentary group and significantly lower (29.9 ± 0.53 g) for the wheel cage group. Adipose tissue (epididymal white adipose tissue) weight was 0.50 ± 0.056 g for the sedentary group and markedly lower (0.14 ± 0.026 g) for the wheel cage group. Liver weight did not differ between groups. For skeletal muscle, gastrocnemius weight did not differ between the sedentary and wheel cage groups, but soleus and tibialis anterior weights were significantly higher in the latter group. Thus, the suppressed body weight increase observed in the wheel cage group compared with that of the sedentary group was likely related to decreased adipose tissue weight. In turn, skeletal muscle weight, such as that from the soleus and tibialis anterior, increased by spontaneous exercise.
Figure 3. Body and tissue weight. Total body, adipose tissue, liver, and skeletal muscle (gastrocnemius, soleus, and tibialis anterior) weights are shown. Open bar, sedentary group; filled bar, wheel cage group. Each value represents the mean ± SE (N = 6 for the sedentary group, N = 7 for the wheel cage group). ***P < 0.001, **P < 0.01, *P < 0.05.
The gastrocnemius and soleus are located in the posterior (back) compartment of the leg. The tibialis anterior muscle is located in the anterior (front) compartment of the leg. The soleus, which has more red muscle fibers (type I), is the primary active muscle when standing still. The gastrocnemius and tibialis anterior contain both red and white (type II) fibers, which are involved in running and to a lesser degree in standing [Citation9]. We used these three skeletal muscles, which form the major part of the lower leg muscles. Declined muscle mass and contractility are observed in 60-week-old SAMP8 mice, which is more pronounced in the soleus than in the extensor digitorum longus muscle [Citation3]. We observed an increase in skeletal muscle within the soleus and tibialis anterior, but not in the gastrocnemius, which may result from differences in muscles affected by aging and atrophy. Alternatively, wheel running might differentially affect each muscle. For example, the soleus and tibialis anterior are more effective for wheel cage running, whereas swimming may have different effects on these muscles. Anyway, to discuss the whole-body muscle content, analysis such as using dual-energy X-ray absorptiometry is required, which is not performed in this study. Thus, exact interpretation of whole body muscle weight by wheel cage running is difficult. This remains for future analysis.
To get further insight into the effect of wheel cage exercise on skeletal muscles, a microarray analysis was performed. We analyzed gene expression levels in the gastrocnemius, a largest muscle among we used in this study (soleus, tibialis anterior, and gastrocnemius). After microarray analysis, we compared representative gene expression changes using real-time qPCR in both the gastrocnemius and soleus. The list of genes with more than 1.5-fold increased expression in the skeletal muscle (gastrocnemius) of the wheel cage group compared with that of sedentary group is shown in . We observed increased gene expression of several ribosomal proteins [Citation10], which suggests an increase in protein synthesis in the skeletal muscle of the wheel cage group. Akt1, which is downstream kinase of insulin anabolism [Citation11], and myosin and actin, muscle protein components, were upregulated in the wheel cage group. In addition, expression of Fbox32 (atrogin 1), a ubiquitin ligase involved in proteolysis [Citation12], was increased. We confirmed the expression of several genes through quantitative real-time PCR analysis (), which was similar to the results of the microarray. Under nutrient-deficient conditions (starvation), muscle proteins are degraded and amino acids are used as energy sources [Citation13]. Continuous exercising in the wheel cage would increase daily energy expenditure. Therefore, a decreased nutritional condition caused by continuous exercising may lead to protein degradation and an increase in atrogin-1 expression (). Indeed, the mRNA levels of MURF1, another gene with a role in proteolysis [Citation12], were marginally increased (). Alternatively, vigorous exercising may lead to skeletal muscle damage, and to repair this muscle damage, protein degradation and construction may increase. Thus, spontaneous wheel cage exercise appeared to increase both protein synthesis and degradation and stimulate protein turnover in skeletal muscle.
Table 1. List of genes, increased in skeletal muscle (gastrocnemius) of wheel cage group compared with sedentary group.
Figure 4. Gene expression in skeletal muscle. Expression of representative genes tested using microarray analysis was measured by quantitative real-time PCR. Rpl6, ribosomal protein L6. Open bar, sedentary group; filled bar, wheel cage group. Each value represents the mean ± SE (N = 6 for the sedentary group, N = 7 for the wheel cage group). **P < 0.01, *P < 0.05.
Sanchez-Roige et al. have previously reported caging of 3-month-old SAMP8 (and SAMR1) mice in wheel cages until 9 months of age [Citation14]. Several behavioral tests, including sensorimotor tasks (visual placing reflex, balance, and prehensile reflex), exploratory activity in the hole-board test (number of line crossing and head dips), and home cage motor activity, were assessed. No significant differences were observed in male SAMP8 mice between the sedentary and the wheel cage group. For female mice, home cage activity, measured individually by the distance traveled in the cage across a day, significantly increased in the wheel cage group compared with that of the sedentary group. Gene expression in skeletal muscles of female SAMP8 mice was also analyzed. The mRNA levels of PGC-1α, Sirt1, VEGFa, Glut4, and CD36 and the protein levels of PGC-1α and AMPK increased in the wheel cage group compared with those of the sedentary group. No phenotypic differences were observed between the male wheel cage and sedentary groups [Citation14]. Male SAMP8 mice were used in the current study. In male SAMP8 samples, no changes in the gene expression levels of PGC-1α, Sirt1, VEGFa, Glut4, and CD36 were observed between the sedentary and wheel cage groups (data not shown). A marked increase in the running performance was observed using the treadmill experiment.
SAMR1 is usually used as a “control” for SAMP8 mice, especially for analyzing aging brain function such as the Alzheimer’s disease phenotype. The body size and weight (i.e., fat and muscle weight) of SAMR1 is much larger than that of SAMP8 [Citation15]. Therefore, SAMR1 was not included because we focused on muscle function and not cognitive functions. Thus, no aging control was used. Unfortunately, we do not know whether the phenotype observed in this study is SAMP8-specific, and further studies using different mice strains or aged mice are needed to clarify this point.
Using SAMP8, a sarcopenia mice model, we examined the effect of long-term spontaneous exercise in an aging population. Wheel cage exercise increased the endurance running capacity, likely reflecting increased skeletal muscle function. Also, wheel cage exercise suppressed body weight increase, possibly through decreased adipose tissue weight. Thus, exercise prevented sarcopenia and sarcopenic obesity. Further analyses of the beneficial effects of exercise to prevent sarcopenia are warranted including molecular studies of genes showing altered expression in the skeletal muscle.
Author contributions
Kaho Takigawa, Rintaro Matsuda and Ran Uchitomi, performed mouse experiment and analyzed the data. Takumi Onishi and Yukino Hatazawa, collected the data, undertook the statistical analyses. Yasutomi Kamei prepared the manuscript. All authors reviewed the results and approved the final version of the manuscript.
Acknowledgments
Microarray data analysis was, in part, performed at the Medical Research Support Center, Graduate School of Medicine, Kyoto University. This study was supported by grants-in-aid for scientific research (KAKENHI) from the Japanese Ministry of Education, Culture, Sports, Science, and Technology (MEXT, Tokyo). This study was also supported by the Council for Science, Technology, and Innovation (CSTI), Cross-ministerial Strategic Innovation Promotion Program (SIP), and “Technologies for creating next-generation agriculture, forestry and fisheries” (funding agency: Bio-oriented Technology Research Advancement Institution, NARO). This study was also supported by The Public Foundation of Elizabeth Arnold-Fuji and Japan Dairy Association (J-milk). The funders had no role in study design, data collection and analysis, decision to publish, and preparation of the manuscript.
Disclosure statement
No potential conflict of interest was reported by the authors.
Additional information
Funding
References
- Choi KM. Sarcopenia and sarcopenic obesity. Korean J Intern Med. 2016;31:1054–1060.
- Miyamoto M. Characteristics of age-related behavioral changes in senescence-accelerated mouse SAMP8 and SAMP10. Exp Gerontol. 1997;32:139–148.
- Derave W, Eijnde BO, Ramaekers M, et al. Soleus muscles of SAMP8 mice provide an accelerated model of skeletal muscle senescence. Exp Gerontol. 2005;40:562–572.
- Onishi S, Ishino M, Kitazawa H, et al. Green tea extracts ameliorate high-fat diet-induced muscle atrophy in senescence-accelerated mouse prone-8 mice. PloS One. 2018;13:e0195753.
- Guo AY, Leung KS, Siu PM, et al. Muscle mass, structural and functional investigations of senescence-accelerated mouse P8 (SAMP8). Exp Anim. 2015;64:425–433.
- Kamei Y, Miura S, Suzuki M, et al. Skeletal muscle FOXO1 (FKHR) transgenic mice have less skeletal muscle mass, down-regulated Type I (slow twitch/red muscle) fiber genes, and impaired glycemic control. J Biol Chem. 2004;279:41114–41123.
- Tadaishi M, Miura S, Kai Y, et al. Skeletal muscle-specific expression of PGC-1alpha-b, an exercise-responsive isoform, increases exercise capacity and peak oxygen uptake. PloS One. 2011;6:e28290.
- Hatazawa Y, Ono Y, Hirose Y, et al. Reduced Dnmt3a increases Gdf5 expression with suppressed satellite cell differentiation and impaired skeletal muscle regeneration. Faseb J. 2018;32:1452–1467.
- Wang LC, Kernell D. Fibre type regionalisation in lower hindlimb muscles of rabbit, rat and mouse: a comparative study. J Anat. 2001;199:631–643.
- Zaman GJ. Sequence of a cDNA encoding human ribosomal protein L26 and of a cDNA probably encoding human ribosomal protein L6. Nucleic Acids Res. 1993;21:1673.
- Gonzalez E, McGraw TE. The Akt kinases: isoform specificity in metabolism and cancer. Cell Cycle. 2009;8:2502–2508.
- Bodine SC, Baehr LM. Skeletal muscle atrophy and the E3 ubiquitin ligases MuRF1 and MAFbx/atrogin-1. Am J Physiol Endocrinol Metab. 2014;307:E469–484.
- Salway JG. Metabolism at a glance. Oxford: Blackwell Science Ltd; 1999.
- Sanchez-Roige S, Lalanza JF, Alvarez-Lopez MJ, et al. Long-term wheel running changes on sensorimotor activity and skeletal muscle in male and female mice of accelerated senescence. Age (Dordr). 2014;36:9697.
- Chan YC, Wu CC, Chan KC, et al. Nanonized black soybean enhances immune response in senescence-accelerated mice. Int J Nanomedicine. 2009;4:27–35.