
ABSTRACT
Ellagic acid has been shown to improve cholesterol metabolism in animal studies, but the molecular mechanisms underlying this function have not been fully understood. We performed DNA microarray analysis to elucidate the effects of ellagic acid on cholesterol metabolism in HepG2 hepatocytes. This revealed that the expression levels of several genes related to cholesterol metabolism, including the low-density lipoprotein receptor (LDLR), were changed by ellagic acid treatment. Using a real-time PCR and immunoblot we confirmed that ellagic acid treatment up-regulated mRNA and protein expression level of the LDLR. Moreover, In the presence of 25 μM ellagic acid, extracellular apoB protein and MTP mRNA levels were significantly decreased. These findings indicate that ellagic acid improves cholesterol metabolism through the up-regulation of LDLR, down-regulation of MTP mRNA and reduces extracellular apoB levels. The ellagic acid-induced up-regulation of LDLR occurred via the extracellular signal-regulated kinase (ERK) signaling pathway in HepG2 hepatocytes.
Abbreviations: LDLR: low-density lipoprotein receptor; apoB: apolipoprotein B; PKC: diacylglycerol-protein kinase C; MAPK: mitogen-activated protein kinase; ERK: p42/44 extracellular signal-regulated kinase; JNK: c-Jun N-terminal kinase; VLDLR: very low density lipoprotein receptor; PPARδ: peroxisome proliferator-activated receptor δ; SREBPs: sterol regulatory element-binding proteins; MTP: microsomal triacylglycerol transfer protein; LPDS: lipoprotein-deficient serum
Graphical abstract
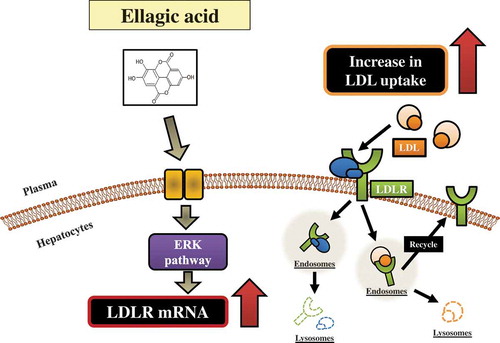
Ellagic acid induces an up-regulation of LDL receptor via the extracellular signal-regulated kinase (ERK) signaling pathway in HepG2 hepatocytes.
Hypercholesterolemia is a serious risk factor of cardiovascular disease: it is one of the leading causes of death worldwide [Citation1,Citation2]. Especially, an increase of the low density lipoprotein (LDL) cholesterol levels in plasma leads to hypercholesterolemia and atherosclerosis. Several efforts have been made to solve the problem by developing good reformative theories and technologies for improving the cholesterol metabolism. Part of their efforts focuses on dietary control, an important strategy for preventing and improving hypercholesterolemia [Citation3].
Table 1. Changes in gene expression of cholesterol metabolic process in HepG2 cells treated with 25 μM ellagic acid relative to the vehicle-control.
Current epidemiological [Citation4,Citation5] and experimental studies support a beneficial role of dietary polyphenols in cardiovascular and gastrointestinal diseases including metabolic syndrome [Citation6–Citation8]. Ellagic acid has variety properties, including anti-oxidant [Citation9], anti-cancer [Citation10], anti-diabetic [Citation11,Citation12] and anti-atherogenic properties [Citation11,Citation12], as well as protective effects against liver injury [Citation13]. Moreover, long-term intake of ellagic acid reduces diet-induced obesity in mice [Citation12]. Animal studies have shown that ellagic acid loweres plasma cholesterol accompanied by a decrease in non-HDL-cholesterol [Citation11,Citation12]. Furthermore, it is reported that ellagic acid directly influence lipid metabolism in 3T3-L1 adipocytes [Citation14]. There is very little information about the effect of ellagic acid on triacylglycerol and cholesterol metabolism in hepatocytes [Citation15]. Therefore, it appears that the molecular mechanisms underlying the plasma cholestrol-lowering effect of ellagic acid is not fully understood.
In the present study, we performed DNA microarray analysis using HepG2 cells treated with ellagic acid to elucidate the effects of ellagic acid on hepatic cholesterol metabolism because the studies about the effects of ellagic acid on cholesterol metabolism in HepG2 cells have been very limited and no exhaustive transcriptome analysis has been performed. We demonstrated that ellagic acid treatment up-regulated mRNA expression of the low-density lipoprotein receptor (LDLR), decreased microsomal triacylglycerol transfer protein (MTP) mRNA and extracellular apolipoprotein (apoB) levels.
Experimental methods
Materials
Unless otherwise indicated, all chemicals were purchased from Sigma (MO, USA) or Wako (Osaka, Japan) and were guaranteed to be reagent or tissue culture grade.
Cell culture and chemical treatments
The human hepatoblastoma cell line, HepG2, (from American Type Culture Collection, Manassas, VA) was generated as previously described [Citation16]. Cells were incubated for 48 h in Dullbecco’s Modified Eagle’s Medium (DMEM) (MP Biomedicals Japan, Tokyo, Japan) containing 10% charcoal/dextran-treated FBS, 100 U/mL penicillin, 100 μg/mL streptomycin and 10 mM Non-Essential Amino Acids solution (Invitrogen, CA, USA). Then, cells were incubated 24 h in DMEM containing 100 U/mL penicillin, 100 μg/mL streptomycin and 10mM Non-Essential Amino Acids solution with and without ellagic acid. After incubation for 24 h, the cells were harvested for RNA preparation.
For the analysis of MAPK inhibitors, HepG2 cells were exposed to 30 μM SP600125, 30 μM SB203580 or 0.5 μM U0126 as described previously [Citation6,Citation17].
RNA preparation and real-time fluorescence monitoring RT-PCR
RNA preparation and real-time PCR were performed as described previously [Citation16]. The expression levels of LDLR was standardized against β-actin. Oligonucleotide primer sets and TaqMan® probes for the human LDLR, MTP and β-actin used in this study were as previously described [Citation16].
DNA microarray analysis
RNA samples isolated from HepG2 cells were labeled using the Low RNA Input Linear Amplification Kit (Agilent Technologies, CA, USA) in accordance with the manufacturer’s instructions. Briefly, 500 ng of total RNA was amplified and reverse-transcribed in vitro into cDNA using MMLV reverse transcriptase (MMLV-RT) and subsequently into cRNA labeled with cyanine 3-labeled CTP using T7 RNA polymerase. After purification of the cRNA using RNeasy Mini Kit, a Nanodrop ND-1000 spectrophotometer was used to monitor the yield of the Cy3 labeled cRNA, from the experimental samples (500 ng), the yield was found to be between 9 and 22 pmol/μL. Targets consisting of amplified and fluorescent-labeled cRNA were hybridized using the Agilent Gene Expression Hybridization Kit (Agilent Technologies) by following the manufacturer’s protocols. In short, 1650 ng of cRNA was fragmented for 30 min at 60°C in the dark and hybridized onto Agilent Technologies 44k (G4112F) whole human genome 60mer oligonucleotide arrays in a rotation oven (65°C, 17 h, 10 rpm in the dark). Following hybridization, the chambers were disassembled and the slides sequentially washed in Gene Expression Wash Buffer 1, and 2 (Agilent Technologies) and air-dried. The slides were then scanned using an ArrayScan (Agilent Technologies). Spot identification and quantification was performed with Agilent Feature Extraction software (Agilent Technologies). The data were analyzed using GeneSpring GX 11.5 Expression Analysis Software (Agilent Technologies).
Measurement of extracellular Apo B levels
The level of apoB secreted into the medium was determined using an enzyme-linked immunosorbent assay (ELISA). Briefly, the media (100 μL) were added to the ELISA plate (Thermo Fisher Scientific), and incubated for 18 h at 4°C. After the blocking with BSA, mouse anti-human apoB antibodies (Millipore, MA, USA), goat anti-mouse IgG (Sigma) and HRP conjugate antibodies were used for the immunodetection of apoB. The apoB secretion level was normalized to cellular protein content as determined by the Bradford method (Bio-Rad Laboratories, CA, USA).
Western blotting
HepG2 cells were set up and treated as described in the figure legends. After treatment, cells were washed twice with ice-cold phosphate-buffered saline (PBS) and lysed with 100 μL of NUN buffer [Citation18] containing 0.33 M NaCl, 1.1 M urea, 1% Nonidet P-40, 25 mM HEPES (pH 7.6), and proteinase inhibitors (Roche) by direct addition onto the plate. Cell lysates were collected and cleared by centrifugation at 20,000 × g for 15 min at 4°C. The supernatants were collected as whole-cell lysates. The cell lysates (5 or 20 μL) were separated by 8% SDS-PAGE and then transferred to a polyvinylidene difluoride (PVDF) membrane (Millipore). After blocking, the membranes were incubated with the following specific antibodies: anti-LDLR (Abcam, ab14056) and anti-β-actin (Santa Cruz, sc-47778). Immunoblot analyses were performed using an ImmunoStar® LD system (Wako).
Transient transfections and luciferase assay
A reporter plasmid for LDLR was gifted from Osaka University [Citation19]. HepG2 cells were transfected with 1.5 µg of human LDLR-Luc plasmid (pGL4.10-Luc) containing the promoter region (–4,000 to +57 bp) of the human LDLR gene and with 0.5 µg pPGK β-galactosidase plasmid as an internal control. Transfection was allowed to proceed for 5 h in serum-free Opti-MEM I (Life Technologies), using Lipofectin reagent (Life Technologies). After transfection, cells were incubated with 25 μM ellagic acid for 12h. The cells were then lysed with reporter lysis buffer (Promega). Luciferase activity was measured using a luciferase assay system (Promega) and a Fluoroskan Ascent FL instrument (Labsystems) according to the manufacturers’ instructions. β-Galactosidase activity was measured using a β-galactosidase enzyme-linked immunosorbent assay (ELISA) kit (Promega) and was normalized to the luciferase activity.
LDLR mRNA stability assays
HepG2 cells were incubated for 48 h in DMEM containing 10% charcoal/dextran-treated FBS, 100 U/mL penicillin, 100 μg/mL streptomycin and 10 mM Non-Essential Amino Acids solution. Then, cells were incubated 23.5 h in DMEM containing 10% LPDS, 100 U/mL penicillin, 100 μg/mL streptomycin and 10 mM Non-Essential Amino Acids solution. Then, after preincubation with actinomycin D (5 μg/ml) for 30 min, cells were untreated or treated with 25 μM ellagic acid for the indicated time up to 4 h. Total RNA was isolated at the indicated time and analyzed for the amount of LDLR and β-actin mRNA by a real-time PCR as described previously with modifications [Citation17].
Statistical analysis
The results were expressed in terms of mean±SEM. The statistical significance of differences was evaluated using the Student’s t-test [Citation20] for the data acquired from DNA microarray or ANOVA and Tukey-Kramer test [Citation21] for the data from quantitative PCR and apoB ELISA. Differences were considered significant when P < 0.05.
Results
DNA microarray analysis
To comprehensively investigate the effects of ellagic acid on hepatic cholesterol metabolism, we performed DNA microarray analysis using HepG2 cells treated with 25 μM ellagic acid (). We selected 24,128 expressed probe sets by screening based on the expression and flag analysis. Among these probe sets, we identified 3,324 differentially expressed transcripts with a ± 1.2-fold difference in expression. As shown in the table, the expression levels of 12 genes categorized in sterol metabolic process were changed by ellagic acid treatment, suggesting that ellagic acid directly affects cholesterol metabolism in hepatocytes. In particular, the level of expression of the LDLR was strongly up-regulated (2.0-fold) by ellagic acid. The LDLR is an integral plasma membrane glycoprotein that is expressed in all cell types but found most abundantly in the liver, and it is important for mediating cellular LDL uptake [Citation22]. Thus, in this study, we focused on investigating the effect of ellagic acid on LDLR expression, and real-time PCR was carried out to confirm the effect of ellagic acid on mRNA expression levels of the LDLR.
Expression levels of LDLR mRNA or MTP mRNA in HepG2 cells
As expected, the addition of 10 and 25 μM of ellagic acid increased the level of mRNA expression of the LDLR 1.7- and 1.7- fold respectively ()). MTP mRNA levels were significantly decreased by the 25 μM of ellagic acid treatment ()). These results indicated that, in hepatocytes, ellagic acid improves cholesterol metabolism through up-regulation of the LDL receptor followed by an increase of cellular uptake of LDL.
Figure 1. Effects of the addition of ellagic acid on the level of LDL receptor or MTP mRNA expression and extracellular apoB levels in HepG2 cells.
Total RNA and medium were harvested from HepG2 cells treated with vehicle control, 10 or 25 μM ellagic acid for 24 h. The level of LDL receptor or MTP mRNA expression was measured using real-time monitoring RT-PCR, and normalized to the mRNA expression level of the β-actin gene (a, b). The extracellular apoB level was measured using an ELISA and normalized to cellular protein content (c). The results are shown as the mean ± SEM (n = 6). Mean values with unlike letters were significantly different (P < 0.05; Tukey-Kramer test).
Apolipoprotein B level in HepG2 cells
We assessed the effect of ellagic acid on extracellular apoB protein levels. ApoB is the major apolipoprotein in LDL, present as a single copy per lipoprotein particle [Citation23]. With the addition of ellagic acid, extracellular apoB protein levels were significantly decreased ()). In the presence of 10 μM or 25 μM ellagic acid, extracellular apoB protein levels were significantly decreased by 85% or 87%.
Expression levels of LDLR protein levels in HepG2 cells
We also measured the effects of 25 μM ellagic acid on LDLR protein level. LDLR protein level was significantly increased by the 25 μM of ellagic acid treatment reflecting changes in LDLR mRNA levels ().
Figure 2. Ellagic acid induced an up-regulation of LDLR protein level in HepG2 cells.
After HepG2 cells were treated with vehicle control or 25 μM ellagic acid for 24 h, cell lysates and medium were collected. (a) LDLR protein levels were analyzed by western blotting. (b) Summary of LDLR protein levels which normalized to the level of β-actin.The results are shown as the mean ± SEM (n = 6). Mean values with unlike letters were significantly different (* P < 0.05; Student’s t-test).
Ellagic acid induced an increase in the LDLR mRNA level via the ERK signaling pathway without activating LDLR gene transcription in HepG2 cells
To investigate whether ellagic acid induces an activation of LDLR transcription in a luciferase assay, HepG2 cells transfected with a luciferase plasmid containing the human LDLR gene promoter region was treated with ellagic acid for 12 h. The results showed that ellagic acid treatment for 12 h did not cause a significant change in the luciferase activity ()). In addition, to investigate whether other signaling pathways are also involved in the action of ellagic acid, HepG2 cells were treated with ellagic acid for 24 h in the absence or presence of inhibitors of different MAPK signaling pathways, including the JNK pathway inhibitor SP600125, the ERK pathway inhibitor U0126, and the p38 MAPK pathway inhibitor SB203580. The results showed that the ellagic acid-induced increase of LDLR mRNA expression was specifically inhibited when HepG2 cells were pretreated with the ERK pathway inhibitor U0126 ()). In contrast, treatment with SP600125 or SB203580 did not affect the ellagic acid-induced LDLR mRNA up-regulation in HepG2 cells (,)).
Figure 3. Ellagic acid induced an increase in the LDLR mRNA level via the ERK signaling pathway.
(a) HepG2 cells were transfected with human LDLR-Luc plasmid (pGL4.10-Luc), using the pPGK β-galactosidase plasmid as an internal control. After transfection, the cells were treated with 25 μM ellagic acid for 12 h. Data are presented as luciferase activity normalised to β-galactosidase activity. (b) HepG2 cells were pretreated with 30 µM SP600125 for 3 h, then the cells were treated with vehicle control or 25 μM ellagic acid for 24 h. (c, d) HepG2 cells were incubated in FBS-free medium with or without compounds. Total RNA was collected from HepG2 cells treated (c) with vehicle control, 25 μM ellagic acid, 0.5 µM U0126, or 25 μM ellagic acid and 0.5µM U0126 for 24 h, (d) with vehicle control, 25 μM ellagic acid, 30µM SB203580, or 25 μM ellagic acid and 30 µM SB203580 for 24 h. Relative mRNA levels were determined by real-time PCR and normalized to the mRNA expression level of the β-actin RNA level. Values are means, with their standard errors (n = 6). Different superscripts indicate significantly different values (P < 0.05) by Tukey-Kramer test.
Ellagic acid prolongs the half-life of LDLR mRNA
We examine whether ellagic acid stabilizes LDLR mRNA, thereby inducing the mRNA levels. HepG2 cells were preincubated with actinomycin D for 30 min and then further treated with or without ellagic acid for the indicated period. As shown in , the turnover rate of LDLR mRNA was prolonged by ellagic acid from T1/2 = 1.39 h to T1/2 = 1.71 h.
Figure 4. Effects of ellagic acid on stability of LDLR mRNA.
HepG2 cells were incubated with a DMEM containing 10% LPDS for 23.5 h as described in Experimental methods. After preincubation with actinomycin D (5 μg/ml) for 30min, cells were untreated or treated with 25 μM ellagic acid for the indicated time up to 4 h. Total RNA was isolated at the indicated time and analyzed for the amount of LDLR and β-actin mRNA by a real-time PCR. The normalized LDLR mRNA levels were plotted as the percentage of the LDLR mRNA remaining. Decay curves were plotted versus time.
Discussion
DNA microarray analysis revealed that the expression levels of several genes related to cholesterol metabolism were changed through ellagic acid treatment. Of these genes, the LDLR mRNA was strongly upregulated. The regulation of hepatic LDLR expression has been extensively studied using HepG2 cells [Citation24]. LDLR levels are suppressed in response to cholesterol and lipoprotein loading [Citation25]. We will measure a surface LDL receptor activity using a fluorescent LDL uptake cell-based assay to clarify the detailed mechanism of LDLR activation by ellagic acid in our future study [Citation6]. However, LDLR expression is also regulated through several signal transduction pathways in HepG2 cells, including the cyclic AMP, PKC and MAPK pathways [Citation26–Citation28]. In our present LDLR promoter assay as shown in , ellagic acid did not activate the LDLR promoter sequence (−4000 to +57 bp). Also, as shown in , the turnover rate of LDLR mRNA was prolonged by ellagic acid from T1/2 = 1.39 h to T1/2 = 1.71 h. Thus, ellagic acid may be enhancing LDLR mRNA stability but not activating its transcription. Several recent studies have shown that the 3ʹ untranslated region of LDLR mRNA is important for its stabilization and this stabilization is mediated through the activation of the ERK [Citation29] or the JNK signaling pathway [Citation30]. In the present study, ellagic acid activates ERK pathway in HepG2 cells. While, the up-regulation of LDLR mRNA induced by the EGCG treatment is also mediated through the activation of ERK signaling pathways in HepG2 cells [Citation6,Citation31]. Thus, interestingly, there are some common mechanisms involved in the up-regulation of LDLR induced by ellagic acid and EGCG. Further studies are essential to elucidate in detailed the common mechanisms involved in the LDLR up-regulation induced by ellagic acid and EGCG via the ERK pathway. Also, we need to measure phosphorylation protein with MAPK (p38 etc), JNK1/2, ERK 1/2 by ellagic acid in our future study.
In this study, extracellular apoB protein levels significantly decreased with the addition of ellagic acid similar to the changes in LDLR mRNA expression levels. Animal studies have shown that ellagic acid lowers plasma cholesterol accompanied by a decrease in non-HDL-cholesterol [Citation11,Citation12] and up-regulation of LDLR mRNA in mice. These finding are similar to our present results of the up-regulation of LDLR in HepG2 cells. Other than LDLR, the expression levels of several genes related to cholesterol metabolism, such as VLDLR and PPARδ, were upregulated by 25 μM ellagic acid treatment. The VLDLR is a member of the LDLR family. Unlike the LDLR, the VLDLR is not regulated by cellular sterols and does not efficiently bind to LDLs. Rather it contributes to the delivery of fatty acids, which are derived from triglyceride-rich lipoproteins to peripheral tissues. It binds to apolipoprotein E–enriched chylomicrons and VLDLs, intermediate density lipoproteins, and lipoprotein lipase [Citation32]. PPARδ belongs to the nuclear hormone receptor superfamily, which comprises a large group of ligand-dependent transcription factors. Interestingly, it has been reported that PPARδ activator lowers serum LDL cholesterol [Citation33]. Because these genes are closely related to the cellular lipid metabolism, not only modulation of LDLR but also the changes of the expression levels of these genes might be important for the apoB lowering effect of ellagic acid. We will measure the MTP mRNA expression and ApoB levels using SP600125, U0126 and SB203580 to clarify the detailed cellular lipid metabolism by ellagic acid in our future study.
Several genes encoding enzymes in cholesterol biosynthetic pathway (3-hydroxy-3-methylglutaryl coenzyme A synthase 1, Mevalonate (diphospho) decarboxylase, cytochrome P450, family 51, subfamily A, polypeptide 1 (CYP51A1) and 7-dehydrocholesterol reductase) were also up-regulated by ellagic acid. The expression levels of almost all of these genes were reported to be regulated by a family of transcription factors, sterol regulatory element-binding proteins (SREBPs) [Citation34] which act as transcription factors under the condition of cholesterol starvation [Citation35]. Thus, ellagic acid treatment might reduce intracellular cholesterol level followed by the up-regulation of the expression levels of genes related to cholesterol uptake and cholesterol biosynthesis.
We need to determine the cellular cholesterol level by an ellagic acid treatment in the future.
In this study, we investigated the effects of ellagic acid in HepG2 cells at the concentration of 10 and 25 μM because ellagic acid has been used in the experiment using cultured hepatocytes in this concentration range [Citation15]. These concentrations are considerably high taking into consideration the absorbability of ellagic acid as shown in animal studies [Citation36]. Navindra et al. have shown that ellagic acid concentration in plasma reaches 0.1 μM 60 min after oral administration of a single dose of pomegranate juice containing 25 mg ellagic acid. Similar difference in the effective concentration between plasma and cultured hepatocytes are seen in the case of insulin [Citation37]. Because the environment of cultured hepatocytes does not completely reflect that of hepatocytes in vivo, future studies on the effects of ellagic acid treatment on gene expression in the liver done using animal models are going to be important.
In conclusion, the present study indicates that ellagic acid improves cholesterol metabolism through up-regulation of LDL receptor. Moreover, ellagic acid decreased MTP mRNA and extracellular apoB levels. The importance of hepatic LDLRs in systemic cholesterol excretion is exemplified by patients suffering from familial hypercholesterolemia, an autosomal dominant disorder whereby one or both LDLR alleles do not encode functional receptors [Citation38]. Therefore, the up-regulation of LDLR protein and mRNA induced by ellagic acid may contribute to the cholesterol-lowering effect of ellagic acid.
Author contributions
S Kubota, Y Tanaka and S Nagaoka performed the experiments. S Nagaoka designed the experiments and wrote the paper.
Acknowledgments
This work was supported in part by a Grant-in-Aid for Scientific Research from the Japanese Ministry of Education, Culture, Sports, Science and Technology to Satoshi Nagaoka.
Disclosure statement
No potential conflict of interest was reported by the authors.
References
- Kannel WB, Castelli WP, Gordon T, et al. Serum cholesterol, lipoprotein, and the risk of coronary heart disease: the Framingham Study. Ann Int Med. 1971;74:1–12.
- Martin MJ, Hulley SB, Browner WS, et al. Serum cholesterol, blood pressure, and mortality: implications from a cohort of 361, 662 men. Lancet. 1986;328:933–936.
- Ginsberg HN, Barr SL, Gilbert A, et al. Reduction of plasma cholesterol levels in normal men on an American Heart Association Step 1 diet or a Step 1 diet with added monounsaturated fat. N. Engl J Med. 1990;322:574–579.
- WU AH, Spicer D, Stanczyk FZ, et al. Effect of 2-month controlled green tea intervention on lipoprotein cholesterol, glucose, and hormone levels in healthy postmenopausal women. Cancer Prev Res. 2012;5:393–402.
- Mukhtar H, Ahmad N. Tea polyphenols: prevention of cancer and optimizing health. Am J Clin Nutr. 2000;71:1698S–1702S.
- Kitamura K, Okada Y, Okada K, et al. Epigallocatechin gallate induces an up-regulation of LDL receptor accompanied by a reduction of PCSK9 via the annexin A2-independent pathway in HepG2 cells. Mol Nutr Food Res. 2017;61:8.
- Rosillo MA, Sanchez-Hidalgo M, Cardeno A, et al. Protective effect of ellagic acid, a natural polyphenolic compound, in a murine model of Crohn’s disease. Biochem Phrmacol. 2011;82:737–745.
- Kobori M, Masumoto S, Akimoto Y, et al. Chronic dietary intake of quercetin alleviates hepatic fat accumulation associated with consumption of a western-style diet in C57/BL6J mice. Mol Nutr Food Res. 2011;55:530–540.
- Yuce A, Atessahin A, Ceribasi AO, et al. Ellagic acid prevents cisplatin-induced oxidative stress in liver and heart tissue of rats. Basic Clin Pharmacol Toxicol. 2007;101:345–349.
- Losso JN, Bansode RR, Trappey A, et al. In vitro anti- proliferative activities of ellagic acid. J Nutr Biochem. 2004;15:672–678.
- Panchal AK, Ward L, Brown L. Ellagic acid attenuates high-carbohydrate, high-fat diet-induced metabolic syndrome in rats. Eur J Nutr. 2013;52:559–568.
- Yoshimura Y, Nishi S, Zaima N, et al. Ellagic acid improves hepatic steatosis and serum lipid composition through reduction of serum resistin levels and transcriptional activation of hepatic ppara in obese, diabetic KK-Ay mice. Biochem Biophys Res Commun. 2013;434:486–491.
- Girich C, Pradhan SC. Hepatoprotective activities of picroliv, curcumin, and ellagic acid compared to silymarin on carbon-tetrachloride-induced liver toxicity in mice. J Pharmacol Pharmacother. 2012;3:149–155.
- Makino-Wakagi Y, Yoshimura Y, Uzawa Y, et al. Ellagic acid in pomegranate suppresses resistin secretion by a novel regulatory mechanis involving the degradation of intracellular resistin protein in adipocytes. Biochem Biophys Res Commun. 2012;417:880–885.
- Okula M, Kang I, Kim DM, et al. Ellagic acid modulates lipid accumulation in primary human adipocytes and human hepatoma Huh7 cells via discrete mechanisms. J Nutr Biochem. 2015;26:82–90.
- Morikawa K, Kondo I, Kanamaru Y, et al. A novel regulatory pathway for cholesterol degradation via lactostatin. Biochem Biophys Res Commun. 2007;352:697–702.
- Kong W, Wei J, Abidi P, et al. Berberine is a novel cholesterol-lowering drug working through a unique mechanism distinct from statins. Nat Med. 2004;10:1344–1351.
- Jeong HJ, Lee HS, Kim KS, et al. Sterol-dependent regulation of proprotein convertase subtilisin/kexin type 9 expression by sterol-regulatory element binding protein-2. J Lipid Res. 2008;49:399–409.
- Ishimoto K, Tachibana K, Sumitomo M, et al. Identification of human low-density lipoprotein receptor as a novel target gene regulated by liver X receptor alpha. FEBS Lett. 2006;580:4929–4933.
- Snedecor GW, Cochran WG. Statistical methods. 6th ed. Ames: The Iowa State University Press; 1967. (Japanese Edition: Iwanami Pub.Inc., Tokyo).
- Hayter AJ. A proof of the conjecture that the Tukey-Kramer multiple comparisons procedure is conservative. Ann Statist. 1984;12:61–75.
- Beglova N, Blacklow SC. The LDL receptor: how acid pulls the trigger. Trends Biochem Sci. 2005;30:309–317.
- Sniderman AD, Scantlebury T, Cianflone K. Hypertriglyceridemic hyperapob: the unappreciated atherogenic dyslipoproteinemia in type 2 diabetes mellitus. Ann Intern Med. 2001;135:447–459.
- Javitt NB. Hep G2 cells as a resource for metabolic studies: lipoprotein, cholesterol, and bile acids. FASEB J. 1990;4:161–168.
- Izem L, Rassart E, Kamate L, et al. Effect of reduced low-density lipoprotein receptor level on HepG2 cell cholesterol metabolism. Biochem J. 1998;329:81–89.
- Wilson GM, Roberts EA, Deeley RG. Modulation of LDL receptor mRNA stability by phorbol esters in human liver cell culture models. J Lipid Res. 1997;38:437–446.
- Mehta KD, Radominska-Pandya A, Kapoor GS, et al. Critical role of diacylglycerol- and phospholipid-regulated protein kinase C epsilon in induction of low-density lipoprotein receptor transcription in response to depletion of cholesterol. Mol Cell Biol. 2002;22:3783–3793.
- Kamps JA, van Berkel TJ. Regulation of low-density-lipoprotein receptors in the human hepatoma cell line Hep G2. Effect of phorbol 12-myristate 13-acetate and low-density lipoprotein. Eur J Biochem. 1993;213:989–994.
- Kumar A, Chambers TC, Cloud-Heflin BA, et al. Phorbol ester-induced low density lipoprotein receptor gene expression in HepG2 cells involves protein kinase C-mediated p42/44 MAP kinase activation. J Lipid Res. 1997;38:2240–2248.
- Vargas NB, Brewer BY, Rogers TB. Protein kinase C activation stabilizes LDL receptor mRNA via the JNK pathway in HepG2 cells. J Lipid Res. 2009;50:386–397.
- Goto T, Saito Y, Morikawa K, et al. Epigallocatechin gallate changes mRNA expression level of genes involved in cholesterol metabolism in hepatocytes. Br J Nutr. 2012;107:769–773.
- Takahashi S, Sakai J, Fujino T, et al. The very low-density lipoprotein (VLDL) receptor: characterization and functions as a peripheral lipoprotein receptor. J Atheroscler Thromb. 2004;11:200–208.
- Oliver WR Jr, Shenk JL, Snaith MR, et al. A selective peroxisome proliferator-activated receptor delta agonist promotes reverse cholesterol transport. Proc Natl Acad Sci U S A. 2001;98:5306–5311.
- Sakakura Y, Shimano H, Sone H, et al. Sterol regulatory element-binding proteins induce an entire pathway of cholesterol synthesis. Biochem Biophys Res Commun. 2001;286:176–183.
- Brown MS, Goldstein JL. The SREBP pathway: regulation of cholesterol metabolism by proteolysis of a membrane-bound transcription factor. Cell. 1997;89:331–340.
- Seeram NP, Lee R, Heber D. Bioavailability of ellagic acid in human plasma after consumption of ellagitannins from pomegranate (Punica granatum L.). Juice Clin Chim Acta. 2004;348:63–68.
- Nagaoka S, Kamuro H, Oda H, et al. Effects of polychlorinated biphenyls on cholesterol and ascorbic acid metabolism in primary cultured rat hepatocytes. Biochem Pharmacol. 1991;41:1259–1261.
- Soutar AK, Naoumova RP. Mechanisms of disease: genetic causes of familial hypercholesterolemia. Nat Clin Pract Cardiovasc Med. 2007;4:214–225.