
ABSTRACT
Hepatocyte nuclear factor 1β (HNF1β) is a transcription factor belonging to the HNF-1 family and has been implicated in a number of cancers, but its role in Wilms’ tumor (nephroblastoma) has not been addressed. Here, we compared its expression between Wilms’ tumor patient kidney tissue and adjacent tissue based on the Oncomine database (www.oncomine.com). Cell proliferation, apoptosis, migration, and HNF1β expression level were analyzed in Wilms’ tumor-derived G401 cells. Using a variety of mouse tissues (lung, heart, kidney, etc.), we found that HNF1β is the highest expression in the kidneys. Oncomine analysis further demonstrated that HNF1β has a lower expression in Wilms’ tumor tissue than in paracancerous tissues. Overexpression of HNF1β decreased cell proliferation and migration, but promoted cell apoptosis. Knockdown of HNF1β produced the opposite results. These results indicated that HNF1β may play important roles in kidney development and function, and its activation may negatively regulate Wilms’ tumor progression.
Graphical abstract
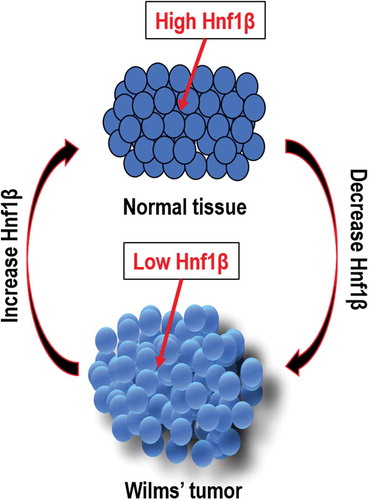
Hnf1β is lower expression level in Wilms‘ tumor compared with normal tissue and negative regulation the growth of Wilms‘ derived cells.
Wilms’ tumor (WT) is the most common pediatric renal cancer and was first identified by Max Wilms in 1899. It is caused by the dysfunction of primitive nephrogenic cells [Citation1]. Gene expression profiles and histological features are similar in WT and embryonic kidney tissues; hence, WT is classified as an embryonal tumor [Citation2–Citation4]. After decades of study and development in treatment, the overall survival rate in patients with Wilms’ tumor has increased from 30% to 80%. Moreover, intense treatments for Wilms’ tumor patients with poor prognosis and severe chronic diseases have resulted in a 25% survival rate [Citation5]. However, out of this 25% of survival cases, up to half may result in death because of recurrence, metastasis, and drug resistance [Citation6]. Therefore, it is important to decipher the key regulators that function in Wilms’ tumor progression for better diagnosis and treatment.
HNF1β (also named TCF2) is a transcription factor in the HNF1 family that regulates gene expression by maintaining active transcription or counteracting the silencing effect of chromatin condensation [Citation7]. HNF1β is expressed in the kidneys, gonads, thymus, lung, gut, and pancreas [Citation8]. The Gene Atlas database suggests that HNF1B mRNA is highly expressed in the kidneys and pancreatic islets [Citation7–Citation9]. During kidney development, HNF1β is expressed throughout the entire kidney, but predominantly distributed at the distal nephron and collecting duct [Citation7]. Studies by Filippo Massa and colleagues demonstrated that HNF1β absence or deficiency during kidney development resulted in drastic distortion of nephron precursors and prevented the initiation of tubular differentiation [Citation10]. Germline inactivation of HNF1β has also been shown to be embryonic lethal [Citation11]. Furthermore, HNF1β mutations result in urogenital defects, pancreatic atrophy, and maturity onset diabetes of the young 5 (MODY5) [Citation12]. These reports demonstrate the key role of HNF1β in normal kidney and embryo development. Moreover, many studies have explored HNF1β’s role in tumorigenesis and tumor progression, where it has been shown to have a tumor suppressive role in prostate and ovarian cancers [Citation13,Citation14].
To determine whether HNF1β expression can suppress cancer development in WT, we assessed the phenotypes after over-expressing HNF1β in WT cells. Proliferation, apoptosis, and migration assays all demonstrated that HNF1β slows the rate of tumor cell growth and progression to some degree. Data from the EdU cell proliferation assay showed that, when HNF1β was overexpressed in G401 cells, the proliferation rate was significantly reduced compared to the controls. Conversely, the apoptosis assay revealed a higher cell death rate in HNF1β-overexpressed cells compared to the controls, and slower HNF1β-overexpressed G401 cell migration compared to the controls.
This work highlights the relevance of HNF1β as a potential tumor suppressor gene in Wilms’ tumor. Further studies are required to fully understand the related signaling pathways for therapeutic targeting.
Materials and methods
Plasmids construction
Hnf1β CDS was amplified from cDNA of by PCR using the forward primer: 5′- accgagctcggatccATGGTGTCCAAGCTCACGT-3′, the reverse primer: 5′-atatctgcagaattc TCACCAGGCTTGTAGAGGACAC-3′. The amplification was inserted into the BamHI/EcorI site of pCDNA3.1 (+) (Invitrogen, Carlsbad, CA, USA) using the ligation-independent cloning (LIC) [Citation10]. Hnf1β siRNA was purchased from GenePharma Co., Ltd. (Shanghai, China) with hs.Hnf1β target: Sense: 5′-GGAGUGUAACAGGGCAGAATT-3′ and Antisense: 5′-UUCUGCCCUGUUACACUCCTT-3′. Negative control sequence:Sense 5′-UUCUCCGAACGUGUCACGUTT-3′ and Antisense 5′-ACGUGACACGUUCGGAGAATT-3′.
Cell culture and transfection
G401 cell line was purchased from Peking Union Medical College Hospital (Chinese Academy of Medical Sciences and Perking Union Medical, Beijing). G401 cell line is derived from a Rhabdoid Tumor of the Kidney (variant of Wilms’ tumor) used for Wilms‘ Tumor investigation [Citation11]. The G401 cells were cultured in modified McCoy’s 5A medium (Sigma-Aldrich Inc, St. Louis, USA) with 10% FBS (Gibico, Carlsbad, CA, USA), 1000 units/mL of penicillin and 1000 μg/mL of streptomycin in 37°C, 100% humidity and 10% CO2. When the G401 cells grew to 70% confluent in 6-well plates, lipofectamine 2000 mediated cell transfection was performed. The pcdna3.1-h.HNF1β CDS, HNF1β siRNA, and the corresponding control vectors were transfected.
RNA extraction and quantitative reverse transcription PCR
The total RNA was isolated using Trizol reagent (Invitrogen, Carlsbad, CA, USA) from 48 h post-transfected G401 cells. The cDNA was synthesized using the Invitrogen RT kit according to the manufacturer’s protocol (Invitrogen). Quantitative real-time PCR is performed using UltraSYBR Mixture (Thermo Scientific, Waltham, MA, USA) and the reactions are carried out on quantitative PCR instrument (CFX96, Bio-Rad, USA). The mRNA expression level of HNF1β was detected by qPCR at 60°C annealing temperature with HNF1β real-time PCR sense primer: 5′-GCACCCCTATGAAGACCCAG-3′ and the anti-sense primer: 5′-GGACTGTCTGGTTG AATTGTCG-3′; Six2 qPCR sense primer: 5ʹ-CCACGGGCCTCACCACCACACA-3ʹ and anti-sense primer:5ʹ-CCGACTTGCCGCTGCCATTCAG-3ʹ; Cdh1 qPCR sense primer:5′- CTTT GTGCCTCCTGAAAAGAGA-3′ and anti-sense primer:5′-GTCTCTCCAAATCCGATATGT T-3′. 18s qPCR sense primer: 5′-GTAACCCGTTGAACCCCATT-3′ and anti-sense primer: 5′-CCATCCAATCGGTAGTAGCG-3′. Each sample was performed with three independent replicates and the expressions were normalized to the internal control (18s). The value presented is mean + SEM.
Western blotting
G401 that were transfected for 48 h in 6-well plates were washed with PBS (pH 7.4) three times. Then, the cells were lysed with 300 μL of 1% SDS lysis buffer. The lysed complex were collected and boiled at 95°C in a water bath for 10 min followed by centrifuging at 12,000 rpm for 10 min to gather the proteins in supernatant. The concentration of proteins was measured using the Pierce BCA Protein Assay Kit (Thermo Scientific, Waltham, MA, USA) based on the manufacturer instructions. The primary antibodies respectively against HNF1β, Six2, E-cadherin, and β-actin were efficient with proper dilution (1:2000; 1:2000; 1:1000; 1:4000; Proteintech, Chicago, IL, USA).
Ethynyl-2ʹ-deoxyuridine (EdU) assays
G401 cells were seeded onto 48-well plate. 24 hours later G401 cells were transfected with either pcDNA3.1+ HNF1β overexpression vectors or HNF1β siRNA with their respective control vectors. 24 hours after transfection, the cell proliferation of G401 cells was determined in vitro via the EdU DNA Proliferation in Detection kit (RiboBio, China) based on manufacturer instructions.
Flow cytometry assay and reagent
The apoptosis of G401 cells was determined via the Annexin V-fluorescein isothiocyanate (FITC) apoptosis detection kit (KeyGEN BioTECH, Nanjing, China). G401 cells were transfected when the cells grew to about 70% confluence and 0.1 μM dexamethasone was selected as an inducing agent in G401 cells transfected with HNF1β -PCDNA3.1, blank vector pcDNA31HNF1β -siRNA or negative control siRNA for 48 h. Then, the cells were harvested 48 h later with EDTA-free trypsin. The cells were numbered by cell counting board and pipetted about 1 million for the later treatment according to the manufacturer instructions. The flow cytometry apoptosis detection was operated by the Joint International Research Laboratory of Reproduction and Development of the College of Laboratory Medicine, Chongqing Medical University.
Wound healing assay
G401 cells were plated in 6-well plates in McCoy’s 5A medium (modified), supplemented with 10% FBS. When cells confluency reached about 70%, PCDNA3.1-HNF1β CDS, HNF1β -siRNA, or blank vector PCDNA3.1 or negative control were transfected into G401 cells. The monolayer cells were generated using a yellow pipette tip when cells grew to 95–100%, then washed twice with PBS (pH 7.4) to wipe off cell debris. Cells were incubated in McCoy’s 5A (without FBS) Medium at 37°C, 100% humidity and 5% CO2. The images of wound width were taken at different time points (0 h, 12 and 24 h) using a fluorescence microscope (ECLIPSE Ti-s, Nikon, Tokyo, Japan).
All experiments were performed independently three times, and the results were presented as the mean ± standard error of the mean (SEM). Data were assessed for the statistical significance using student’s t-test. The GraphPad Prism 5 software (GraphPad, San Diego, CA, USA) was used to evaluate the statistical results. Statistical differences were considered significant with * p < 0.05, ** p < 0.01, *** p < 0.001.
Results
Hnf1β expression is decreased in WT and increased in embryonic kidney tissue
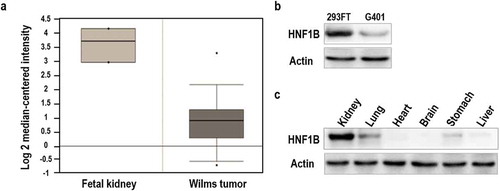
To determine the expression pattern of Hnf1β in WT, we utilized data from the Oncomine database. The Oncomine database showed that Hnf1β has low expression in WT but higher expression in embryonic kidney tissue ()). Comparative protein analysis shows that the HNF1β expression is higher in 293FT cells (embryonic kidney cells) and lower in G401 cells (WT cells) ()). Furthermore, protein analyses of murine kidney tissues revealed high HNF1β expression ()). These data demonstrate that high expression of HNF1β may play a key role in maintaining normal kidney function, while Hnf1β deficiency leads to kidney dysfunction.
Figure 1. Relative expression of HNF1β in fetal kidney and Wilms’ tumor. (a) Expression of HNF1β low in Wilms’ tumor and human Fetal kidney. (b) Expression of HNF1β in Fetal kidney cell line (293FT) and Wilms’ tumor cell lines (G401). (c) Expression of HNF1β in murine kidney tissues.
Hnf1β is a potential regulator of both pro-oncogenic and tumor suppressor genes in WT
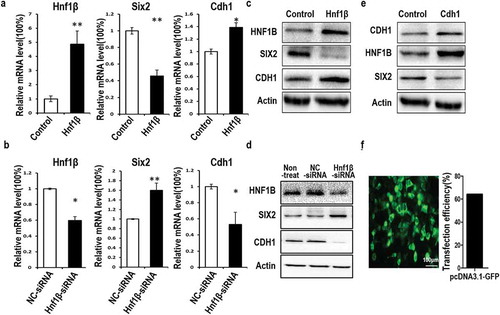
Western blotting and qPCR analyses examined Six2 and E-cadherin (Cdh1) expression when Hnf1β was either overexpressed or knocked down in WT cells (). qPCR showed that Hnf1β overexpression downregulated Six2 but upregulated Cdh1, while HNF1β knockdown revealed the opposite trend ()). Protein analyses revealed that HNF1β downregulated SIX2, a pro-oncogenic factor in WT. HNF1β overexpression significantly reduced SIX2 protein levels, whereas HNF1β knockdown increased SIX2 protein levels ()). Activated SIX2 promotes cell proliferation and growth in many cancers, including breast [Citation12], liver [Citation13], lung [Citation14], renal cell carcinomas [Citation15], and WT [Citation15–Citation19]. HNF1β overexpression also upregulated the expression of E-cadherin, a known epithelial-to-mesenchymal-transition (EMT) marker which is involved in tumor suppression in multiple cancers [Citation20–Citation28]. Downregulation or loss of E-cadherin expression is associated with increased migration and tumor invasiveness. There is an established inverse association between E-cadherin and SIX2 [Citation12,Citation13] and a correlation between E-cadherin and HNF1β [Citation29]. Western blotting indicated that E-cadherin upregulated HNF1β but downregulated SIX2 ()). pcDNA 3.1-GFP vector were used to detect the transfection efficiency of G401 and transfection efficiency is about 60% ()).
Figure 2. Analysis of relative HNF1β expression levels and its effects on Six2 and E-cadherin by quantitative polymerase chain reaction (qPCR) and western blotting. (a) The relative expression of Hnf1β overexpression in G401 cells was significantly higher compared with control. (b) HNF1β was decreased in G401 cells treated with Hnf1β-siRNA. Overexpression of HNF1β downregulated Six2 mRNA but upregulated E-cadherin mRNA expression, respectively, and inversely upregulated Six2 and downregulated E-cadherin when knock-down (c, d) Western blot shows the opposing regulation of HNF1β on Six2 and E-cadherin. (e) E-cadherin expressed G401cells shows the association between E-cadherin, HNF1β, and Six2. (f) Transfection efficiency of lipofectamine 2000 for pcdna3.1-GFP vector show over 60% efficiency in G401 cells,Bar = 100μm, meanwhile qPCR and western-blot showed the significant efficiency of HNF1β overexpression and knock-down. Statistical analysis of gene expression (a and b) is performed with GraphPad Prism 5 software. Values were presented as mean ± SEM (n = 3), **p < 0.01, *p < 0.05.
Hnf1β inhibits cell proliferation and migration but promotes apoptosis in WT
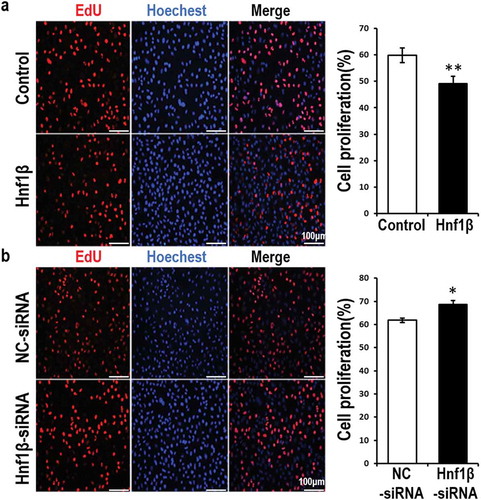
G401 cells were either transfected with Hnf1β overexpression vector or Hnf1β-siRNA, then labeled with EdU (red). Whole cell nuclei were stained with Hoechst dye (blue) ()). After 48 h, the cells were treated with either overexpression vectors or target siRNA and the respective control vectors. The ratio of EdU-positive cells to whole cells was lower in G401 cells transfected with the Hnf1β overexpression vectors compared with the control cells (). However, Hnf1β knockdown produced the opposite results.
Figure 3. Overexpression of HNF1β inhibits G401 cell proliferation while Knock-down of HNF1β promotes it. (a, b) Proliferating G401 cells were labeled with EdU (red) and nuclei of the whole cells were stained with hoechst (blue). The cells were 48 h post-treated with vectors of overexpression or target siRNA or the respective control vectors. The images present were taken by fluorescent microscopy (200×) with a scale bar of 50 μm and the red and blue images were merged to the purple ones. EdU positive percentage (EdU %) were quantified. Statistical analysis of cell proliferation (a and b, Right) is performed with GraphPad Prism 5 software. Values were presented as mean ± SEM (n = 3), **p < 0.01, *p < 0.05.
Cell migration of G401 cells was measured via the wound healing assay. The wound area width was calculated at three time points (0, 12, and 24 h) beginning when G401 cells were transfected. Overexpression of Hnf1β resulted in a reduced wound healing percentage compared with the control ()). Knockdown of Hnf1β in G401 cells did not yield any significant difference between knockdown samples and the control. These data show that the migration of G401 cells is moderately inhibited by Hnf1β.
Figure 4. ver-expression of HNF1β inhibits G401 cell migration while knock-down of HNF1β had no significant value after 24 h. Cell migration of G401 cells was measured via wound healing assay. (a) The width of wound area was calculated at three time points (0, 12, 24 h) starting from the point when G401 cells were transfected 48 h later. (b and c) Cell migration rate quantification. Statistical analysis of cell migration (b and c, Right) is performed with GraphPad Prism 5 software. Values were presented as mean ± SEM (n = 3), *p < 0.05.
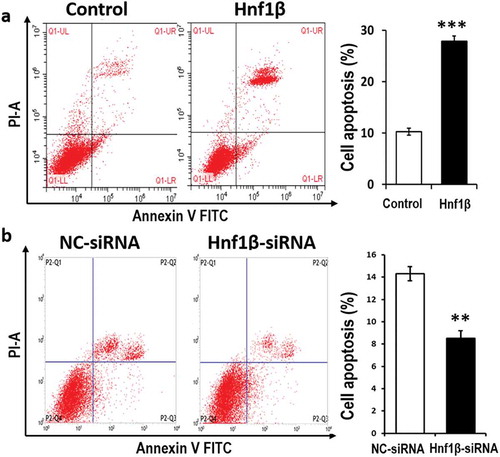
Lastly, the apoptosis assay was conducted to elucidate the role of HNF1β in WT. HNF1β overexpression increased the rate of G401 cell apoptosis, while HNF1β knockdown decreased cell apoptosis ()). The above results demonstrate that HNF1β plays a role in tumor suppression to some extent by inhibiting proliferation and migration, yet promoting apoptosis in G401 cells.
Figure 5. verexpression of HNF1β promotes G401 cell apoptosis while Knock-down of HNF1β inhibits it. (a and b) G401 cell apoptosis was detected by flow cytometry with Annexin V-FITC/PI staining. The number of positive cells double stained by AnnexinV-FITC/PI in G401 cells transfected with HNF1β overexpression vector was significantly more than the control vector. The detection was performed 48 h transfection later. (a and b, Right) Cell apoptosis rate quantification. Statistical analysis of cell migration (a and b, Right) is performed with GraphPad Prism 5 software. Values were presented as mean ± SEM (n = 3), ***p < 0.001, **P < 0.01.
Discussion
Hnf1β, which encodes a member of the homeodomain-containing superfamily of transcription factors, has been shown to be involved in nephron development [Citation30–Citation33], regulate embryonic pancreas development [Citation34–Citation36], and play a critical role in the pathology of diabetes [Citation37–Citation39]. Tumor suppression activity has been reported in prostate [Citation8] and ovarian cancers but not in WT. Here, we report the role of HNF1β in WT and its cellular function in G401 cells. Data from the Oncomine database (www.oncomine.org) show that Hnf1β is highly expressed in fetal kidney tissue but less expressed in WT tissue ()). Similarly, western blot analyses of murine kidney tissue showed high HNF1β protein expression ()). Both the Oncomine and western blot data suggested that high HNF1β expression may play a key role in maintaining normal kidney function and decreased HNF1β levels can lead to kidney dysfunction. In our western blot analysis assay, six different types of murine tissues were used: kidney, lung, heart, brain, stomach, and liver. Heart and brain tissues have no HNF1β expression [Citation40], while liver and lung tissues have lower expression compared to kidney tissue. HNF1β has been reported to have lower expression in lung cancer compared with adjacent normal lung tissue [Citation41], while HNF1β expression is higher in liver cancer compared to normal liver tissues [Citation42]. Comparative protein analyses of G401 (WT) and 293FT (human embryonal kidney) cells showed that HNF1β is higher in 293FT and lower in G401 cells ()).
Overexpression of Hnf1β decreased cell proliferation and the rate of cell migration but increased cell apoptosis in G401 cells (, and ). In contrast, when Hnf1β was knocked down, there was a marginal increase in both cell proliferation and cell migration but a significant decrease in cell apoptosis compared to the control groups. HNF1β overexpression significantly inhibited cell proliferation, as seen via the decrease in proliferating cells in the HNF1β overexpressing samples ()). HNF1β upregulation also led to a decrease in the rate of cell migration in prostate cancer. We further tested the effect of HNF1β on G401 cell apoptosis. Overexpressing G401 cells with HNF1β increased the rate of cell death significantly compared with control samples. Conversely, knocking down Hnf1β with Hnf1β-siRNA decreased the cell apoptosis rate.
Western blot and qPCR results indicate that Six2 was downregulated after G401 cells were transfected with Hnf1β-overexpression vectors ()). Conversely, when Hnf1β was silenced with Hnf1β-siRNA, Six2 was upregulated ()). These data could suggest that HNF1β transcriptionally regulates SIX2. This is plausible because a downstream target of SIX2, E-cadherin, is upregulated when SIX2 is downregulated by HNF1β. A previous report demonstrated that SIX2 targets E-cadherin to promote cancer growth and metastasis in breast cancer [Citation12]. HNF1β could also target E-cadherin directly. Activated E-cadherin, an EMT biomarker, acts as a tumor suppressor gene; downregulation or loss of E-cadherin expression is associated with increased cell migration and invasiveness of many types of cancer [Citation20–Citation22,Citation24]. Positive association between HNF1β and E-cadherin during renal repair has been demonstrated in a report by Stanislas Faguer and colleagues [Citation29]. E-cadherin downregulation upon HNF1β knockdown suggests that HNF1β may either activate E-cadherin directly or through the SIX2 pathway, which is known to target E-cadherin. Therefore, HNF1β may play an integral role in suppressing growth in WT. To validate our protein analyses results, we used CDH1-transfected G401 cell lines and tested for the expression of HNF1β and SIX2. Western blotting results confirmed a relationship between the three genes. Overexpression of E-cadherin upregulated HNF1β and downregulated SIX2 ()). All these data suggest that activation of HNF1β may directly or indirectly regulate these proteins, leading to inhibited G401 cell proliferation and growth, and increased apoptosis in WT.
In conclusion, this study demonstrates that HNF1β significantly inhibits cell proliferation and migration but promotes cell apoptosis when overexpressed in WT cells. Further research is required to explore the pathways and target genes of HNF1β in WT.
Author contribution
Y.X. designed the experiment, Y.L. and Q.K. performed the experiment, Y.L. and Y.X. wrote and revised the manuscript.
Acknowledgments
The authors are grateful to all the fellows in the Division of Molecular Nephrology and the Creative Training Center for undergraduates and graduates, the M.O.E. Key Laboratory of Laboratory Medical Diagnostics, the College of Laboratory Medicine, Chongqing Medical University.
Disclosure statement
No potential conflict of interest was reported by the authors.
Additional information
Funding
References
- Breslow N, Olshan A, Beckwith JB, et al. Epidemiology of Wilms’ tumor. Med Pediatr Oncol. 1993;21(3):172–181.
- Beckwith JB. Nephrogenic rests and the pathogenesis of Wilms’ tumor: developmental and clinical considerations. Am J Med Genet A. 1998;79(4):268–273.
- Kalapurakal JA, Dome JS, Perlman EJ, et al. Management of Wilms‘ tumour: current practice and future goals. Lancet Oncol. 2004;5(1):37–46.
- Li CM, Guo M, Borczuk A, et al. Gene expression in Wilms‘ tumor mimics the earliest committed stage in the metanephric mesenchymal-epithelial transition. Am J Pathol. 2002;160(6):2181–2190.
- Massa F, Garbay S, Bouvier R, et al. Hepatocyte nuclear factor 1beta controls nephron tubular development. Development. 2013;140(4):886–896.
- Barbacci E, Reber M, Ott MO, et al. Variant hepatocyte nuclear factor 1 is required for visceral endoderm specification. Development. 1999;126(21):4795–4805.
- Bingham C, Hattersley AT. Renal cysts and diabetes syndrome resulting from mutations in hepatocyte nuclear factor-1beta. Nephrol Dial Transplant. 2004;19(11):2703–2708.
- Ross-Adams H, Ball S, Lawrenson K, et al. HNF1B variants associate with promoter methylation and regulate gene networks activated in prostate and ovarian cancer. Oncotarget. 2016;7(46):74734–74746.
- Shen H, Fridley BL, Song H, et al. Epigenetic analysis leads to identification of HNF1B as a subtype-specific susceptibility gene for ovarian cancer. Nat Commun. 2013;4:1628.
- Chaudhary VK, Shrivastava N, Verma V, et al. Rapid restriction enzyme-free cloning of PCR products: a high-throughput method applicable for library construction. PloS One. 2014;9(10).
- Garvin AJ, Re GG, Tarnowski BI, et al. The G401 cell line, utilized for studies of chromosomal changes in Wilms‘ tumor, is derived from a rhabdoid tumor of the kidney. Am J Pathol. 1993;142(2):375–380.
- Wang CA, Drasin D, Pham C, et al. Homeoprotein Six2 promotes breast cancer metastasis via transcriptional and epigenetic control of E-cadherin expression. Cancer Res. 2014;74(24):7357–7370.
- Zhu SM, Chen CM, Jiang ZY, et al. MicroRNA-185 inhibits cell proliferation and epithelial-mesenchymal transition in hepatocellular carcinoma by targeting Six2. Eur Rev Med Pharmacol Sci. 2016;20(9):1712–1719.
- Liu Q, Li A, Tian Y, et al. The expression profile and clinic significance of the SIX family in non-small cell lung cancer. J Hematol Oncol. 2016;9(1):119.
- Senanayake U, Koller K, Pichler M, et al. The pluripotent renal stem cell regulator SIX2 is activated in renal neoplasms and influences cellular proliferation and migration. Hum Pathol. 2013;44(3):336–345.
- Murphy AJ, Pierce J, de Caestecker C, et al. SIX2 and CITED1, markers of nephronic progenitor self-renewal, remain active in primitive elements of Wilms‘ tumor. J Pediatr Surg. 2012;47(6):1239–1249.
- Pierce J, Murphy AJ, Panzer A, et al. SIX2 effects on Wilms’ tumor biology. Transl Oncol. 2014;7(6):800–811.
- Song DJ, Yue LF, Yang HY, et al. Expression and promoter methylation of SIX2 gene in peripheral blood of pediatric patients with nephroblastoma. Zhonghua yi xue za zhi. 2013;93(24):1876–1880.
- Wegert J, Ishaque N, Vardapour R, et al. Mutations in the SIX1/2 pathway and the DROSHA/DGCR8 miRNA microprocessor complex underlie high-risk blastemal type Wilms’ tumors. Cancer Cell. 2015;27(2):298–311.
- Anzai E, Hirata K, Shibazaki M, et al. FOXA1 induces E-cadherin expression at the protein level via suppression of Slug in epithelial breast cancer cells. Biol Pharm Bull. 2017;40(9):1483–1489.
- Bhat NS, Colden M, Dar AA, et al. MicroRNA-720 regulates E-cadherin-alphaE-catenin complex and promotes renal cell carcinoma. Mol Cancer Ther. 2017.
- Hussein S, Mosaad H, Rashed HE, et al. Molecular factors regulating E-cadherin expression in urothelial bladder cancer and their correlations with the clinicopathological features. Mol Biol Rep. 2017.
- Liu M, Liu J, Yang B, et al. Inversed expression patterns of S100A4 and E-cadherin in cervical cancers: implication in epithelial-mesenchymal transition. Anat Rec Hoboken, N.J.: 2007. 2017.
- Liu W, Zhang X, Zhao J, et al. Inhibition of cervical cancer cell metastasis by benzothiazole through up-regulation of E-cadherin expression. Microb Pathog. 2017;111:182–186.
- Ohashi W, Yamamine N, Imura J, et al. SKL2001 suppresses colon cancer spheroid growth through regulation of the E-cadherin/beta-catenin complex. Biochem Biophys Res Commun. 2017;493(3):1342–1348.
- Powan P, Luanpitpong S, He X, et al. Detachment-induced E-cadherin expression promotes 3D tumor spheroid formation but inhibits tumor formation and metastasis of lung cancer cells. Am J Physiol Cell Physiol 2017. ajpcell.00096.2017.
- Rosso M, Majem B, Devis L, et al. E-cadherin: a determinant molecule associated with ovarian cancer progression, dissemination and aggressiveness. PloS one. 2017;12(9):e0184439.
- Till JE, Yoon C, Kim BJ, et al. Oncogenic KRAS and p53 loss drive gastric tumorigenesis in mice that can be attenuated by E-cadherin expression. Cancer Res. 2017;77(19):5349–5359.
- Faguer S, Mayeur N, Casemayou A, et al. Hnf-1beta transcription factor is an early hif-1alpha-independent marker of epithelial hypoxia and controls renal repair. PloS one. 2013;8(5):e63585.
- Casemayou A, Fournel A, Bagattin A, et al. Hepatocyte nuclear factor-1beta controls mitochondrial respiration in renal tubular cells. J Am Soc Nephrol. 2017.
- Clissold RL, Shaw-Smith C, Turnpenny P, et al. Chromosome 17q12 microdeletions but not intragenic HNF1B mutations link developmental kidney disease and psychiatric disorder. Kidney Int. 2016;90(1):203–211.
- Naylor RW, Davidson AJ. Hnf1beta and nephron segmentation. Pediatr Nephrol Berlin, Germany. 2014;29(4): 659–664.
- Omata M, Doke Y, Yamada C, et al. Hepatocyte nuclear factor-1beta induces redifferentiation of dedifferentiated tubular epithelial cells. PloS one. 2016;11(5):e0154912.
- Boj SF, Parrizas M, Maestro MA, et al. A transcription factor regulatory circuit in differentiated pancreatic cells. Proc Natl Acad Sci U S A. 2001;98(25):14481–14486.
- Haumaitre C, Barbacci E, Jenny M, et al. Lack of TCF2/vHNF1 in mice leads to pancreas agenesis. Proc Natl Acad Sci U S A. 2005;102(5):1490–1495.
- Maestro MA, Boj SF, Luco RF, et al. Hnf6 and Tcf2 (MODY5) are linked in a gene network operating in a precursor cell domain of the embryonic pancreas. Hum Mol Genet. 2003;12(24):3307–3314.
- Dubois-Laforgue D, Bellanne-Chantelot C, Charles P, et al. Intellectual disability in patients with MODY due to hepatocyte nuclear factor 1B (HNF1B) molecular defects. Diabetes Metab. 2017;43(1):89–92.
- Dubois-Laforgue D, Cornu E, Saint-Martin C, et al. Diabetes, associated clinical spectrum, long-term prognosis and genotype/phenotype correlations in 201 adult patients with hepatocyte nuclear factor 1 B (HNF1B) molecular defects. Diabetes Care. 2017.
- Tarnowski M, Malinowski D, Safranow K, et al. HNF1B, TSPAN8 and NOTCH2 gene polymorphisms in women with gestational diabetes. J Matern Fetal Neonatal Med. 2018;31(7):837–842.
- Cha JY, Kim HI, Im SS, et al. HNF1 and/or HNF3 may contribute to the tissue specific expression of glucokinase gene. Exp Mol Med. 2001;33(2):59–63.
- Shi YX, Wang Y, Li X, et al. Genome-wide DNA methylation profiling reveals novel epigenetic signatures in squamous cell lung cancer. BMC Genomics. 2017;18(1):901.
- Shim JH, Lee HC, Han S, et al. Hepatocyte nuclear factor 1beta is a novel prognostic marker independent of the Milan criteria in transplantable hepatocellular carcinoma: a retrospective analysis based on tissue microarrays. Liver Transpl. 2013;19(3):336–345.