
ABSTRACT
Protein–protein interactions (PPIs) lead the formation of protein complexes that perform biochemical reactions that maintain the living state of the living cell. Although therapeutic drugs should influence the formation of protein complexes in addition to PPI network, the methodology analyzing such influences remain to be developed. Here, we demonstrate that a new approach combining HPLC (high performance liquid chromatography) for separating protein complexes, and the SILAC (stable isotope labeling using amino acids in cell culture) method for relative protein quantification, enable us to identify the protein complexes influenced by a drug. We applied this approach to the analysis of thalidomide action on HepG2 cells, assessed the identified proteins by clustering data analyses, and assigned 135 novel protein complexes affected by the drug. We propose that this approach is applicable to elucidating the mechanisms of actions of other therapeutic drugs on the PPI network, and the formation of protein complexes.
Graphical abstract
We developed a new approach detecting protein complexes affected with a drug by analysis of protein-protein interaction using a combination of IEC and SILAC LC-MS/MS.
Proteins have crucial roles in performing almost all biological processes in the cell; these include gene expression, cell growth, proliferation, nutrient uptake, morphogenesis, motility, and signal transduction. Proteins do not work alone, but cooperate with other proteins for their proper biological activities in the form of protein complexes, with multi-constituents tethered through protein–protein interaction (PPI). Their constituents are changed depending on different cellular processes, such as those involved in metabolism, signaling transduction, translation, and mRNA splicing [Citation1–Citation3]. A small chemical compound with biological activity can have an affect on PPI via its effects on the enzymatic properties, the state of chemical modification, or the direct interruption of the ability to form PPI, resulting in a re-wiring of the PPI network; i.e. resulting in re-construction of protein complexes in the cell [Citation4]. Such a chemical compound may be useful as a therapeutic drug, but sometimes exhibits unwanted side effects [Citation5,Citation6]. Therefore, the investigation of protein complexes affected by a drug should contribute towards elucidating the mechanism underlying the therapeutic drug action.
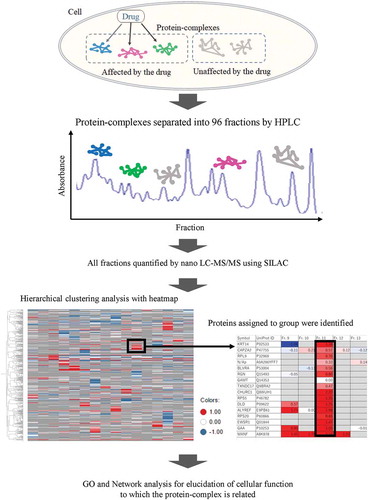
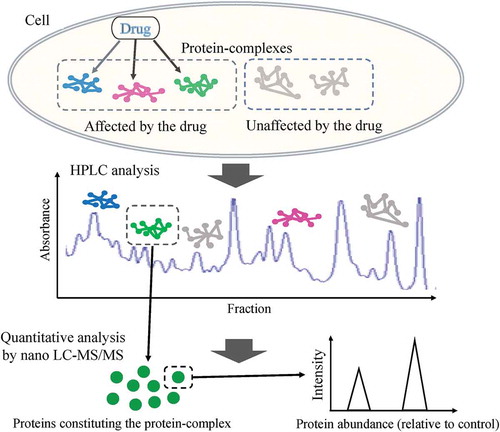
Various methods have been reported to investigate drug action on the cell, including those using RNA-seq [Citation7,Citation8], DNA microarray [Citation9], and protein microarray [Citation10]. Those methods have an advantage in investigating drug action on a large scale as differential expression levels of RNAs or proteins. On the other hand, they cannot investigate drug actions that do not appear as changes in their expression levels. In this study, we developed a new approach that is capable of detecting protein complexes affected by a drug. The approach is designed through a combination of HPLC and SILAC nano-LC-MS/MS. The concept behind this approach is that when a drug influences PPIs even without changing expression levels, it would change the constituents of the protein complexes formed by the influenced PPIs. To detect those influenced by a drug, we first fractioned protein complexes by HPLC with an ion exchange column (IEC) under gentle conditions, keeping physiological interactions, and quantitated amounts of proteins in each fraction by SILAC nano-LC-MS/MS. The constituents in a single protein complex should be eluted in the same fraction, separated by HPLC when PPIs are strong enough to tether protein complexes under conditions for HPLC separation. Therefore, by measuring the ratio of protein amounts for all proteins detected in each fraction relative to a control sample untreated with the drug, we should be able to detect protein constituents that show similar behavior in HPLC separation, and to identify the protein complexes affected by the drug ().
Figure 1. Schema of the study.
The study is constituted by both HPLC and SILAC nano-LC-MS/MS, using SILAC method to identify the PPI affected by a drug. Proteins constituting a single complex by PPIs should be eluted in the same fraction by this chromatography, those eluted in same fraction were detected by subsequent SILAC nano-LC-MS/MS. The molecules belonging to each fraction were quantified, and the protein amount relative to control (DMSO treatment) was calculated.
To evaluate the above approach, we used thalidomide as a test compound. Although thalidomide had been withdrawn due to teratogenicity shortly after its launch in West Germany [Citation11], it was found to have therapeutic effectiveness for many forms of cancers which were multiple myeloma (MM), hepatocellular carcinoma, pancreatic, prostate, and lung cancer, the drug has been observed to suppress cell proliferation and angiogenesis, control invasion and metastasis of tumors in pre-clinical studies. Despite its usefulness, the details of the molecular mechanism underlining its drug action remains to be elucidated [Citation12–Citation14]. Since thalidomide has been proved the effectiveness to the patients with hepatocellular carcinoma [Citation14,Citation15], and it is also used extensively for in vitro experiments as immobilized human hepatocytes, we used HepG2 cells to examine the effects of thalidomide on the formation of protein complexes, and an ion exchange column to fractionate protein complexes. Protein levels in each fraction between those prepared from the cells with and without treatment of thalidomide were quantified relatively, by using the non-radioactive isotopic labeling method (SILAC), commonly used in proteomics [Citation16]. Using the data of all quantitated proteins, clustering analyses, including visualized heat maps and dendrograms, reveals that thalidomide effects four distinguishable PPI clusters, which correspond to four novel protein complexes containing proteins involved in thalidomide-associated PPI networks. That data demonstrates that the new methodology described here is applicable to the evaluation of PPI networks, as well as protein complexes, influenced by a drug.
Materials & methodology
Cell culture
HepG2 cells (ATCC No. HB-8065) were cultured as adherent cells in MEM (Minimum Essential Medium, liquid, with Earle’s salt, 2 mM L-glutamine, Thermo Fisher Scientific) supplemented with 10% fetal bovine serum (Thermo Fisher Scientific), 10 mM MEM non-essential amino acids (Thermo Fisher Scientific), 1 mM sodium pyruvate (Thermo Fisher Scientific), 50 units/mL penicillin (FUJIFILM), and 50 μg/mL streptomycin (FUJIFILM). The cells were seeded to 75 cm2 culture flasks and maintained at 37°C in a humidified atmosphere of 5% CO2 and 95% air.
Silac-labeling for HepG2 cell
First, the medium for SILAC was prepared. We used Dulbecco’s Modified Eagle Medium (DMEM) for SILAC, supplemented with 10%-dialyzed fetal bovine serum (Thermo Fisher Scientific), 1 mM sodium pyruvate (Thermo Fisher Scientific), 50 units/mL penicillin (FUJIFILM), and 50 μg/mL streptomycin (FUJIFILM) which was deficient in both L-lysine and L-arginine. MEM non-essential amino acid solution which includes 10 mM (1,150 mg/L) L-proline to prevent arginine to proline conversion was also added to the medium [Citation17,Citation18]. It was used together with light and heavy amino acids for SILAC. The light SILAC medium contained the neutral amino acids, which were L-Lysine-2HCl [12C6/14N2] and L-Arginine-HCl [12C6/14N4] (Thermo Fisher Scientific). On the other hand, the heavy SILAC media contained L-Lysine-2HCl [13C6/15N2] and L-Arginine-HCl [13C6/15N4] (Thermo Fisher Scientific), instead of the natural amino acids. HepG2 cells were cultured in either the “Light” or “Heavy” SILAC media (10 mL/flask). Cells were cultured for about six doublings in SILAC medium to attain complete labeling. Fresh light or heavy SILAC media (10 mL/flask) were added to respective cultures every three days. As for the confirmation of the labeling efficiency, we prepared the samples mixed with light and heavy in equal amounts, then it was detected at a ratio of 1:1 by SILAC nano- LC-MSMS analysis (data not shown) [Citation19,Citation20]. After the completion of labeling, thalidomide (Sigma-Aldrich) was added to the medium at 10 μM final concentration ((R)-thalidomide and (S)-thalidomide were mixed in a ratio of 1:1) and cells were recovered 24 h later. Thalidomide concentration was determined based on the result of a preliminary experiment which HepG2 cell had been exposed to a wide range of 0.4 µM to 200 µM of thalidomide, it had been confirmed to have no impact on cell viability in the condition of 10 µM concentration by counting the number of nucleus. (Data not shown)
Sample preparation of HepG2 cells for the conventional proteomic approach
HepG2 cells were cultured to 80–90% confluency prior to performing cell lysis. After recovering the cells, they were washed twice with phosphate-buffered saline (PBS), re-suspended in a 500 μL extraction buffer (PBS including 0.5% CHAPS) [Citation21], and disrupted using sonication. The sonicated cells were left to stand for 30 min on ice, then centrifuged at 15,000 rpm for 30 min at 4°C. The supernatant was measured for total protein concentration by Bradford assay, using the Bio-Rad protein assay kit (Bio-Rad).
HPLC analysis for the detection of PPI using an IEC column
The 1 mg of protein was separated by IEC. Two analytical columns were used in this study, one was a silica-based material with an adsorbed, cross-linked coating of linear polyethyleneimine, which is a weak anion-exchange material (PolyWAX LP™, Item No. 104WX05-10, PolyLC Inc., column dimensions: 100 × 4.6 mm, particle size: 5 μm, pore diameters: 1000 Å), and the other was a silica-based material with a bonded coating of polyaspartic acid, which is a weak cation-exchange (PolyCAT A™, Item No. 104CT05-10, PolyLC Inc., column dimensions: 100 × 4.6 mm, particle size: 5 μm, pore diameters: 1000 Å). These columns were connected in tandem and attached to the guard columns (PolyCAT A, Guard Column, Item No. JGCCT0510, 10 × 4.0 mm, 5 µm, 1000 Å and PolyWAX LP, Guard Column, Item No. JGCWX0510, 10 × 4.0 mm, 5 µm, 1000 Å). Before analysis, the columns were flushed with 0.02 M CH3COONH4 (AcNH4), pH 6.0 from 10 up to 20 column volumes for equilibration. Mobile phase A was 2 M AcNH4 solution (pH 6.0). Mobile phase B was 80% isopropanol/acetonitrile [V/V (%) = 1:1] in H2O. And mobile phase C was H2O. After sample loading by manual syringe injection, proteins were eluted from the columns by a linear gradient from 1% A to 50%A (0.02–1 M AcNH4) [Citation22] containing a fixed concentration of 3% B (2.4% isopropanol/acetonitrile) at a flow rate of 1 mL/minute and detected by absorbance at 280 nm. We added the organic solvent in the elution buffer in a dosage that had no impact on protein denaturing in order to improve resolution [Citation23,Citation24]. The fractions were collected at 1 minute/fraction.
Sample preparation for proteome analysis using SILAC nano-LC-MS/MS
The fractions collected from the IEC column were freeze-dried, and re-dissolved in 8 M urea for denaturation. Prior to enzymatic digestion, proteins were reduced with 5 mM tris (2-carboxyethyl) phosphine (TCEP) and alkylated with 12.5 mM iodoacetamide (IAA) [Citation25]. Digestion with 400 ng Trypsin/Lys-C Mix (Promega) was conducted overnight at 37°C [Citation26]. Then, the solid-phase extraction (SPE) method was used to clean and concentrate peptides. The digested peptide sample was loaded to a tip column immobilized with styrene divinylbenzene polymer (GL-Chip SDB, GL Sciences, Inc.), and washed with 0.1% trifluoroacetic acid (TFA), eluted with 80% acetonitrile containing 0.1% TFA. The eluted peptide was dried by blowing nitrogen, and re-dissolved in 0.1% TFA [Citation27].
Nano LC-MS/MS analysis
Trypsin/LysC digested peptides were separated using a nanoflow HPLC-system (Michrom nano-Advance UHPLC, Michrom Bioresources, Inc.) consisting of a solvent degasser, nanoflow pumps, and flow control module, connected with a thermostatted autosampler (PAL-HTS-xt, CTC analysis). The peptides in 10 μL of 0.1% TFA solution were loaded with a constant flow of 200 nL/min onto a Monolith Trap column C18-50–150 (50 μm id x 150 mm, Hitachi High-Technologies) equilibrated with 0.1% TFA and separated by a MonoCap C18 Fast Flow column (50 μm x 25 cm, GL Sciences) with a linear gradient of 95%–65% solvent A (0.1% formic acid)/5–35% solvent B (98% acetonitrile with 0.1% formic acid) over 60 min.
The nanoflow HPLC system was connected to LTQ Orbitrap XL (Thermo Fisher Scientific) via a nano-ES ion source (Thermo Fisher Scientific). The splay voltage was set at 1.6 kV and the temperature of the heated capillary was set at 200°C. Full scan MS survey spectra (m/z 300–2000) were acquired in the Orbitrap with a resolution of 30,000. Mass spectra were acquired in a data-dependent manner, with an automatic switch between MS and MS/MS using the top six methods. The six most intense peptide ions from the preview scan in the Orbitrap were fragmented by the collision-induced dissociation (CID) method (normalized collision energy 35, activation 0.25 and activation time 30 ms) in the LTQ after the accumulation of 100,000 ions, and the MS/MS spectra were acquired using XCalibur software.
Quantification and bioinformatics analysis
The raw data file of completed LC-MS/MS run created by XCalibur software was processed by Proteome Discoverer (version 2.2) software (Thermo Fisher Scientific) workflow and searched by a Sequest-HT search engine with a minimum precursor mass of 350 Da and maximum 5,000 Da. The protein level was quantified based on measured ion counts, and the signal-to-noise threshold used for FT was 1.5. The searches were conducted against The Universal Protein Resource (UniProt) database for Homo sapiens using only full tryptic peptides with a maximum missed cleavage site of two, precursor mass tolerance of 10 ppm, and fragment mass tolerance of 0.6 Da. The search parameters used were oxidation of methionine (+15.995 Da), N-terminal acetylation (+42.011 Da), SILAC modifications of lysine and arginine (Lysine [13C6/15N2] and Arginine [13C6/15N4]) as variable modifications and carbamidomethylation of cysteine residues (+57.021 Da) as a fixed modification. An FDR of 5% was set as a cut-off value for reporting identified peptides using the Proteome Discoverer decoy database. The data of peptide and protein identified with high or medium confidence was then extracted [Citation28].
Clustering analysis
Quantification data of proteins analyzed by Proteome Discoverer software was applied to the clustering analysis. The ratio of protein amount to control sample (Dimethyl Sulfoxide [DMSO] treatment) converted to logarithm was used for further analysis. The multipurpose tool Spotfire® (TIBSO® Software Inc., http://www.spotfire.com) was used to conduct clustering analysis on the proteins quantified by SILAC, and to visualize it as a dendrogram. The clustering algorithm and parameter used were; clustering method: Unweighted Pair Group Method with Arithmetic Mean (UPGMA), distance measure: correlation (the correlation between two points, a and b, with k dimensions were calculated with Pearson Product Momentum Correlation), normalization: none, empty value replacement: constant value (0). Based on the results from a clustering analysis, a cluster calculation was presented either as the similarity between the clustered rows or columns, or as the distance between them. The results from correlation were presented as the similarity between the rows or columns. A value of similarity being more than 0.3 was used as the criteria for extracting groups from clustered molecules. First, we divided the entire heat map into six parts consisting of every 1:16th fraction (1–16, 17–32, 33–48, 49–64, 65–80, and 81–96) to extract molecules showing a similar chromatographic pattern at adjacent elution fractions, and a protein amount at a similar ratio. Following the analytical conditions above, hierarchical clustering was performed on each part consisting of 16 fractions, and all molecules were classified into 135 groups. Network analysis was done further for each grouping data set.
Network analysis assigning protein complexes affected by thalidomide
Proteins in each data set obtained by clustering analysis were grouped, and we then implemented network analysis using Ingenuity Pathway Analysis (IPA®, http://www.ingenuity.com) software (Ingenuity Systems®, QIAGEN) which retrieved known PPIs from the IPA® library data. The retrieval conditions were as follows: relationship to consider, direct relationship; molecules per network, up to 35 molecules; confidence filter, experimentally observed. Protein complexes were assigned by clustering analysis using the elution profiles of IEC separation, and compared with the extracted PPI networks from IPA®. PPI networks associated with thalidomide and the canonical pathways of cellular functions, both of which were registered in the IPA® database, were also extracted and compared with these protein complexes.
Gene ontology (GO) analysis assigning cellular function related to protein complexes affected by thalidomide. GO analysis was performed using the “Database for Annotation, Visualization, and Integrated Discovery” (DAVID, version 6.8). The functional annotation tool and the analysis were focusing on the categories GO Molecular Function and GO Biological Process, using the default parameter. UniProt accession IDs of molecules included in each group were uploaded as a gene list, and the entire genome of Homo sapiens was selected as the background.
Results
Conventional proteomic approach examining expression changes of protein levels in whole cell extract of HepG2 cells treated with thalidomide
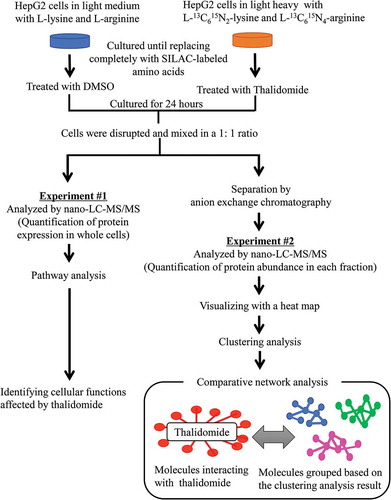
To evaluate the conventional approach using quantitative proteomic technology for the analysis of drug action on the cell, we examined the action of thalidomide on HepG2 cells in terms of changes of protein expression levels by the SILAC nano LC-MS/MS method. We compared protein expression levels in the whole cell extracts between cells with and without thalidomide treatment; i.e. SILAC-labeled proteins prepared from HepG2 cells treated for 24 h with thalidomide, and those with DMSO (control) were mixed and subjected directly to LC-MS/MS analysis (, Experiment #1). We used an arbitral criterion for evaluating the changes of protein expression levels affected by thalidomide; i.e. we selected proteins that had changed their expression levels by more than 1.2 times relative to those of the control because the accuracy of measurement about this ratio was verified in another study conducted by Park SS. et al. (2012) [Citation18]. Among the 532 proteins quantitated by the analysis, we found 344 proteins that meet the criteria (Supplementary Table 1). Of these, 109 proteins were up-regulated upon the thalidomide treatment and the remaining 235 proteins were down-regulated ((a) and Supplementary Table 1), and we found that 25 proteins (PTBP1, RPL32, RPLP1, RPS5, RPS19, RPS15A, RPS11, EIF4A1, RPS3A, RPL30, RPS6, RPLP2, RPL22, PABPC1, RPS7, EIF1, RPS2, RPS12, RPSA, RPS3, RPLP0, MAPK1, RPS4X, RPL10, RPS15) were categorized in eIF2 signaling as the most significant cellular function, 19 proteins (RPS6, PTPA, PABPC1, RPS7, RPS5, EIF1, RPS2, RPS12, RPSA, RPS3, RPS19, RPS15A, PPP2R1A, RPS11, MAPK1, EIF4A1, RPS4X, RPS3A, RPS15) were in regulation of eIF4 and p70S6K signaling as the second, and 18 proteins (RPS6, PTPA, RPS6KA3, RPS7, RPS5, RPS2, RPS12, RPSA, RPS3, RPS19, RPS15A, PPP2R1A, RPS11, MAPK1, EIF4A1, RPS4X, RPS3A, RPS15) were in mTOR signaling as the third ((b)). The top-scored function is consistent with reports in that eIF2-α kinase, a constituent of the eIF2 signaling pathway, was a possible therapeutic target of thalidomide in MM [Citation29], whereas the second and third functions that are strongly related to each other, and some molecules classified into these pathways, are common. These signaling pathways are involved in playing a central role in regulating critical cellular functions such as growth, apoptosis, cell proliferation, transcription, protein synthesis, and angiogenesis, and are reported to be activated in the MM cell which is the therapeutic target of thalidomide [Citation30]. Also, it has been suggested that these signaling pathways are associated with thalidomide phenotypes such as angiogenesis and cell proliferation [Citation31]. In addition to this, some of the molecule detected in the study to identify proteins affected by thalidomide by proteomics profiling (two-dimensional electrophoresis) with human embryonic stem cell (hESC) were observed in our study. The result that PAFAH1B3 involving in nucleocytoplasmic trafficking had been observed to be down-regulated by thalidomide treatment was consistent with our one [Citation32]. Thus, the conventional approach quantifying protein expression level in whole cell extracts is certainly useful for analyzing the cellular function affected by the drug. That data, in turn, suggests that the SILAC nano-LC-MS/MS method used was a reliable one for protein quantification. This approach, however, has a disadvantage in detecting functional changes induced by drugs not appearing in protein expression level. Therefore, we attempted to develop a method with another criteria other than protein expression level, for further evaluation on detecting drug action ( Experiment #2).
Table 1. Results for experiment #1.
Figure 2. Experimental procedure for detecting molecules by nano-LC-MS/MS, using SILAC method and profiling PPI networks affected by thalidomide.
SILAC coupled with LC-MS/MS for comparative analysis was conducted with HepG2 cells. Living cells were treated with thalidomide for 24 h after labeling with SILAC was completed. In experiment #1, molecules were directly analyzed by nano-LC-MS/MS and quantified by SILAC method. In experiment #2, firstly, molecules were fractionated by ion exchange chromatography, and then the proteins in each fraction were detected by SILAC nano-LC-MS/MS. The detected molecules were grouped based on the clustering analysis result and compared with molecules interacting with thalidomide, and then implemented to network analysis.
Separation and identification of protein complexes by a combination of ion-exchange HPLC and SILAC nano-LC-MS/MS analyses
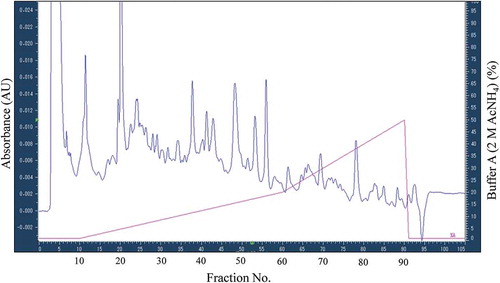
To detect cellular function affected by thalidomide action not appearing in protein expression levels, we designed another approach, by which drug action was detected as the changes in amounts of the constituents of protein complexes tethered by PPIs (). In this approach, SILAC-labeled proteins prepared from HepG2 cells treated with thalidomide (for 24 h) and those with DMSO (for 24 h, control) were mixed as in Experiment #1, but separated into 96 fractions by ion exchange chromatography with tandem columns (anion exchange column (AEC) and cation exchange column (CEC)) under gentle conditions, using AcNH4 gradient before LC-MS/MS analysis (). Proteins constituting a single complex tethered strong enough by PPIs should be eluted in the same fraction by this chromatography, so that protein complexes affected by the drug were expected to be detected as those having similarly linked changes in the amounts of their constituents in the same fraction. Therefore, we quantitated protein levels in each of all 96 fractions by subsequent nano-LC-MS/MS using the SILAC method (Supplementary Table 2(a-f) and Supplementary Table 3). Through this approach, we identified 1,256 proteins, of which 720 of them were quantified and assigned 709 proteins changed in abundance in any fraction with the condition that the cut-off ratio was 1.2/-1.2 (Supplementary Table 2(a-f) and Supplementary Table 3). The result showed that there were the proteins which the balance of amount detected in fractions separated by HPLC was not equal to zero even though the total amount has not changed in the result of conventional approach with whole cell extract of HepG2 cell. As one possible cause of this, we considered that post-translational modification on proteins made LC-MS/MS detection difficult, and it might have been brought by thalidomide action. For example, in case that phosphorylation known to be important in cell signaling is caused by the extension of thalidomide action, it becomes hard to be detected by LC-MS/MS because phosphorylated peptide is more difficult to be measured than a non-modified peptide. As expected, far more proteins were identified by this new approach than those identified by the conventional approach, which applies SILAC nano-LC-MS/MS directly to the whole HepG2 cell extract. For example, although the housekeeping proteins such as glyceraldehyde-3-phosphate dehydrogenase (GAPDH), actin, or tubulin were not changed in expression level in the experiment with the whole HepG2 cell extract, the protein amount of these molecules in fractionated samples were changed. Thalidomide has been reported to affect to the cellular processes (e.g. cytoskeletal dynamics, oxidative stress) to which these housekeeping proteins related [Citation11]. It might have been caused that the change of molecule became able to be detected by separation of each PPIs in 96 fractions, which had not been able to be found by the conventional method due to a too wide range of function in which these molecules involved [Citation33].
Figure 3. Chromatogram of experiment #2 fractionating using ion exchange chromatography.
Cell extract after 24-h thalidomide treatment was fractionated by ion exchange chromatography. Two hundredfifteen nanometer absorbance monitored and the elution buffer (%) containing 2M AcNH4 used are shown in left vertical axis and right vertical axis, respectively. The fraction No. is also shown in horizontal axis. All fractions after the equilibration step (0–10 min) were collected.
Comprehensive identification of protein complexes affected by thalidomide through clustering analysis
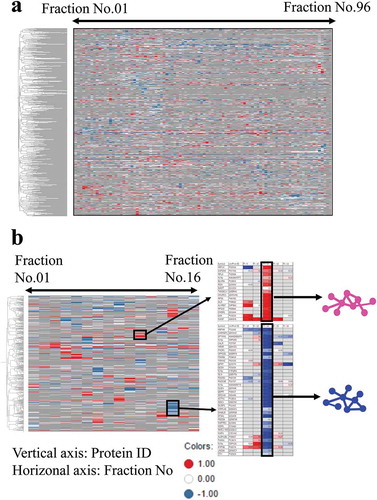
To extract proteins expected to form a protein complex, we visualized relative ratios in protein amounts between thalidomide-treated cells and control cells in each fraction, with a heat map. Combined with hierarchical clustering, the heat map revealed that proteins with close hierarchy were eluted seemingly in the same fractions, and many of those were reduced or elevated at similar levels in thalidomide-treated cell origin when compared with the control (). By examining this heat map, we assigned 135 groups that were affected by thalidomide, each of which has proteins closely related to hierarchy, and changed amounts at similar ratios among those proteins upon drug treatment.
Figure 4. Heat map visualizing protein abundance of chromatographic fraction and clustering analysis to grouped molecules showing similar elution pattern.
(a) abundance of all identified proteins in each fraction was quantitated by SILAC nano LS-MS/MS and the values were represented as logarithms. Relative ratio to control sample (DMSO treatment) of all molecules was visualized with a heat map (the column with increased protein amount colored in red, the column with decreased protein amount colored in blue, and the column with no identified protein colored with grey; the range for coloring was set as −1 to 1 of the logarithm), and then implemented to the clustering analysis. (UPGMA and Correlation were used as the clustering method and distance measure, respectively.) (b) example of how to extract protein complexes based on clustering analysis results is shown. Molecules showing similar elution pattern of the ion exchange chromatography and similar changed amount of protein level in fraction were grouped based on the clustering analysis results. Those were presumed to compose a protein-protein complex and include PPI influenced by thalidomide.
Given that proteins in each group were eluted in the same fraction by the ion exchange chromatography and changed their amount similarly upon thalidomide treatment, we considered that each group corresponds to an independent protein complex tethered by PPIs to one another. Although five proteins (CRBN, TNF, NFKB1, FGFR2, and CDH2) bind directly to thalidomide without any component between each of them and the thalidomide ()), no protein complex associated with thalidomide is known. Therefore, we attempted to compare each group with PPI networks involved in the interaction with thalidomide. For this purpose, we searched first for the assigned groups containing any of the five proteins directly interacting with thalidomide; however, no groups contained such protein. We considered that the reason why these five molecules were not detected in any groups was that the molecules were not major component of the protein complex, but involved in regulation of protein complex via other molecules indirectly. We next searched for a PPI network that has at least one node composing one of the five known thalidomide-interacting proteins and found that there were 755 molecules interacting with any one of the five thalidomide-interaction proteins ()).
Figure 5. Molecules interacting with thalidomide.
Molecules interacting with thalidomide were extracted from the database in Ingenuity Pathway software. (a) molecules were directly interacting with thalidomide. There are five molecules (cereblon, cadherin 2, fibroblast growth factor receptor 2, nuclear factor kappa B subunit 1, and tumor necrosis factor α). (b) molecules directly interacting with the above five proteins were extracted, hence those interacting with thalidomide indirectly through one molecule.
Consequently, 90 out of 755 molecules interacting with any one of the five thalidomide-interaction proteins (CRBN, TNF, NFKB1, FGFR2, and CDH2) were found in all identified 1,256 proteins, and we extracted 12 out of all 135 clustered groups as the group which included four or more molecules directly interacting with the five molecules stated above (). The quantified protein level of the groups is shown in Supplementary Table 2(a-f). Firstly, we ran network analysis using the molecules belonging to each group, and the PPIs were extracted from the IPA® library database. Subsequently, the proteins assigned in 12 groups were classified into GO terms that were categorized using DAVID (http://www.geneontology.org/). The above steps were conducted for searching for cellular function affected by thalidomide, and for investigating networks to which those functions related.
Table 2. List of molecules belonging to the group to which the molecules interacting with thalidomide were assigned.
The most abundant proteins classified in these 12 groups had GO terms for mRNA splicing, via the spliceosome (under the biological process) and those related to poly (A) RNA binding (under the molecular function). With mRNA splicing, via the spliceosome of the GO biological process and poly (A) RNA binding of GO molecular function, we identified the top-scored GO terms in 3 and 9 out of 12 groups, respectively (). The poly (A) RNA binding proteins which bind the poly (A) tail of messenger RNA (mRNA), and which are involved widely in the regulation of mRNA translation and metabolism. The proteins related to mRNA splicing also play important roles in mRNA processing, and they are involved in the process by which intervening sequences (introns) are removed from pre-mRNA to generate a functional mRNA that contains only exons. Poly (A) binding proteins were reported to play a key role in the process of correctly selecting the spliced sites on mRNA [Citation34]. Some heterogeneous nuclear ribonucleoproteins (hnRNPs) and splicing factors were also identified in the groups. hnRNPs form complexes with pre-mRNA during transcription, and splicing factors are involved in removing the introns in the process of splicing. Group No.130 included five molecules (HNRNPA3, SF1, HNRNPH1, PABPN1, HNRNPR) classified into mRNA splicing of the GO molecular function, and two of them (HNRNPH1, SF1) have been reported to have indirect interaction with thalidomide through CRBN and the constituents of spliceosome which was a large complex consisting of splicing factors and hnRNPs. CRBN was indicated to interact with U2AF65 which was one of spliceosomal proteins, and it has been proved to interact with HNRNPH1 and SF1 [Citation3,Citation35]. The result of network analysis showed that the group included the PPIs to construct the spliceosome (). To our knowledge there is no report, but thalidomide is likely to affect the regulation of mRNA splicing.
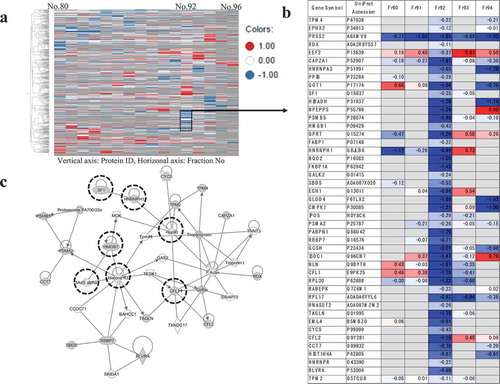
Figure 6. A network consisting of molecules assigned to the cellular process of mRNA splicing and DNA damage response.
(a) the result of clustering analysis (Part: Fraction No. 80–96) was shown in a heat map visualizing protein abundance in each fraction by ion exchange chromatography. (b) the molecules assigned to group No. 130 were listed, which were detected by clustering analysis for the part of Fraction No. 80–96. (c) network analysis was performed on group No. 130. PPI network consisting of the molecules assigned to this group was detected. The molecules involved in the cellular processes of mRNA splicing and DNA damage response were observed in the network. These molecules are enclosed in a dashed circle, and the molecules identified by LC-MS/MS are colored in grey.
In other results, group No. 28 had the GO term for cell-cell adhesion under the biological process as the top-scored annotation, and the GO term for cadherin binding involved in cell-cell adhesion under the molecular function as the second-scored annotation (data not shown). Six molecules (PDLIM5, UBFD1, COBLL1, PCBP1, RTN4, and RAN) were classified into both GO terms in common. Although no molecules interacting with thalidomide were included in these six molecules, thalidomide has been reported to inhibit TNF-α signaling, resulting in the downregulation of cell adhesion in MM cells [Citation36,Citation37]. The protein amounts of molecules belonging to group No. 28 were decreased in the fraction, and, this coincided with the known fact that thalidomide downregulated the cell-cell adhesion. In addition to this, the result of network analysis showed that the above-mentioned molecules, and others considered to be involved in the cellular functions of cell-cell adhesion, were included in the known PPIs (). Thus, the proteins were likely to be components of the same complex and to work together in the cell.
Figure 7. Network consisting of the molecules assigned to the cellular process of cell-cell adhesion.
The network analysis detected PPI consisting of the molecules belonging to group No. 28 as classified by clustering analysis. The extracted PPI was observed to include the molecules assigned to the cellular process of cell-cell adhesion. They are enclosed in a dashed circle, and the molecules identified by LC-MS/MS are colored in grey. Four molecules (PDLIM5, UBFD1, RTN4, and RAN) directly interacting with CDH1, which is involved in the E-cadherin synthesis essential for cell adhesion, were identified in the network.
In the analyses conducted so far, we focused on the groups that include the known molecules that interact with thalidomide, to investigate the relationship between the molecules in those groups and known mechanisms of thalidomide. Subsequently, we attempted to look into an unknown mechanism that seemed to be affected by thalidomide in regard to other groups. Although the biomolecular mechanisms related to the function of thalidomide (e.g. teratogenesis, anti-angiogenesis, anti-tumor activity, immune suppression, and inflammatory suppression) were partly revealed, most of them have remained unclear. Therefore, we conducted further analyses to reveal a new mechanism related to the function of thalidomide.
We ran GO analysis with other groups that include three or less molecules that were known to interact with thalidomide. GO terms of cell-cell adhesion and mRNA splicing for the biological process were found, as in the previous analysis. In addition to that, GO terms associated with the biological process of oxidative stress were significantly identified in many groups, e.g. response to oxidative stress, response to the reactive oxygen species, and to the oxidation-reduction process. There is a report on the relationship between teratogenicity caused by thalidomide and react oxygen species (ROS). The inhibition of free-radical intermediates to produce ROS in rabbit embryonic cells showed that both thalidomide-initiated DNA oxidation and teratogenicity were reduced [Citation38]. Hence, the groups that include the molecules related to oxidative stress might have PPIs that were affected by thalidomide. Next, the canonical pathways from IPA® were compared with the groups which had GO terms associated with oxidative stress, and the pathway of the NFE2-related factor 2 (NRF2)-mediated oxidative stress response was identified from library data as the pathway which had the most molecules in common with these groups. NRF2 is the transcription factor activated by oxidative stress to induce the expression of antioxidative genes. Groups No. 46 and No. 104 were identified to have a NRF2-mediated oxidative stress response as the top-scored canonical pathway and include the molecules which were part of the downstream genes of the NRF2 transcription factor in redox signaling (e.g. quinone oxidoreductase-1 [NQO1], catalase, and glutathione S-transferase [GST]). Some of these molecules that belonged to both groups also formed PPIs (). In a recent study, the activated NRF2 antagonizes NF-κB signaling, resulting in the suppression of the expression of the molecules related to cell adhesion in mice and MM cells [Citation39]. Thus, the crosstalk of these signaling pathways is presumed to relate to the mechanism of thalidomide.
Figure 8. A network consisting of the molecules assigned to the cellular process of NRF2-mediated oxidative stress response.
(a,b) Two groups (No. 46 and No. 104) in which the cellular process of NRF2-mediated oxidative stress response was identified as the top-scored pathway by network analysis were observed to include the molecules (CBR1, ERP29, NQO1, PPIB, RAN, and TXNRD1) which related to NRF2 as the upstream regulator. These proteins work for the reduction of oxidative stress. (c) Group No. 36 had three molecules (MAPK1, NQO1, GSTO1) that were common to both NRF2-mediated oxidative stress response and AHR signaling, and two (NQO1, GSTO1) of these were identified in the same PPI network. The molecules which are involved in NRF2-mediated oxidative stress response or AHR signaling enclosed in a dashed circle, and the molecules identified by LC-MS/MS are colored in grey.
Discussion
An investigation by analysis combining HPLC and SILAC nano-LC-MS/MS showed that cellular functions considered to be involved in the mechanism of thalidomide were detected. However, some functions (cell-cell adhesion and NRF2-mediated oxidative responses) have been reported to relate to thalidomide, but others (mRNA splicing via spliceosome) have not been completely explained to relate to it.
In terms of mRNA splicing, the results of network analysis for the group No. 130, which was identified to include the most molecules classified into the GO term of mRNA splicing, showed that the molecules included in detected PPIs related to not only the function of mRNA splicing, but also the one of DNA repairing. The PPI detected in group No. 130 included the molecules involved in the DNA repair process, e.g. IPO5, HMGB1, CFL1, and RNASET2 ()). Both cellular functions are related to each other. DNA damage response for repairing affected the process of mRNA splicing, and DNA damage response has an impact on the splicing pattern via spliceosome activation, to regulate the expression of genes related to the DNA repair process [Citation40]. Also, it was suggested that thalidomide caused DNA damage via intercalation to DNA, resulting in the production of ROS [Citation41]. Although a direct relationship between mRNA splicing and thalidomide has not been reported, there is a possibility that thalidomide induces DNA damage on its own, and affects mRNA splicing in the process of the DNA damage response.
We attempted to run a further analysis for NRF2-mediated oxidative stress, focusing on the pathways which were already defined by the name of the cellular process in the IPA® data library, so we compared NRF2-mediated oxidative stress with other pathways registered in IPA®. The results showed that aryl hydrocarbon receptor (AHR) signaling had the most molecules in common with NRF2-mediated oxidative stress. Although the results of GO analysis showed that AHR signaling was not identified as a significant-scored function, because just one molecule to which UniProt ID was assigned has been classified into this pathway, 25 out of 27 molecules associated with the AHR signaling of the IPA® canonical pathway were found in 1,256 identified proteins. Also, nine (GSTM3, GSTO1, HSP90AA1, HSP90AB1, HSP90B1, MAPK1, MAPK3, NQO1, NQO2) of these are common to the ones classified into NRF2-mediated oxidative stress response (Supplementary Table 2). Both pathways are reported to have crosstalk in mouse embryonic fibroblast (MEF) cells. It was revealed that NRF2 directly binds to one of the regions of the promoter of the AHR gene to modulate AHR signaling [Citation42]. Although there is no report about the relation between AHR signaling and the mechanism of thalidomide, we attempted to perform network analysis for the groups to which the AHR signaling-related molecules belonged. Group No. 36 had three molecules (MAPK1, NQO1, GSTO1) that were common to both NRF2-mediated oxidative stress response and AHR signaling, and two (NQO1, GSTO1) of these were identified in the same PPI network (). To our knowledge, there is no report about the relationship between AHR signaling and thalidomide, but AHR signaling has been reported to be involved in the NRF2-mediated oxidative stress response [Citation42] that is known to have a relationship with the teratogenicity of thalidomide [Citation38], and we observed some molecules in which the protein amount was changed because of the thalidomide treatment. AHR has been known to play a role in xenobiotic-induced toxicity, however it nowadays has become to be considered to have functions more than just those related to xenobiotics metabolism. The endogenous role of AHR in the condition of the absence of xenobiotics was focused, and AHR would have the potential of the increased or decreased cell proliferation acting as the oncogene or the tumor suppressor [Citation43]. It also has crosstalk with the TGF which has been well-known to be inhibited by thalidomide, resulting in tumor suppression. Additionally, in the keratinocyte cell line HaCaT, the correlation between AHR and cell migration was presumed, because of both AHR activation and cell migration disruption happening simultaneously, and it suggested that AHR might interact with cell adhesion molecules. As described above, the cellular functions having crosstalk with AHR signaling are expected to be wide-ranging, and the details about them are still unclear at this time. However, the reported functions coincide with the ones that have a well-known relationship with thalidomide, e.g. oxidative stress response, cell adhesion, and tumor suppression. Hence, we considered that these AHR signaling pathways also influenced by thalidomide.
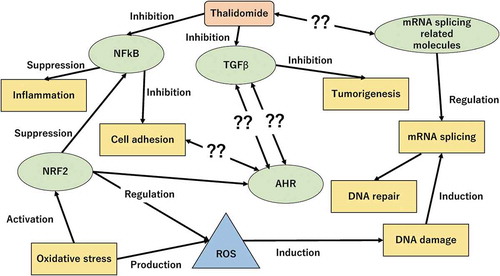
Crosstalk of intracellular signaling pathways is very complex, because it does not act alone, and one pathway has many aspects to cellular functions that are sometimes activated, and sometimes inhibited, depending on stimulations such as exogenous substances, endogenous substances, and a change of the microenvironment. A protein complex is essential for the process of intracellular signaling pathways through changes of PPIs which are transient in response to a signal transduction, which is sometimes binding, and sometimes disruptive [Citation44,Citation45]. This study indicated that PPIs were modulated and the cellular functions to which these PPIs are assigned might be involved in the mechanism of thalidomide. The NRF2-mediated oxidative response pathway would be induced by the DNA damage caused by thalidomide, and then the mRNA splicing pathway would be changed in response to this for DNA repair. On the other hand, NRF2 would also affect AHR signaling, and AHR signaling would relate to the function of cell-cell adhesion (). To reinforce the evidence that the cellular functions mentioned above were related to thalidomide, further investigation is important to verify if the changes on PPIs is canceled after the depletion of thalidomide.
Figure 9. Unknown cellular process related to thalidomide.
Thalidomide is well known to have an anti-inflammatory effect and cell adhesion suppression through the inhibition of NFκB signaling pathway, and anti-tumorigenic effect through the inhibition of TGF signaling pathway. The cellular process of mRNA splicing was significantly detected in this study, however the relation between this pathway and thalidomide has not been reported. Also, AHR signaling is demonstrated to involve some cellular functions that are related to thalidomide (cell adhesion, NRF2 signaling pathway, and TGF signaling pathway) in recent studies. Although the details of the mechanism have not been made clear at this time, AHR signaling is presumed to be involved in the cellular functions affected by thalidomide.
Our new approach showed a capability to investigate the mechanisms of a drug through analysis of PPI networks through a method combining HPLC and nano-LC-MS/MS using SILAC. In this study, we were able to detect a larger number of molecules than the ones found by the conventional approach when examining expression changes of protein levels in whole cell extract. Also, our approach showed that more cellular functions, which are expected to relate to the mechanism of thalidomide, could be elucidated than with the conventional one. In comparison with the conventional protein purification method such as affinity chromatography using specific affinity between analyte and ligand, this approach has the advantage of detection of changes in protein complex influenced by not only a direct PPI, but also by an indirect one. Also, more detailed information about the effects of drug on PPIs could be obtained by examining the changes with elapsed time after treatment. There are a lot of drugs for which the mechanisms are still unknown as to how they interact with cellular functions. The elucidation of PPI networks would help in clarifying the molecular mechanisms of drug actions, and lead to understanding the cellular functions that are more closely related to a disease state.
Supplementary_Table3_revised_20190624.xlsx
Download MS Excel (2.3 MB)Supplementary_Table2ABCDEF_revised_20190624.xlsx
Download MS Excel (982 KB)Supplementary_Table1_revised_20190624.xlsx
Download MS Excel (72.2 KB)Acknowledgments
We are grateful the staff of Discovery Technology Laboratories in Mitsubishi Tanabe Pharma Corporation to support the experiment.
Disclosure statement
No potential conflict of interest was reported by the authors.
Supplemental material
Supplemental data of this article can be assessed here.
Related Research Data
References
- Phizicky EM, Fields S. Protein-protein interactions: methods for detection and analysis. Microbiol Rev. 1995 Mar;59(1):94–123.
- Pawson T, Nash P. Protein–protein interactions define specificity in signal transduction. Genes Dev. 2000 May;14(9):1027–1047.
- Hegele A, Kamburov A, Grossmann A, et al. Dynamic protein-protein interaction wiring of the human spliceosome. Mol Cell. 2012 Feb;45(4):567–580.
- Duan XJ, Xenarios I, Eisenberg D. Describing biological protein interactions in terms of protein states and state transitions. Mol Cell Proteomics. 2002 Feb;1(2):104–116.
- Zarzycka B, Kuenemann MA, Miteva MA, et al. Stabilization of protein–protein interaction complexes through small molecules. Drug Discov Today. 2016 Jan;21(1):48–57.
- Archakov AI, Govorun VM, Dubanov AV, et al. Protein-protein interactions as a target for drugs in proteomics. Proteomics. 2003 Apr;3(4):380–391.
- Wang Z, Gerstein M, Snyder M. RNA-Seq: a revolutionary tool for transcriptomics. Nat Rev Genet. 2009 Jan;10(1):57–63.
- Wacker SA, Houghtaling BR, Elemento O, et al. Using transcriptome sequencing to identify mechanisms of drug action and resistance. Nat Chem Biol. 2012 Feb;8(3):235–237.
- Wang S, Cheng Q. Microarray analysis in drug discovery and clinical applications. Methods Mol Biol. 2006;316:49–65.
- MacBeath G, Schreiber SL. Printing proteins as microarrays for high-throughput function determination. Science. 2000 Sep;289(5485):1760–1763.
- Vargesson N. Thalidomide-induced teratogenesis: history and mechanisms. Birth Defects Res C. 2015 Jun;105(2):140–156.
- Palumbo A, Facon T, Sonneveld P, et al. Thalidomide for treatment of multiple myeloma: 10 years later. Blood. 2008 Apr;111(8):3968–3977.
- Sherbet GV. Therapeutic potential of thalidomide and its analogues in the treatment of cancer. Anticancer Res. 2015 Nov;35(11):5767–5772.
- Chen YY, Yen HH, Chou KC, et al. Thalidomide-based multidisciplinary treatment for patients with advanced hepatocellular carcinoma: a retrospective analysis. World J Gastroenterol. 2012 Feb;18(5):466–471.
- Chang JY, Ka WS, Chao TY, et al. Hepatocellular carcinoma with intra-atrial tumor thrombi. A report of three cases responsive to thalidomide treatment and literature review. Oncology. 2004;67(3–4):320–326.
- Chen X, Wei S, Ji Y, et al. Quantitative proteomics using SILAC: principles, applications, and developments. Proteomics. 2015 Sep;15(18):3175–3192.
- Bendall SC, Hughes C, Stewart MH, et al. Prevention of amino acid conversion in SILAC experiments with embryonic stem cells. Mol Cell Proteomics. 2008 Sep;7(9):1587–1597.
- Park SS, Wu WW, Zhou Y, et al. Effective correction of experimental errors in quantitative proteomics using stable isotope labeling by amino acids in cell culture (SILAC). J Proteomics. 2012 Jun;75(12):3720–3732.
- User Guide: SILAC Protein Quantitation Kits issued by Thermo Fisher Scientific (Version: MAN0016245, Rev C.0, Pub. Part No. 2161996.8). Available from: https://www.thermofisher.com/
- Zhang G, Fenyö D, Neubert TA. Evaluation of the variation in sample preparation for comparative proteomics using stable isotope labeling by amino acids in cell culture. J Proteome R. 2009 Mar;8(3):1285–1292.
- Cell Lysis and Immunoprecipitation Protocol with CHAPS buffer issued by Fivephoton BiochemicalsTM. Available from: https://fivephoton.com/
- Motoyama A, Xu T, Ruse CI, et al. Anion and cation mixed-bed ion exchange for enhanced multidimensional separations of peptides and phosphopeptides. Anal Chem. 2007 May;79(10):3623–3634.
- Gekko K, Ohmae E, Kameyama K, et al. Acetonitrile-protein interactions: amino acid solubility and preferential solvation. Biochim Biophys Acta. 1998 Sep;1387(1–2):195–205.
- Bobaly B, Beck A, Veuthey J-L, et al. Impact of organic modifier and temperature on protein denaturation in hydrophobic interaction chromatography. J Pharm Biomed Anal. 2016 Nov;131:124–132.
- Rebecchi KR, Go EP, Xu L, et al. A general protease digestion procedure for optimal protein sequence coverage and PTM analysis of recombinant glycoproteins: application to the characterization of hLOXL2 glycosylation. Anal Chem. 2011 Nov;83(22):8484–8491.
- Technical manual: Trypsin/Lys-C Mix, Mass spec grade issued by Promega (Version: TM390 Revised 2/14). Available from: https://www.promega.com/
- GL-TipTM SDB Instruction Manual issued by GL Science. Available from: http://www.glsciencesinc.com/
- Proteome Discoverer User Guide Software Version 2.2 issued by Thermo Fisher Scientific. Available from: https://www.thermofisher.com/
- Eckalbar WL, Schlebusch SA, Mason MK, et al. Transcriptomic and epigenomic characterization of the developing bat wing. Nature Genet. 2016;48(5):528–539.
- Guglielmelli T, Giugliano E, Brunetto V, et al. Therapeutic potential of thalidomide and its analogues in the treatment of cancer. Oncoscience. 2015 Nov;35(11):5767–5772.
- Sherbet GV. mTOR pathway activation in multiple myeloma cell lines and primary tumour cells: pomalidomide enhances cytoplasmic-nuclear shuttling of mTOR protein. Anticancer Res. 2015 Apr;2(4):382–394.
- Meganathan K, Jagtap S, Wagh V, et al. Identification of thalidomide-specific transcriptomics and proteomics signatures during differentiation of human embryonic stem cells. PLoS One. 2012;7(8):e44228.
- Tristan C, Shahani N, Sedlak TW, et al. The diverse functions of GAPDH: views from different subcellular compartments. Cell Signal. 2011 Feb;23(2):317–323.
- Proudfoot NJ. Ending the message: poly(A) signals then and now. Genes Dev. 2011 Sep;25(17):1770–1782.
- Singh I, Lee SH, Sperling AS, et al. Widespread intronic polyadenylation diversifies immune cell transcriptomes. Nat Commun. 2018 Apr;9(1):1716.
- Gupta D, Treon SP, Shima Y, et al. Adherence of multiple myeloma cells to bone marrow stromal cells upregulates vascular endothelial growth factor secretion: therapeutic applications. Leukemia. 2001 Dec;15(12):1950–1961.
- Wang LH, Yang XY, Zhang X, et al. Inhibition of adhesive interaction between multiple myeloma and bone marrow stromal cells by PPARγ cross talk with NF-κB and C/EBPβ. Blood. 2007 Dec;110(13):4373–4384.
- Parman T, Wiley MJ, Wells PG. Free radical-mediated oxidative DNA damage in the mechanism of thalidomide teratogenicity. Nat Med. 1999 May;5(5):582–585.
- Yen CH, Hsiao HH. NRF2 is one of the players involved in bone marrow mediated drug resistance in multiple myeloma. Int J Mol Sci. 2018 Nov;19(11):3503.
- Shkreta L, Chabot B. The RNA splicing response to DNA damage. Biomolecules. 2015 Oct;5(4):2935–2977.
- Stephens TD, Bunde CJ, Fillmore BJ. Mechanism of action in thalidomide teratogenesis. Biochem Pharmacol. 2000 Jun;59(12):1489–1499.
- Shin S, Wakabayashi N, Misra V, et al. NRF2 modulates aryl hydrocarbon receptor signaling: influence on adipogenesis. Mol Cell Biol. 2007 Oct;27(20):7188–7197.
- Baroukia R, Coumoul X, Fernandez-Salgueroc PM. The aryl hydrocarbon receptor, more than a xenobiotic-interacting protein. FEBS Lett. 2007 Jul;581(19):3608–3615.
- Jaeger S, Aloy P. From protein interaction networks to novel therapeutic strategies. IUBMB Life. 2012 Jun;64(6):529–537.
- Perkins JR, Diboun I, Dessailly BH, et al. Transient protein-protein interactions: structural, functional, and network properties. Structure. 2010 Oct;18(10):1233–1243.