
ABSTRACT
Lysyl oxidase (LOX) is required for the formation of bone collagen cross-links. Inactivation of the LOX gene in osteoblasts by DNA methylation and JAK signaling has been reported to cause loss of cross-links and an increased risk of fractures. Tocotrienols (T3s) have proven benefits on bone strength, but their potential effects on LOX remain largely unknown. Thus, the present study investigates the in vitro effects of T3s on LOX expression in human osteoblastic MG-63 cells. Results indicated that Tocotrienol-Rich Fraction (TRF), the δ-T3 rich oil extracted from Annatto was the most effective and significantly increased LOX expression. TRF treatment decreased de-novo methyltransferases (DNMTs), DNMT3A and DNMT3B levels. In addition, TRF significantly inhibited JAK2 activation and decreased expression of Fli1, a transcription factor of DNMTs. We conclude that TRF induced an increase in LOX expression via inhibition of de-novo methylation and reduction of Fli1 expression by the inactivation of JAK2.
Abbreviations: CpG: cytosine-guanine dinucleotide; DNMT: DNA methyltransferase; Fli1: friend leukemia virus integration 1; JAK: janus kinase; LOX: lysyl oxidase; PCR: polymerase chain reaction; STAT: signal transducers and activators of transcription; T3s: tocotrienols; TPs: tocopherols; TRF: Tocotrienol-Rich Fraction.
Graphical abstract
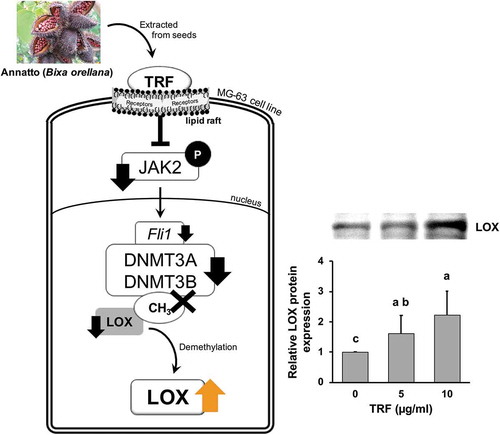
TRF induced amelioration of LOX expression in MG-63 via inhibition of de-novo methylation through the reduction of Fli1 expression by the inactivation of JAK2.
Osteoporosis is a bone disorder with serious clinical sequelae, causing annually greater than 8.9 million osteoporotic fractures worldwide with a high impact on the quality of life of aging populations [Citation1]. Osteoporosis is the consequence of altered bone metabolism resulting in the systemic reduction of bone strength and increased risk of fractures [Citation2]. As bone strength is determined by both bone mineral density (BMD) and bone quality [Citation3,Citation4] the increased risk of fracture with osteoporosis cannot be prevented only by measurement of BMD or bone mass [Citation2,Citation3]. Findings also show that early detection of an impaired quality of bone is crucial in the prevention of osteoporotic fractures [Citation2]. Many reports have demonstrated that bone quality is mainly determined by collagen cross-link formation [Citation4,Citation5] with aberrant cross-linking of collagen having been observed in a number of bone disorders, including osteoporosis. The formation of cross-links of collagen requires a key extracellular enzyme, lysyl oxidase (LOX) a copper-dependent amine oxidase, to catalyze the cross-linking of collagen and elastin, thereby increasing insoluble matrix deposition and tensile strength [Citation6]. LOX activity has been proven to be essential for stability, tensile strength, and elasticity of connective tissue of skeletal [Citation4–Citation6], as well as pulmonary and cardiovascular systems [Citation7]. Furthermore, LOX has also been reported to have novel biological roles as a tumor suppressor, affecting cell adhesion and growth control and having intracellular and intranuclear functions [Citation8].
Osteoblasts are a vital type of cells in bone tissue and are important for the maintenance of normal bone mass and bone formation [Citation9–Citation11]. In bone tissue, LOX is synthesized and secreted by osteoblasts for collagen cross-linkage and for the accumulation of a functional collagen matrix [Citation6–Citation9]. Studies have shown that decreased LOX gene expression can affect osteoblastic phenotype [Citation9–Citation11] and finely regulated expression of LOX is an integral part of the normal physiological process of bone formation in determining and maintaining bone quality.
Vitamin E is a generic term that refers to a group of eight naturally occurring lipid-soluble compounds: tocopherols (TPs) and tocotrienols (T3s), each with four distinct analogues (α-, β-, γ-, and δ-) depending on the number and position of the methyl substitutions on the chromonal ring. TPs and T3s share a common chromonal head and a side chain at the C-2 position, but T3s possess an unsaturated isoprenoid instead of a saturated phytyl tail on their side chain [Citation12]. The unsaturated side chains of T3s allow them to distribute more uniform and efficiently into the membrane lipid bilayer, thus contributing to a remarkably higher antioxidant activity compared to TPs [Citation12,Citation13]. Among tocotrienols, γ- and δ- have higher antioxidant activity than the other analogues [Citation12–Citation16]. TPs are commonly found in many edible plants whereas T3s can only be found in certain seeds and plants, with the richest concentrations of pure tocotrienols found in annatto bean, palm, and rice bran [Citation12]. In particular, Tocotrienol-Rich Fraction from Annatto (TRF) is a tocopherol free predominantly δ-T3 rich oil. Recently, T3s have gained increasing scientific interest due to their biological functions that are unrelated to their antioxidant properties [Citation16]. A recent review has shown that T3s influences multiple cell signaling pathways including transcription factors, protein kinases and enzymes in cancer cells [Citation17].
Although there exist reports that the activity of T3s is superior to that of TPs and the possibility of T3s as an anti-osteoporotic agent that have recently been published [Citation18], the potential role of T3s on bone quality-related mainly to LOX has not been explored. Therefore, in this study, we undertake a comparison of the in-vitro effects of T3s (α-, δ-, and TRF) with TPs (α- and γ-) on LOX expression in human osteoblastic-MG-63 cells. MG-63 is an osteoblastic cell line derived from a human osteosarcoma that retains many of the same functionalities as human osteoblasts [Citation19] and has shown down-regulated LOX expression [Citation11]. These cells were utilized as a functional model for LOX expression, through which the most potent T3s of LOX activation were identified and then examined to investigate the underlying molecular determinants that are involved in the amelioration of LOX expression.
Materials and methods
Reagents
All cultures and reagents were purchased from Nacalai Tesque (Kyoto, Japan), Sigma-Aldrich (Missouri, USA) and Thermo Fisher Scientific (MA, USA), unless otherwise indicated. In this study, α-tocopherol (α-TP) and γ-tocopherol (γ-TP) were provided by Nacalai Tesque, α-tocotrienol (α-T3) and δ-tocotrienol (δ-T3) were provided by TAMA BIOCHEMICAL (Tokyo, Japan), and the Tocotrienol-Rich fraction (TRF) extracted from Annatto was provided by American River Nutrition (MA, USA). Annatto TRF is a δ-T3 rich oil, which contains vitamin E as follows: 89.0% δ-T3 and 11.0% γ-T3, whereas it is completely tocopherol free.
Cell culture
MG-63 human osteosarcoma cell line (RIKEN No. RCB1890, Riken BioResourcen Center, Ibaraki, Japan), which is a human osteoblast-like cell, was used in this study. These cells were cultured in Roswell Park Memorial Institute 1640 (RPMI1640) medium containing 10% fetal bovine serum (FBS) and 0.5% penicillin/streptomycin solution in humidified air, 5% CO2 at 37°C. After the cells achieved confluence, the cells were sub-cultured using 0.5 g/L-trypsin/0.53 mmol/L-EDTA solution and Ca2+- MG2+- free phosphate-buffered saline (PBS). For the TRF experiment, MG-63 cells were seeded in a culture plate. At 24 h after culture, medium was changed and the cells were treated with one of the four vitamin E analogues or TRF. To confirm the signaling pathway involved in LOX expression in MG-63, the cells were treated with zebularine, a DNA methylation inhibitor (Tokyo Chemical Industry, Tokyo, Japan) or a JAK inhibitor AG490 (Santa Cruz Biotechnology, Texas, USA) at 24 h after seeding.
WST-1 assay
Effect of TRF on the cell viability was evaluated using WST-1. The cells were seeded in 96-well culture plates at a density of 3 × 10⁴ cells/well and cultured for 6 h. Then, the medium was removed and the cells were treated with different concentrations of TRF (2.5 µg/mL, 5 µg/mL, 10 µg/mL, 20 µg/mL) for 12 or 24 h. After that, 10 µL WST-1 reagents (Roche Applied Science, Basel, Switzerland) were added to the medium in each well and incubated for 0.5 h under 5% CO2 at 37°C. Measurements of absorbance were carried out by micro-plate reader (SUNRISE Rainbow RC-R, Tecan Japan, Kanagawa, Japan) at 450 nm.
Analysis of mRNA expression by real time qRT-PCR
For analysis of mRNA expression, the cells were plated in 30 mm dishes at a density of 1 × 10⁵ cells/dish. At 24 h after culture, the cells were treated with either 5 µg/mL or 10 µg/mL TRF for 12 or 24 h. In addition, to establish the signal pathway involved in LOX expression in MG-63, the cells were plated as above and cultured for 24 h, following which the cells were treated with zebularine (50 µM, 100 µM, 200 µM) or AG490 (10 µM, 50 µM) for 12 or 24 h. Total RNA was extracted by using Tissue Total RNA Purification Mini Kit (Favorgen Biotech Corp, Taiwan) according to the manufacturer’s protocol. The first-strand cDNA was synthesized from 300 ng of equivalent total RNA by means of Moloney Murine Leukemia Virus (ReverTra Ace® qPCR RT Kit, TOYOBO, Osaka, Japan). The obtained cDNA was subjected to PCR amplification with a real-time cycler using THUNDERBIRD™ SYBR® qPCR Mix (TOYOBO). Specific primer sets were designed based on GenBank and purchased from Sigma-Aldrich. The sequences of each primer set are shown in . Expression of RPL32 mRNA was used for normalization. Real-time PCR was performed using ABI PRISM 7000 Sequence Detection System (Applied Biosystems, CA, USA) following the procedure of: 1 min initial denaturation at 95°C, followed by 40 cycles with 15 s denaturation at 95°C and 1 min annealing and extension at 60°C. All PCRs were performed in triplicate for three independent experiments. The expression of mRNA was quantified by means of 2(-delta delta C(T)) method [Citation20].
Table 1. qRT-PCR primer sequences for mRNA expression.
Analysis of protein expression by western blot analysis
The treated MG-63 cells were suspended in PBS after washing with PBS and were centrifuged at 15,000 rpm for 5 min at 4°C. Following centrifugation, supernatants were removed. The pellets were lysed in Laemmil sample buffer (BIO-RAD, CA, USA) containing 2% 2-Mercaptoethanol, 1% phosphatase inhibitor cocktail and 1% protease inhibitor cocktail with sonication and were heated at 100°C for 3 min. After the centrifugation, protein extracts were separated on 10% polyacrylamide gel. Following electrophoresis, the proteins were transferred onto PVDF membrane (PALL, NY, USA) and blocked overnight with Blocking One (Nacalai Tesque). Subsequently, blocked membranes were incubated for an hour at room temperature with primary antibodies against LOX (Merck Millipore, Darmstabt, Germany), JAK1, JAK2, phosphorylated JAK2 and α-tubulin (Cell Signaling Technology, MA, USA) diluted in Can Get Signal Solution 1 (TOYOBO) or 1% skim milk (1:1000) in TBS (200 mM Tris-HCl, 1.5 M NaCl) containing 0.1% Tween 20, TBS-T. After the membranes were washed three times with TBS-T, they were incubated for an hour at room temperature with horseradish peroxidase-conjugated goat anti-mouse and rabbit IgG secondary antibody (Beckman Coulter, CA, USA) diluted in Can Get Signal Solution 2 (TOYOBO) (1:1000) in TBS-T. For analysis of α-tubulin, blots were packed into a hybridization bag with secondary antibody diluted in 0.1% skim milk and incubated with shaking for an hour at room temperature. Finally, the membranes were washed again and incubated for 2 min with a chemiluminescent chromogen WesternBright™ Sirius (Advansta, CA, USA). The visualization of bands was performed using AE-9300H Ez-Capture MG Quick Manual for ImageSaver6 (ATTO, Tokyo, Japan).
Statistical analysis
Each experiment was repeated independently at least three times under the same conditions. Differences between control and each dose group were analyzed using Student’s t-test. Differences among groups were analyzed by one-way ANOVA followed by Tukey-Kramer’s multiple comparison test. All data were represented as mean and standard deviation (mean ± S.D.). For all statistical tests, a p < 0.05 was considered as a significant difference.
Results
Effect of JAK signaling and DNA methylation on LOX mRNA expression in MG-63 cells
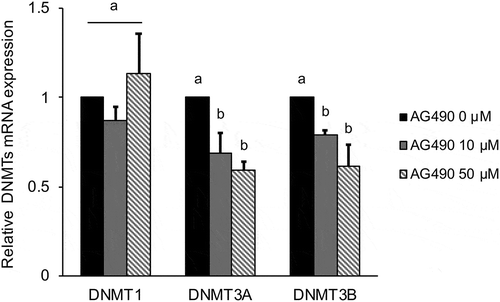
To clarify the mechanisms of LOX down-regulation in MG-63 cells, the cells were treated with inhibitors Zebularine or AG490 and we investigated the effect of both inhibitors on LOX mRNA expression. It is known that Zebularine inhibits DNA methylation by inhibiting DNA methyltransferases (DNMTs). Zebularin significantly (p < 0.01) increased LOX mRNA expression in a dose-dependent manner (). This increase was statistically significant (p < 0.05) for the 200 µM Zebularin treatment group at 12 h after culture. Treatment with AG490 for 24 h also increased LOX mRNA expression in a dose-dependent manner (). Further, we investigated the effect of AG490 on DNMTs mRNA expression. The results showed AG490 significantly decreased DNMT3A and DNMT3B mRNA expression for both the 10 µM (p < 0.05 DNMT3A, p < 0.01 DNMT3B) and 50 µM (p < 0.01) treatment groups ().
Figure 1. Effect of 0–200 µM zebularine on relative LOX mRNA expression in MG-63 cells after 24 h.
LOX mRNA expression was analyzed by real time qRT-PCR and normalized to RPL32. Data are mean ± SD, n = 5. Bars with different letters differ significantly by Tukey Kramer’s test (p < 0.05).
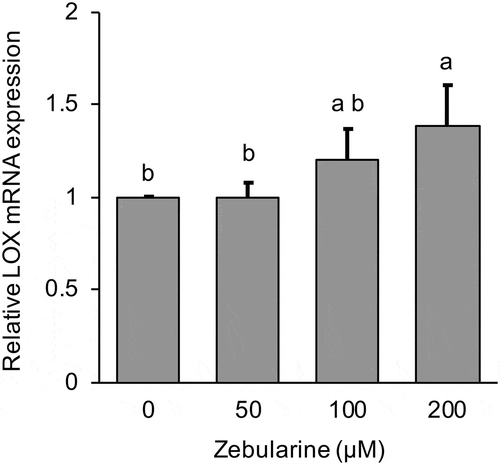
Figure 2. Effect of 0–50 µM AG490 on relative LOX mRNA expression in MG-63 cells after 24 h.
LOX mRNA expression was analyzed by real-time qRT-PCR and normalized to RPL32. Data are mean ± SD, n = 3. Bars with different letters differ significantly by Tukey-Kramer’s test (p < 0.05).
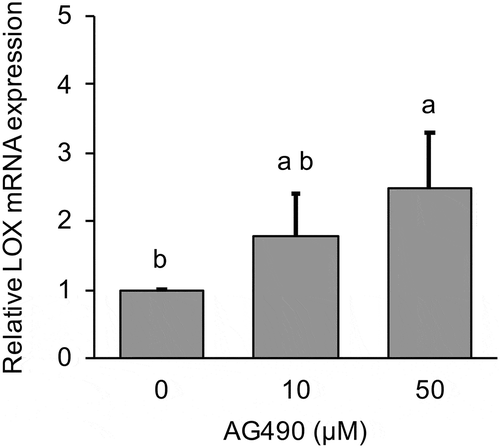
Figure 3. Effect of 0–50 µM AG490 on relative DNMT mRNA expression in MG-63 cells after 24 h.
DNMT expression was analyzed by real-time qRT-PCR and normalized to RPL32. Black bar exhibit untreated group, gray bar exhibit 10 μM of AG490 treated group and slant line bar exhibit 50 μM of AG490 treated group. Data are mean ± SD, n = 3. Bars with different letters among the treatment for each AG490 dose differ significantly by Tukey-Kramer’s test (p < 0.05).
Screening of four vitamin E analogues to determine the most potent amelioration effect on LOX expression
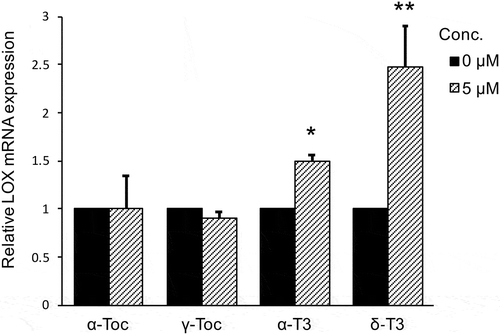
In this experiment, LOX mRNA expression was compared using four pure vitamin E analogues, α-TP, γ-TP, α-T3, and δ-T3. MG-63 cells were cultured with 5 μM of one of the four analogues for 24 h and LOX mRNA expression was analyzed by RT-real time PCR. T3s significantly increased LOX mRNA expression in both the α-T3 (p < 0.01) and δ-T3 (p < 0.05) treated group (). Whereas, LOX mRNA expression showed no increase due to treatment with TPs.
Figure 4. Comparison of the effect of four vitamin E analogues on relative LOX mRNA expression in MG-63 cells after 24 h.
LOX mRNA expression was analyzed by real-time qRT-PCR and normalized to RPL32. Data are mean ± SD, n = 3. Differences between control (0 μg/mL) and treatment group were analyzed by Student t-test (*p < 0.05, **p < 0.01).
Effect of TRF on the viability of MG-63 osteoblast-like cells
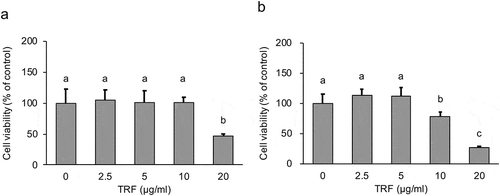
To investigate an effective and nontoxic treatment level of TRF on MG-63 cells, we compared the cellular cytotoxicity of various concentrations of TRF by WST-1 assay. 20 µg/mL of TRF induced significant (p < 0.01) cytotoxicity under treatment for 24 h ()). Furthermore, for the 48 h treatment group, not only 20 µg/mL but also 10 µg/mL of TRF induced significant (p < 0.01) cytotoxicity ()). These results suggested that a treatment dose of less than 10 µg/mL of TRF and a treatment period within 24 h would not influence cell viability of MG-63.
Figure 5. Effect of 0–20 µg/mL TRF treatment on cell viability of MG-63 cells after 24 h (a) or 48 h (b).
Cell viability of MG-63 cells was analyzed by WST-1 assay. Data are mean ± SD, n = 5. Bars with different letters differ significantly by Tukey-Kramer’s test (p < 0.05).
Effect of TRF on LOX expression in MG-63 cells
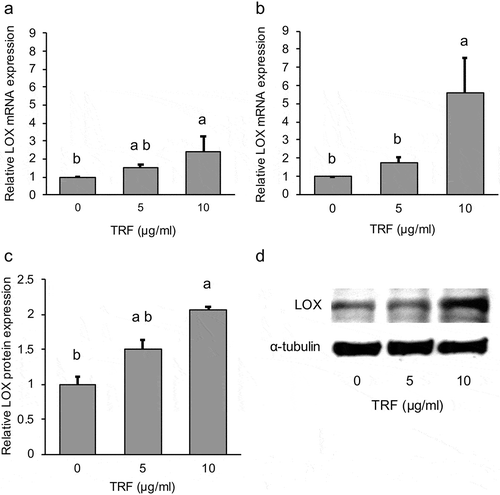
Based on the results of the WST-1 assay, MG-63 cells were treated with two different concentrations of TRF; 5 µg/mL and 10 µg/mL for either 12 or 24 h. The results of real-time PCR analysis showed that TRF increased LOX mRNA expression in a dose-dependent manner (). In particular, the difference was significant (p < 0.01) in the 10 µg/mL of TRF group at 24 h after culture (). Furthermore, LOX protein expression also showed a significant (p < 0.05) increase by 10 µg/mL of TRF ().
Figure 6. Effect of 0–10 µg/mL TRF treatment on relative LOX mRNA and protein expression in MG-63 cells.
Relative LOX mRNA expression after treatment for 12 h (a) and 24 h (b), normalized to RPL32. Relative LOX protein expression (c) normalized to α-Tubulin. Representative western blot of three independent experiments (d). Data are mean ± SD, n = 3. Bars with different letters differ significantly by Tukey-Kramer’s test (p < 0.05).
Effect of TRF on DNMT3A and DNMT3B mRNA expression
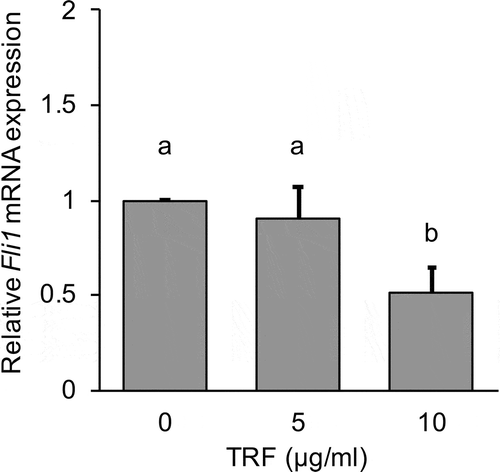
It was shown above that LOX expression is commonly inhibited by DNA methylation in MG-63 cells. We thus hypothesized that inhibiting DNA methylation by TRF results in increased LOX expression. Therefore, we investigated the effect of TRF on DNMTs in MG-63 cells. The cells were cultured for 12 or 24 h with TRF at 5 µg/mL or 10 µg/mL. The higher concentration of TRF (10 µg/mL) significantly (p < 0.01) decreased DNMT3A and DNMT3B mRNA expression after 24 h treatment compared with the untreated group (TRF 0 µg/mL). However, DNMT1 mRNA expression remained unchanged (). Moreover, due to the Fli1 is known as a transcription factor of DNMTs, we investigated the relation between TRF and Fli1 mRNA expression. 10 µg/mL of TRF also significantly (p < 0.01) decreased Fli1 mRNA expression compared with the untreated group after 24 h treatment ().
Figure 7. Effect of 0–10 µg/mL TRF treatment on relative DNMT mRNA expression in MG-63 cells after 24 h.
DNMT expression was analyzed by real-time qRT-PCR and normalized to RPL32. Black bar exhibit untreated group, gray bar exhibit 5 μg/mL of TRF treated group and slant line bar exhibit 10 μg/mL of TRF treated group. Data are mean ± SD, n = 3. Bars with different letters among the treatment for each TRF dose differ significantly by Tukey-Kramer’s test (p < 0.05).
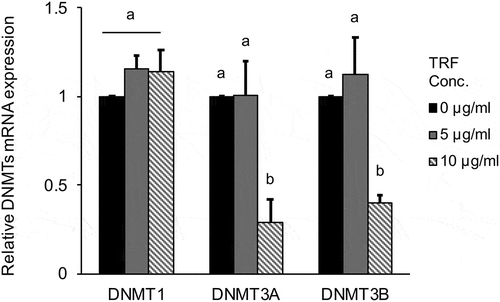
Figure 8. Effect of 0–10 µg/mL TRF treatment on relative Fli1 mRNA expression in MG-63 cells after 24 h.
Fli1 mRNA expression was analyzed by real-time qRT-PCR and normalized to RPL32. Data are mean ± SD, n = 3. Bars with different letters differ significantly by Tukey-Kramer’s test (p < 0.05).
Effect of TRF on JAK expression
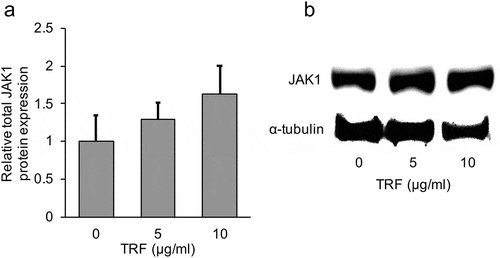
As the results from the use of AG490 showed that JAK signaling was also involved in inhibiting LOX expression in MG-63 cells, in this experiment, we focused on JAK1 and JAK2. JAK1 and JAK2 expression is frequently found in a wide range of tissues and cells, and they have a lot of common cytokine receptors [Citation21]. The effect of TRF on JAK1 and JAK2 expression was examined first. Protein analysis showed that TRF significantly (p < 0.01) decreased JAK2 total protein expression in a dose-dependent manner (). Since it is known that JAK is activated by phosphorylation, we also investigated the effect of TRF on phosphorylated protein expression of JAK2 by western blotting. The result showed that JAK2 phosphorylated protein expression was also decreased in a dose-dependent manner by TRF (). Further, a similar effect was observed on the JAK2 mRNA level (). On the contrary, JAK1 total protein expression remained unaffected ().
Figure 9. Effect of 0–10 µg/mL TRF treatment on JAK2 expression and activation in MG-63 cells after treatment for 24 h.
Relative total JAK2 protein expression was analyzed by western blotting and normalized to α-Tubulin (a). One representative western blot is shown (b). Phosphorylated protein expression was also analyzed by western blotting (c, d). Relative JAK mRNA expression after treatment for 12 h was analyzed by real-time qRT-PCR and normalized to RPL32 (e). Data are mean ± SD, n = 4. Bars with different letters differ significantly by Tukey-Kramer’s test (p < 0.05).
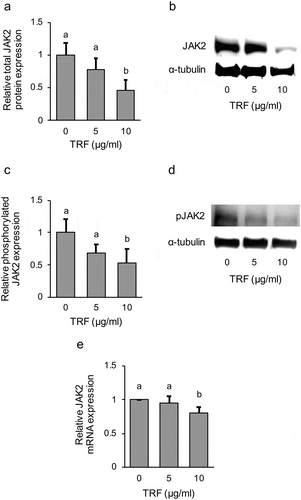
Figure 10. Effect of 0–10 µg/mL TRF treatment on JAK1 protein expression in MG-63 cells after treatment for 24 h.
Relative total JAK1 protein expression was analyzed by western blotting and normalized to α-Tubulin (a). One representative western blot is shown (b). Data are mean ± SD, n = 4. Bars with a common letter are not significantly different.
Discussion
Bone is a biologically active tissue undergoing continual renewal from the interplay between bone-forming osteoblasts and bone-resorbing osteoclasts. An imbalance in bone metabolism results in clinical diseases of the skeleton, such as osteoporosis [Citation2]. LOX has emerged as an essential element in the regulation of osteoblast functions [Citation9–Citation11]. The expression of LOX mRNA is shown to be highly responsive to various physiological as well as pathological conditions, suggesting that reduced cross-linking of collagen fibrils was due to the decreased amount of active LOX protein [Citation6–Citation11,Citation22–Citation24]. Therefore, it is of considerable interest to maintain appropriate levels of LOX in bone-forming cells and subsequently, enhancement of LOX expression offers a potential pharmacological strategy for the clinical treatment of bone disorders. The present study highlights a crucial role in a LOX ameliorative process of TRF and its mechanism of action in an in vitro model where LOX was inherently down-regulated.
We first validated the relevance of LOX expression in MG-63 cells, and in accordance with a previous report [Citation13]. LOX mRNA expression was suppressed in these cells. LOX has long been known as an important extracellular enzyme dedicated to the cross-linking of elastin and collagens critical for the stability of connective tissue [Citation6,Citation7,Citation9,Citation10]. Additionally, LOX has demonstrated intracellular functionality [Citation10,Citation11,Citation22] including mediating cell oncogenic transformation as well as acting as a tumor suppressor [Citation8].
The present study confirms the established notion that DNA methylation, especially within CpG islands, plays an essential role in gene regulation and expression. DNA methylation is an epigenetic process occurring at CpG sites, and is known to contribute to the control of gene transcription [Citation25]. Gene expression is related to the degree of methylation, with high levels of GpG methylation generally corresponding with reduced gene expression. There are three functional DNA methyltransferases (DNMTs) namely DNMT1, DNMT3A, and DNMT3B. DNMT1 maintains preexisting DNA methylation patterns along with DNA replication and cell division [Citation26], DNMT3A and DNMT3B target unmethylated CpGs and introduce de novo methylations [Citation27]. The methylation of the promoter or regulatory regions has been shown to contribute to gene silencing [Citation25]. The previous report revealed the presence of a CpG island in the promoter region of the LOX gene [Citation8], suggesting that LOX expression may be regulated by changes in methylation. Therefore, we explored the role of DNA methylation in the regulation of LOX expression and we demonstrated that 1) inhibition of DNA methylation by zebularine revealed increase of LOX mRNA expression; 2) AG490, a JAK inhibitor, also increased LOX mRNA expression; 3) when the cells were treated with AG490, the expression of DNMT3A and DNMT3B mRNA was decreased. Thus, it is likely that activation of JAK signaling is associated with increased methylation and consequent down-regulation of LOX in osteoblastic MG-63 cells.
There are several studies and findings suggesting the potential use of vitamin E supplementation for the protection of bone health [Citation28,Citation29]. Several reports indicate that vitamin E has positive effects on bone strength, with T3s exhibiting better protective effects against bone damage in several conditions of osteoporotic stress than TPs [Citation30]. We employed MG-63 cells as an in vitro assay system to identify the most potent enhancer of LOX expression amongst the vitamin E analogues. The screening results revealed that the efficacies of T3 analogues were more effective than TPs at increasing LOX expression in osteoblastic MG-63 cells. δ-T3 showed the most potent effect amongst T3s for the amelioration of LOX expression. This could be caused by differences in cellular uptake between TPs and T3s. A previous report has suggested that cellular accumulation of T3s was higher than that of TPs in mammary epithelial cells because of a difference in molecular conformation between T3s and TPs; for example: the existence of a double bone in the phytyl chain and the methylation level of the chromane ring [Citation31]. Furthermore, it has been demonstrated in human umbilical vein endothelial cells that the greater proliferation inhibitory potency of delta-T3 as compared to alpha-TOC was correlated with greater cellular uptake of delta-T3 [Citation32].
Epigenetic reprogramming of osteoblastic differentiation or of other bone-related cells has been shown to effectively regulate bone remodeling and homeostasis in certain disorders [Citation33]. Given the important role of LOX in driving collagen cross-linking in bone development and function, as revealed in many studies [Citation6–Citation10], we focused on by which exact mechanism TRF was able to enhance the LOX expression of human osteoblastic MG-63 cells. We demonstrated that TRF inhibited only JAK2 signaling and suppressed Fli1, DNMT3A, and DNMT3B expression, with a subsequent increase in LOX expression. There are four members of the JAK family: JAK1, JAK2, JAK3, and Tyk2, whose function is to phosphorylate STAT proteins that subsequently modulate gene expression. So far, all members but JAK3 have seen to be expressed in bone cells and involved in bone formation [Citation34]. The JAK-STAT signaling pathway transmits information from extracellular chemical signals to the nucleus, resulting in DNA transcription and the expression of genes involved in immunity, proliferation, differentiation, apoptosis, and oncogenesis [Citation35]. Also our findings in MG-63 cell culture system, TRF could inhibit JAK2 activation through influence some cytokines (e.g. IL-6, TNF-α), not directly JAKs. Further, recent studies have been reported that vitamin E regulates intracellular signal transduction via modification of plasma membrane structures, such as lipid rafts [Citation36–Citation38]. Several receptors for intracellular signal transduction present inside the rafts. These reports showed that vitamin E family transform lipid raft structure due to incorporate into that, which in turn regulates down-stream signaling, result in regulation of apoptosis, cell proliferation and enhance of pharmacological and/or physiological effect [Citation37,Citation38]. In this study, we consider that TRF could cause the transformation of lipid rafts structure on MG-63 cell membrane. Although additional studies are necessary to demonstrate further mechanisms of TRF.
Epidemiological and clinical data suggest that the elevated level of Homocysteine (Hcy) is a detrimental factor in the onset of bone loss and fracture [Citation39]. Hcy is known to interfere with LOX action, thus altering collagen post-translational modifications and cross-link profiles resulting in detrimental effects on bone quality [Citation3,Citation22,Citation39]. A study in an in vitro model of homocysteine stimulated pre-osteoblastic MC3T3-E1 cells elucidates the interaction between Hcy and LOX expression and the resultant loss of bone quality. Hcy accumulation induced an inflammatory cytokine-mediated reduction in LOX expression primarily regulated by two key factors: the JAK/STAT signal pathway and epigenetic DNA methylation with an observed increase in the CpG methylation status of the LOX promoter region occurring via IL-6, JAK2, Fli1, and Dnmt1 [Citation22]. Our results showed that TRF suppressed DNMT3A and DNMT3B expression by inhibiting Fli1 expression, whereas DNMT1 expression remained unchanged. However, in pre-osteoblastic MC3T3-E1 cells, Fli1, transcription factor of DNMTs is induced by JAK2 activation and this Fli1 expression induced DNMT1 expression [Citation22]. Therefore, if TRF inhibits Fli1 expression via JAK2 signaling, DNMT1 should also be down-regulated by TRF, however our results did not demonstrate this. As already mentioned, AG490, a specific JAK inhibitor also had no effect on DNMT1 expression. From these findings, we hypothesize that the suppression of DNMT3A and DNMT3B by inhibition of JAK2-mediated Fli1 expression is a specific signaling mechanism in MG-63 cells. This could add new insights about the relation between Fli1 and epigenetic DNA methylation in MG-63.
Hence, our findings suggest that TRF can increase LOX through inhibition of JAK signaling and DNA methylation and a number of studies including our previous works that assessed the role of T3s as an anti-cancer agent have recognized its epigenetic potential [Citation40–Citation42]. Furthermore, we demonstrate that at non-cytotoxic concentrations of TRF (10 μg/mL), there was a significant increase in LOX expression observed in MG-63 cells. In this regard, TRF can be incorporated into a model where suppressing HCY-induced JAK/STAT and epigenetic process could lead to the maintenance of LOX. However, we understand that the results presented in this study only relate to in vitro cell culture systems and expect to undertake further research using in vivo studies.
In conclusion, our present findings suggest the possibility of a new function for TRF from annatto as a bone quality amelioration component.
Author contribution
Kohno K designed the study, conducted experiments, analyzed data, and wrote the paper. Yamada W, Ishitsuka A, and Sekine M performed experiments and analyzed data. Virgina N contributed to write the manuscript. Ota M and Yano T designed the study, contributing to write the manuscript, and commented on it.
Disclosure statement
No potential conflict of interest was reported by the authors.
Additional information
Funding
References
- Johnell O, Kanis JA. An estimate of the worldwide prevalence and disability associated with osteoporotic fractures. Osteoporos Int. 2006;17:1726–1733.
- Grossman JM. Osteoporosis prevention. Curr Opin Rheumatol. 2011;23:203–210.
- Gourion-Arsiquaud S, Faibish D, Myers E, et al. Use of FTIR spectroscopic imaging to identify parameters associated with fragility fracture. J Bone Miner Res. 2009;24:1565–1571.
- Saito M, Marumo K. Collagen cross-links as a determinant of bone quality: a possible explanation for bone fragility in aging, osteoporosis, and diabetes mellitus. Osteoporos Int. 2010;21:195–214.
- Saito M, Fujii K, Marumo K. Degree of mineralization-related collagen crosslinking in the femoral neck cancellous bone in case of hip fracture and controls. Calcif Tissue Int. 2006;79:160–168.
- Smith-Mungo LI, Kagan HM. Lysyl oxidase: properties, regulation and multiple functions in biology. Matrix Biol. 1998;16:387–398.
- Rodriguez C, Martinez-González J, Raposo B, et al. Regulation of lysyl oxidase in vascular cells: lysyl oxidase as a new player in cardiovascular diseases. Cardiovasc Res. 2008;79:7–13.
- Kaneda A, Wakazono K, Tsukamoto T, et al. Lysyl oxidase is a tumor suppressor gene inactivated by methylation and loss of heterozygosity in human gastric cancers. Cancer Res. 2004;64:6410–6415.
- Hong HH, Pischon N, Santana RB, et al. A role for lysyl oxidase regulation in the control of normal collagen deposition in differentiating osteoblast cultures. J Cell Physiol. 2004;200:53–62.
- Pischon N, Darbois LM, Palamakumbura AH, et al. Regulation of collagen deposition and lysyl oxidase by tumor necrosis factor-alpha in osteoblasts. J Biol Chem. 2004;279:30060–30065.
- Buchinger B, Spitzer S, Karlic H, et al. Lysyl oxidase (LOX) mRNA expression and genes of the differentiated osteoblastic phenotype are upregulated in human osteosarcoma cells by suramin. Cancer Lett. 2008;265:45–54.
- Aggarwal BB, Sundaram C, Prasad S, et al. Tocotrienols, the vitamin E of the 21st century: its potential against cancer and other chronic diseases. Biochem Pharmacol. 2010;80:1613–1631.
- Serbinova E, Kagan V, Han D, et al. Free radical recycling and intramembrane mobility in the antioxidant properties of alpha-tocopherol and alpha-tocotrienol. Free Radic Biol Med. 1991;10:263–275.
- Müller L, Theile K, Böhm V. In vitro antioxidant activity of tocopherols and tocotrienols and comparison of vitamin E concentration and lipophilic antioxidant capacity in human plasma. Mol Nutr Food Res. 2010;54:731–742.
- Miyazawa T, Shibata A, Sookwong P, et al. Antiangiogenic and anticancer potential of unsaturated vitamin E (tocotrienol). J Nutr Biochem. 2009;20:79–86.
- Yano T, Sato A, Sekine M, et al. Redox-inactive analogue of tocotrienol as a potential anti-cancer agent. Anticancer Agents Med Chem. 2013;13:496–501.
- Kannappan R, Gupta SC, Kim JH, et al. Tocotrienols fight cancer by targeting multiple cell signaling pathways. Genes Nutr. 2012;27:43–52.
- Chin KY, Ima-Nirwana S. Vitamin E as an antiosteoporotic agent via receptor activator of nuclear factor kappa-B ligand signaling disruption: current evidence and other potential research areas. Evid Based Complement Alternat Med. 2012;2012:747020.
- Angeli A, Dovio A, Sartori ML, et al. Interactions between glucocorticoids and cytokines in the bone microenvironment. Ann N Y Acad Sci. 2002;966:97–107.
- Livak KJ, Schmittgen TD. Analysis of relative gene expression data using real-time quantitative PCR and the 2(-Delta Delta C(T)) method. Methods. 2001;25:402–408.
- Kisseleva T, Bhattacharya S, Braunstein J, et al. Signaling through the JAK/STAT pathway, recent advances and future challenges. Gene. 2002;285:1–24.
- Thaler R, Agsten M, Spitzer S, et al. Homocysteine suppresses the expression of the collagen cross-linker lysyl oxidase involving IL-6, Fli1, and epigenetic DNA methylation. J Biol Chem. 2011;286:5578–5588.
- Fernandes H, Dechering K, Van Someren E, et al. The role of collagen crosslinking in differentiation of human mesenchymal stem cells and MC3T3-E1 cells. Tissue Eng Part A. 2009;15:3857–3867.
- Turecek C, Fratzl-Zelman N, Rumpler M, et al. Collagen cross-linking influences osteoblastic differentiation. Calcif Tissue Int. 2008;82:392–400.
- Attwood JT, Yung RL, Richardson BC. DNA methylation and the regulation of gene transcription. Cell Mol Life Sci. 2002;59:241–257.
- Jones PA, Liang G. Rethinking how DNA methylation patterns are maintained. Nat Rev Genet. 2009;10:805–811.
- Okano M, Bell DA, Haber EL. DNA methyltransferases DNMT3a and DNMT3b are essential for de novo methylation and mammalian development. Cell. 1999;99:247–257.
- Chin KY, Abdul-Majeed S, Fozi NF, et al. Annatto tocotrienol improves indices of bone static histomorphometry in osteoporosis due to testosterone deficiency in rats. Nutrients. 2014;6:4974–4983.
- Nazrun AS, Norazlina M, Norliza M, et al. The anti-inflammatory role of vitamin E in prevention of osteoporosis. Adv Pharmacol Sci. 2012;2012:142702.
- Abdul-Majeed S, Mohamed N, Soelaiman IN. The use of delta-tocotrienol and lovastatin for anti-osteoporotic therapy. Life Sci. 2015;125:42–48.
- McIntyre BS, Briski KP, Gapor A, et al. Antiproliferative and apoptotic effects of tocopherols and tocotrienols on preneoplastic and neoplastic mouse mammary epithelial cells. Proc Soc Exp Biol Med. 2000;224:292–301.
- Shibata A, Nakagawa K, Sookwong P, et al. Delta-Tocotrienol suppresses VEGF induced angiogenesis whereas alpha-tocopherol does not. J Agric Food Chem. 2009;57:8696–8704.
- Sugahara R, Sato A, Uchida A, et al. Annatto tocotrienol induces a cytotoxic effect on human prostate cancer PC3 cells via the simultaneous inhibition of Src and Stat3. J Nutr Sci Vitaminol (Tokyo). 2015;61:497–501.
- Levy JB, Schindler C, Raz R, et al. Activation of the JAK-STAT signal transduction pathway by oncostatin-M cultured human and mouse osteoblastic cells. Endocrinology. 1996;137:1159–1165.
- Mikami Y, Asano M, Honda MJ, et al. Bone morphogenetic protein 2 and dexamethasone synergistically increase alkaline phosphatase levels through JAK/STAT signaling in C3H10T1/2 cells. J Cell Physiol. 2010;223:123–133.
- Ikeda S, Nomura S, Hanzawa F. Vitamin E regulates signal transduction via modification of plasma membrane structure: is this a real mechanism for the beyond antioxidant action of vitamin E? Vitamins. 2015;89:540–542.
- Davis S, Davis BM, Richens JL, et al. Alpha-tocopherols modify the membrane dipole potential leading to modulation of ligand binding by P-glycoprotein. J Lipid Res. 2015;56:1543–1550.
- Lemaire-Ewing S, Desrumaux C, Néel D, et al. Vitamin E transport, membrane incorporation and cell metabolism: is alpha-tocopherol in lipid rafts an oar in the lifeboat? Mol Nutr Food Res. 2010;54:631–640.
- van Meurs JB, Dhonukshe-Rutten RA, Pluijm SM, et al. Homocysteine levels and the risk of osteoporotic fracture. N Engl J Med. 2004;350:2033–2041.
- Vrtačnik P, Marc J, Ostanek B. Epigenetic mechanisms in bone. Clin Chem Lab Med. 2014;52:589–608.
- Sato A, Ueno H, Fusegi M, et al. A succinate ether derivative of tocotrienol enhances Dickkopf-1 gene expression through epigenetic alterations in malignant mesothelioma cells. Pharmacology. 2018;102:26–36.
- Peh HY, Tan WS, Liao W, et al. Vitamin E therapy beyond cancer: tocopherol versus tocotrienol. Pharmacol Ther. 2016;162:152–169.