
ABSTRACT
Endomembrane transport system begins at the endoplasmic reticulum (ER), continues to the Golgi apparatus and subsequent compartment called trans-Golgi network (TGN). We found that SUT2, a tobacco sucrose-transporter ortholog and was localized in the TGN, decreased significantly under a sucrose-starvation condition. The tobacco SNARE protein SYP41, localized in the TGN and secretory vesicle cluster (SVC), also decreased under the starvation. Similarly, the SCAMP2-RFP fusion protein, which is localized in TGN, SVC, and plasma membrane (PM), was distributed solely in the PM under the starvation. Under the same starvation condition, protein secretion was not arrested but pectin deposition to cell wall was suppressed. These data indicated that the protein composition in TGN and existence of the SVC are regulated by sugar availability. Furthermore, our findings as well as the involvement of SVC in pectin secretion suggested that synthesis and transport of pectin are regulated by the level of extracellular sugars.
Abbreviations
ER: endoplasmic reticulum; GI-TGN: Golgi-released independent TGN; GFP: green fluorescent protein; mRFP: monomeric red fluorescent protein; P4H1.1: prolyl 4-hydroxylase 1.1; PM: plasma membrane; SCAMP2: secretory carrier membrane protein 2; SUT2: sucrose transporter 2; SVC: secretory vesicle cluster; SYP41: syntaxin of plant 41; TGN: trans-Golgi network; YFP: yellow fluorescent protein
GRAPHICAL ABSTRACT
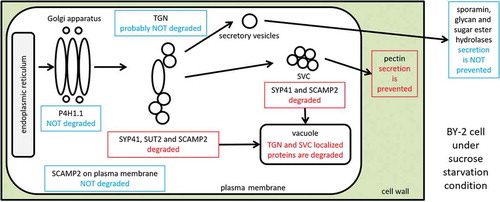
Modulation of the turnover of endomembrane proteins and of the transport of macromolecules upon sucrose starvation in tobacco BY-2 cells
The endomembrane system in eukaryotic cells functions as a complex network of the membrane and vesicular trafficking, acting to achieve basic functions in cells [Citation1]. This system is important for the transport of substances such as proteins, glycan, and lipids [Citation2]. The trafficking in this system begins at the endoplasmic reticulum (ER) and is continues to the Golgi apparatus and trans-Golgi network (TGN). The TGN functions as a sorting site to direct cargo proteins to various destinations, such as vacuoles/lysosomes, plasma membrane (PM), and the extracellular space [Citation2].
In plant cells, the Golgi apparatus has a role of synthesizing polysaccharides, which are incorporated into the cell wall or other parts of the cell [Citation3]. The detail of the transport of these glycans as well as secretory proteins from the Golgi to the extracellular space have not been fully clarified in plant cells. However, it appears that multiple exocytotic pathways exist with distinct pathways delivering different proteins and/or polymerized and sometimes protein-attached sugars to the PM and extracellular space (reviewed in [Citation4]), and to the newly synthesized cell wall during cytokinesis [Citation5]. We showed previously that the secretory vesicle cluster (SVC), which is a cluster of secretory vesicles generated from TGN, delivers pectin to the extracellular space in rapidly dividing tobacco BY-2 cells [Citation6]. A similar structure, called free TGN or Golgi-released independent TGN (GI-TGN) has been reported in Arabidopsis [Citation7,Citation8]. The common features of the SVC and free TGN/GI-TGN are that these compartments can be observed as small punctate structures under a confocal fluorescence microscope, and both contain SYP4-class SNARE proteins, although the same SNAREs are also present in Golgi-associated TGN [Citation6–Citation8].
Vacuoles in plant cells function as storage sites for many substances, including salts, organic acids, sugars, storage proteins, pigments, and sometimes waste products (summarized in [Citation9]). Vacuoles also act as recycling sites of various substances, because many types of molecules including proteins, lipids, nucleic acids and sugars, as well as organelles themselves are degraded in these compartments (summarized in [Citation9]). Autophagy is one of such degradation mechanism [Citation10]. In tobacco BY-2 cells, autophagy can be induced under the starvation of various major nutrients, such as sucrose, inorganic nitrogen compounds or phosphate in culture medium [Citation11–Citation13]. Moreover, suppression of cell-cycle progression under nutrient limitation has been reported in both tobacco BY-2 cells with phosphate limitation [Citation14] and Arabidopsis cells with sucrose limitation [Citation15]. In the case of Arabidopsis cells, the resupply of sucrose to the culture medium of starved and cell-cycle arrested cells directed these cells to re-enter the cell division cycle [Citation15]. Not only the induction of autophagy and suppression of cell division, limitation of nutrients suppress the development of plant organs (summarized in [Citation16]). This phenomenon may link the regulation of biosynthesis and trafficking of cell wall constituents, although the mechanisms by which nutrient availability regulate events related to the construction of the cell wall are poorly understood [Citation16].
We have been investigating how plant endomembrane system is operated, and how cellular machineries related to endomembrane system are modulated by the extracellular environments, using tobacco BY-2 cells as a model [Citation6,Citation12,Citation13]. One of our interests is how different transporters against the same compound are modulated by the level of such compounds. To investigate this, we chose sucrose and sucrose transporters combination, as sucrose is the sole carbon source in the culture medium of BY-2 cells, and as we have EST and full-length cDNA clones for distinct sucrose-transporter orthologs from tobacco. Here, we investigated the effect of sucrose-starvation on the events involving endomembrane organelles and secretory trafficking in tobacco BY-2 cells using sucrose transporters and other membrane proteins. We found that in the starved cells, the SVC and a subset of TGN proteins observed in rapidly-growing BY-2 cells disappeared in concomitant with the arrest of pectin biosynthesis without affecting protein secretion ability significantly.
Materials and methods
Cell culture and starvation induction
The transformed tobacco BY-2 cell lines expressing the secretory form of sporamin, P4H1.1-GFP, P4H1.1-mRFP, YFP-SYP41, and SCAMP2-mRFP were as described [Citation6,Citation17,Citation18]. Cells expressing SUT2-mRFP, SUT2-GFP, and SUT4-GFP were generated using the corresponding expression plasmids (see below) into tobacco BY-2 cells as described [Citation17]. In some cases, two different expression plasmids were used to express two expression cassettes in the same cell. In such cases, a sequence transformation with different antibiotic selections were carried out as described previously [Citation12].
Transformed or non-transformed tobacco BY-2 cells were cultured as described [Citation19]. Three-day-old (log phase) cells were used throughout the experiments. Starvation induction was carried out as described using an appropriate medium [Citation12]. In some cases, inhibitors for degradation systems, such as 3-methyladenine (3-MA) for the early event of autophagy progression [Citation20], E-64 for the delivery of autophagosomes to vacuoles [Citation12], or MG-132 for the inhibition of proteasome [Citation21], were included from the start of the starvation treatment at the concentrations 5 mM, 10 μM or 5 μM, respectively.
Antibodies
Anti-SDS-denatured sporamin was as described [Citation22].
To generate an antibody against tobacco SYP41 protein, we first made a recombinant protein for a part of the protein as follows: A tobacco partial cDNA for tobacco SYP41 protein (clone No. BY3736, GnenBank BP131668) was chosen from our BY-2 EST clone collection [Citation23] and used as a template to amplify the coding region for the 196th to 297th position of tobacco SYP41 by PCR using primers containing Bam HI and Not I restriction sites. After digestion of the PCR product by Bam HI and Not I, the fragment was cloned into the corresponding site of pET23d expression plasmid from Novagen. The resulted plasmid was introduced into E. coli BL21(DE3) strain and the fragment of SYP41 was expressed as N-terminally T7-tagged and C-terminally His-tagged protein. The expressed protein was enriched from E. coli lysate using Ni-NTA agarose (Qiagene) chromatography and further purified by anion exchange chromatography using a MonoQ column. The resulted protein showing a single band on SDS-PAGE was used as immunogen to raise antibody in Japanese White rabbit. The antibody against SYP41 was affinity-purified from the rabbit serum using an immobilized antigen column generated using a HiTrap NHS-activated HP column (Amersham) and used for immunoblotting.
To generate an antibody against tobacco SUT2 protein, a coding region for the largest loop of this protein, corresponding to 282nd to 375th amino acids, was amplified with primers containing Bam HI and Xho I restriction sites. After digestion of amplified fragment with these restriction sites, the resulted fragment and a Sac I-Bam HI fragment containing the coding region of glutathione-S-transferase (GST) with thrombin cleavage sites at the both ends from pETGEXCT plasmid [Citation24] were cloned into Sac I and Xho I digested pET23b(+) plasmid (Novagen). The resulted plasmid was introduced into E. coli BL21(DE3) and the protein was expressed. E. coli lysate containing the T7-tag thrombin site-GST-thrombin site-SUT2 loop region-His tag protein was collected using glutathione agarose and digested with thrombin on glutathione-agarose. After that SUT2 loop region-His tag protein was purified using a Ni-NTA agarose column. The resulted protein, showing a single band on SDS-PAGE, was used to make polyclonal antibody using a New Zealand White rabbit as described above. The T7-tag-thrombin site-GST-thrombin site-SUT2 loop region-His tag protein eluted from glutathione-agarose was immobilized as above and used for the purification of antibody.
SDS–PAGE, immunoblot analysis, and fluorescence recording
To detect secreted sporamin, we first collected medium by filtration. The collected medium was mixed with SDS-sample buffer, heated and proteins in the samples were separated by SDS-PAGE. To assess the level of endogenous SUT2 and SYP41, tobacco BY-2 cells were collected by filtration, mixed with an equal volume of 5 × phosphate-buffered saline (PBS) and subjected to fifteen 30s sonication pulses at level 2.5 with a Bioruptor UCD-200TM sonicator (CosmoBio). The homogenates were centrifuged at 7,000 r.p.m. for 10 min at 4°C using a high speed refrigerated microcentrifuge MX-150 equipped with a TMP-11 rotor (TOMY) and the supernatants were collected. Supernatants of the centrifugation were mixed with SDS-sample buffer and proteins in the sample were separated by SDS-PAGE. After electrophoresis, proteins in gels were transferred onto Immobilon-FL PVDF membrane (Millipore), blocked, and then probed with either 1/500 diluted rabbit anti SDS-denatured sporamin antiserum [Citation22], 1/500 diluted anti-SUT2 antibody or 1/500 diluted anti-SYP41 antibody and then the antigen-antibody complex on the membrane were detected as described [Citation25].
To detect fluorescence fusion proteins in cells, cells were collected, homogenized, and the homogenate was centrifuged, and the resulted supernatant was collected as above. After mixing the supernatant with SDS-sample buffer, the samples were applied to the well of SDS-polyacrylamide gel without heating and proteins in samples were separated by electrophoresis. After that the gels were scanned with a Typhoon 9400 scanner (GE Healthcare Bio-sciences) using a 488 nm excitation laser at a setting of 600 V, with a 526 SP emission filter to detect the YFP fluorescence, and a 532 nm excitation laser at a setting of 600 V, with a 610BP30 filter to detect mRFP fluorescence bands. Images were analyzed using the software ImageJ (National Institutes of Health).
Confocal microscopy and image analysis
The localization of SUT2-GFP, SUT4-GFP and colocalization of SUT2-GFP and P4H1.1-mRFP, and SUT2-mRFP and YFP-SYP41 were carried out using an OLYMPUS IX80 fluorescence microscope (Olympus, Tokyo, Japan) equipped with a DSU confocal unit as described [Citation25]. To detect YFP fluorescence, filter and dichroic mirror set for GFP was used. To visualize SCAMP2-mRFP and FM1-43 with and without P4H1.1-mRFP, a Leica TCS SP8 confocal laser scanning microscope was used to record green and red fluorescence essentially as described [Citation13]. To count the numbers of punctate structures in cells, confocal images of 1 μm in thickness were taken at the center of cells which were placed on a slide glass with the long axis horizontally. Numbers puncta in these images were counted using the Image J software. In brief, 1,024 x 1,024 pixel 256 digit image was opened by Image J, adjusted color threshold by selecting Intermodes, and after selecting ROI manually to cover the target cell region, particle number in the ROI was counted using the Analyze Particles menu at settings of 4-pixel unit size, circularity 0.00–1.00, include holes, and exclude on edges. In this case, one pixel corresponds to 0.111 nm square and the backgrounds of all the images were around 87 among 256 digits. Then, the numbers of particles selected by this way was used as the number of puncta in the cell. At least 10 images were used to calculate the number of puncta in each treatment. To count the numbers of cells with punctate structure, images were collected as above and the presence and absence of puncta in cells were scored using 25 cell images. This experiment was carried out three times and the results were used for statistical analyses. To evaluate the colocalization efficiency, Colc2 plugin in ImageJ was used to calculate Pearson’s correlation coefficient using manually set the ROI under the bisection threshold regression. Average of three independent measurements using three independent images were calculated.
To visualize TGN using FM 1–43, cells at log-phase or incubated for 25 h in medium with or without sucrose were stained with FM 1–43 for 20 to 30 min as described [Citation26]. Confocal images of stained cells were collected as above and dots in the cells were counted as described above.
Measurement of polysaccharide-degrading enzymatic activities
Medium from cell culture was collected by filtration. Up to 50 μL of the collected medium was mixed with 75 mM sodium acetate buffer (pH 5.8) to make a total volume of 150 μL. After activating the immobilized substrate plates in a CPH assay kit (GlycoSpot), the mixture was added to the wells of the assay kit plate and incubated for 6 h at 26°C with gentle shaking. After incubation, the released chromophore was quantified as described [Citation27] using a SPECTRA MAX 340PC plate reader (Molecular Devices).
Measurement of sugar ester hydrolases
To measure sugar ester hydrolases, the following nitrophenyl-derivatized sugars were used; p-nitrophenyl-α-L-arabinopyranoside, p-nitrophenyl-α-D-glucopyaranoside, p-nitrophenyl-β-D-cellobioside, p-nitrophenyl-α-L-rhamnopyranoside, p-nitrophenyl-β-D-fucopyra-noside, p-nitrophenyl-α-L-arabinofuranoside, p-nitrophenyl-α-D-mannopyranoside, o-nitrophenyl-β-D-galactopyranoside, p-nitrophenyl-β-D-glucopyran-oside, p-nitrophenyl-β-D-xylopyranoside, and p-nitrophenyl-α-D-xylopyranoside. Five microliters of the culture medium collected above were mixed with 45 µL of 1.11 mM nitrophenyl-glycoside in 55.6 mM sodium acetate buffer (pH 5.8) and incubated for 6 h at 26°C. After incubation, the reaction was stopped by adding 150 µL of 0.2 M NaOH and the absorbance at 410 nm was recorded using a SPECTRA MAX 340PC.
Measurement of pectin
To prepare crude soluble polysaccharides in cell walls, we used a protocol by Eda and Kato [Citation28] with minor modifications. Cells were collected from the culture by centrifugation at 700 × g for 5 min at room temperature. One milliliter of the cell fraction was suspend in 50 mL of 50 mM EDTA-Na2, 50 mM sodium acetate buffer (pH 4.5), and incubated at 95°C for 2 h. Water phase was collected by filtration and 10 mL of the filtrate was dialyzed for 12 h against 3 L of deionized water for three times. Thereafter, the dialyzed sample was freeze-dried to give a crude polysaccharide fraction. To prepare crude polysaccharide fraction from the culture medium, medium separated from cells as above was freeze-dried. Freeze-dried sample was dissolved in 3 mL of 0.1 M MOPS buffer (pH 6.6). One hundred microliters of the solubilized sample was mixed with 10 µL of 0.2% ruthenium red and incubated for 5 min at room temperature. After incubation, 10 µL of 0.6 M CaCl2 was combined with the mixture and immediately centrifuged at 15,000 x g for 10 min. The precipitate was dissolved in 100 µL of 0.5 M EDTA pH 8.0 by ultrasonic disintegration using a Bioruptor UCD-200TM sonicator (CosmoBio). Then, the absorbance of 535 nm was measured using a spectrophotometer U-0080D (HITACHI). Finally, the amount of pectin in 1 mL cell culture was calculated.
Results
Localization of a tobacco ortholog of tomato sucrose-transporter SUT2 and its degradation under sucrose starvation
To investigate the distribution and amount of sucrose transporter-related proteins in tobacco BY-2 cells, we first cloned two tobacco sucrose transporter ortholog cDNAs. One of them is a tobacco ortholog of the tomato sucrose transporter-like protein SUT2, which has been predicted to be a putative sucrose sensor [Citation29]. The pilot 5ʹ-sequence of clones from the full-length cDNA library of tobacco BY-2 cells [Citation6] allowed the identification of a clone BY11A1E11, which encodes an amino acid sequence that is closely related to the N-terminal sequence of tomato SUT2 protein. After sequencing the whole clone, we confirmed that this cDNA (DDBJ accession No. LC497468) encodes an ortholog of the tomato SUT2 protein (91% identity among 606 amino acids), thus we designated the encoded protein as SUT2 in tobacco. The nucleotide and encoded amino acid sequences of this cDNA are identical to the predicted Nicotiana tabacum sucrose transport protein SUC3-like (LOC107775926) transcript variant X1 mRNA and corresponding protein, respectively.
The other protein is a tobacco ortholog of tomato SUT4 sucrose transporter [Citation30]. An EST sequence, BY231, from our normalized cDNA library from tobacco BY-2 cells [Citation23] encode an amino acid sequence that corresponds to the central part of the tomato SUT4 protein. Five-prime and 3ʹ extension from this sequence using the full-length cDNA library [Citation6] as a template, we generated a full-length sequence for the tobacco SUT4 homolog. Thereafter, the full-length cDNA clone for this protein was cloned using primers set at the 5ʹ and 3ʹ non-coding regions and designated the encoding protein as tobacco SUT4. The nucleotide and encoded amino acid sequences of this clone (DDBJ accession No. LC497467) are identical to the predicted Nicotiana tabacum sucrose transport protein SUC4-like (LOC107798597) transcript variant X2 mRNA and corresponding protein, respectively, and nearly identical to the characterized NtSUT4 cDNA [Citation31] and encoding protein, namely 98% and 99% identity, respectively.
We generated expression constructs for the fusion proteins with these transporters and GFP or monomeric RFP (mRFP) and stably expressed them in tobacco BY-2 cells. Then, we investigated the distributions of the SUT2-GFP and the SUT4-GFP fusion proteins in 3-day-old BY-2 cells using a confocal microscope. The signal of the SUT2-GFP was detected as dots structures (), SUT2-GFP) as in the case of the tomato SUT2-YFP fusion protein expressed under the CaMV35S promoter in transgenic tobacco [Citation32]. The fluorescence of SUT4-GFP was detected on vacuolar membrane (), SUT4-GFP), which is the same place reported previously using another ortholog of tobacco SUT4 fused with GFP [Citation31]. We then analyzed the localization of the tobacco SUT2 protein after co-expression of SUT2-GFP and a Golgi marker P4H1.1-mRFP ([Citation6], previously called PH-mRFP). We found that SUT2-GFP and P4H1.1-mRFP did not co-localize well (Pearson’s correlation coefficient = 0.37) although most of these signals were located side-by-side (). In contrast, the punctate signals of SUT2-mRFP and Yellow fluorescence protein-SYP41 fusion (YFP-SYP41), which is localized in the TGN and the SVC [Citation6], co-localized relatively well in co-expressed tobacco cells (Pearson’s correlation coefficient = 0.64) (). Although many puncta of SUT2-mRFP and YFP-SYP41 were co-localized in cells, some of them were located side-by-side ()). This difference of their localization in cells suggested that SUT2-mRFP was localized solely in TGN whereas YFP-SYP41 is localized in both TGN and SVC [Citation6].
Figure 1. Tobacco SUT2 is a TGN-localizing protein that is degraded under the sucrose-limitation condition. (a) Distribution of SUT2-GFP and SUT4-GFP fusion proteins in 3-day-old BY-2 cells. Images collected by differential interference contrast microscopy (DIC) and confocal fluorescence microscopy at the wavelength for green fluorescence protein detection (GFP) were shown. (b) Association of SUT2-GFP with a Golgi marker P4H1.1-mRFP. Confocal images of GFP and RFP detection conditions and the merged images of these two records were shown. The most left image is an enlarged image of the boxed area in the merged image. (c) Co-localization of SUT2-mRFP and YFP-SYP41. Confocal images of GFP and RFP detection conditions and the merged images of these two records were shown. The most left image is an enlarged image of the boxed area in the merged image. (d) Starvation-induced degradation of SUT2-GFP. Representative gel image (upper) and quantified result (lower graph) of SUT2-GFP, SUT4-GFP, and P4H1.1-mRFP in cells that were cultured in the various medium for 24 h. Experiments were repeated twice and obtained conceptually identical results. Average of two experiments were shown in these graphs. Suc, sucrose-containing medium; Man, mannitol containing, and sucrose-free medium, Glc, glucose-containing and sucrose-free medium, -N, nitrogen-free medium, -P, phosphate-free medium. (e) Time-course of the decrease of SUT2-GFP fluorescence in the normal and sucrose-free medium. (f) Decrease of endogenous SUT2 under sucrose-limitation condition. Equal amount of microsomal proteins from tobacco BY-2 cells that have been cultured for 24 h in either normal or sucrose-free medium were separated by SDS-PAGE, transferred to PVDF membrane and probed with a specific antibody against tobacco SUT2. Bars in a-c represent 10 μm.
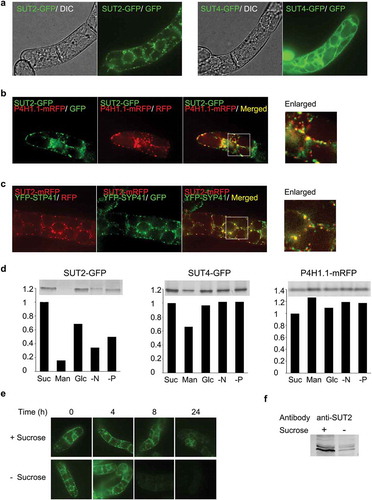
We then investigated the level of these proteins under nutrition restricted conditions. We found that SUT2-GFP was decreased less than 20% relative to control under sucrose- or metabolizable carbon source-depleted conditions within 24 h of incubation (), SUT2-GFP, Man vs Suc). On the other hand, SUT4-GFP and P4H1.1-mRFP levels were not changed significantly under the same conditions (). Time-course analysis of the decrease of SUT2-GFP under a confocal microscope in normal and sucrose-free media indicated that most of the punctate SUT2-GFP signal had disappeared within 8 h of starvation (). To confirm that the decrease of the SUT2-GFP signal under the sucrose-starved condition was independent to the transgene, we analyzed the level of endogenous SUT2. We found that the endogenous SUT2 was also decreased significantly during the 24 h incubation in sucrose-free medium ().
Another TGN-localizing protein, SYP41, was also decreased under sucrose limitation
As described above, we found that SUT2-GFP was decreased under a sucrose-starved condition. We thus investigated whether this decrease might also occur in other TGN-localizing protein. We chose SYP41 as a target because we previously showed that this protein is localized in TGN and its derived organelle SVC [Citation6]. YFP-SYP41 was expressed in tobacco BY-2 cells. The resulted cells were incubated with the nutrient-limited medium as in the case of SUT2-GFP. Thereafter, the level of YFP-SYP41 was quantified. YFP-SYP41 fluorescence decreased under sucrose starvation (), Man). To further confirm that SYP41 was decreased in tobacco cells upon exposure to sucrose-free condition, immunoblotting was carried out with the same condition to ) using a specific antibody to SYP41. Decrease of endogenous SYP41 was observed as in the case of SUT2 ().
Figure 2. Another TGN-localizing protein, SYP41, was also degraded under sucrose limitation. (a) YFP-SYP41 gel image and quantified results. Decrease of YFP-SYP41 fluorescent under sucrose-limitation condition. Equal amount of microsomal proteins from tobacco cells that have been cultured for 24 h in either normal or sucrose-free medium were separated by SDS-PAGE and fluorescence images recorded as described in the materials and methods section. Experiments were repeated twice and obtained conceptually identical results. Average of the two experiments were shown. (b) Immunoblot detection of endogenous SYP41. Equal amount of microsomal proteins from tobacco cells that has been cultured for 24 h in either normal or sucrose-free medium were separated by SDS-PAGE, transferred to PVDF membrane and probed with a specific antibody against tobacco SYP41. Arrowhead indicates the tobacco SYP41 protein recognized by this antibody.
Abolishment of TGN and SVC localization of SCAMP2-mRFP
SCAMP2 is localized at the TGN, SVC, and PM in tobacco BY-2 cells grown in the regular medium [Citation6]. We analyzed whether this localization pattern could be changed under the sucrose-limitation condition by observing the SCAMP2-mRFP distribution using a confocal microscope. We found that the punctate localization of SCAMP2-mRFP was disappeared under sucrose starvation condition and red fluorescence was prominent in the vacuoles of the same cell (). Quantitative analyses of these images indicated that both the number of cells with red dots and the number of dots in cells decreased under the sucrose-limitation condition (,). These observations suggested that SCAMP2-mRFP that were present at TGN and SVC in cells under sucrose-rich condition were transported to the vacuole for degradation upon exposure the cells to the sucrose-free medium.
Autophagy would be involved in the degradation
As described above, red fluorescence was prominent in vacuoles of cells expressing SCAMP2-mRFP that were incubated in the sucrose-free medium (). This observation suggested that the degradation of TGN- and SVC-localizing proteins were mediated by autophagy. To get another evidence that the degradation was mediated by autophagy, inhibitors to autophagy, namely E-64 and 3-MA, were included during the induction of the sugar starvation-mediated degradation of SUT2-GFP. The dot structures of SUT2-GFP were not decreased in the presence of either E-64 or 3-MA (). Furthermore, the amount of SUT2-GFP was not decreased significantly and the level of the degradation products of SUT2-GFP were not increased significantly in the presence of either E-64 and 3-MA under the sucrose-starved condition (). On the other hand, MG-132, which is a specific inhibitor for proteasome, did not prevent the SUT2-GFP degradation (). Likewise, YFP-SYP41 degradation was suppressed by E-64 and 3-MA under the sucrose starvation (). These observations indicated that autophagy is likely the mechanism of the degradation of these TGN-localized proteins.
Figure 3. TGN and SVC localization of SCAMP2 was abolished in the sucrose-starved cells. (a) Fluorescence images of NtSCAMP2-mRFP. Confocal images of red fluorescence in 3-day old cells (left), cells in 24 h in normal media (center) or sucrose-limitation condition (right) were shown. Bars, 10 μm. (b) Quantified results of the cell with red dots. Number of BY-2 cells with and without red dots were counted and the percentage of cells with dots were calculated as described in the materials and methods. Average of three independent experiments for 3-day old cells (3d), 24 h in normal media (+Suc) and sucrose-limitation condition (-Suc) were shown. Error bar, SD. (c) Quantified results of a number of dots in cells. Number of red dots in the cell was counted calculated as described in the materials and methods. Average of three independent experiments for 3 day old cells (3d), 24 h in normal media (+Suc) and sucrose-limitation condition (-Suc) were shown. Error bar, SD.
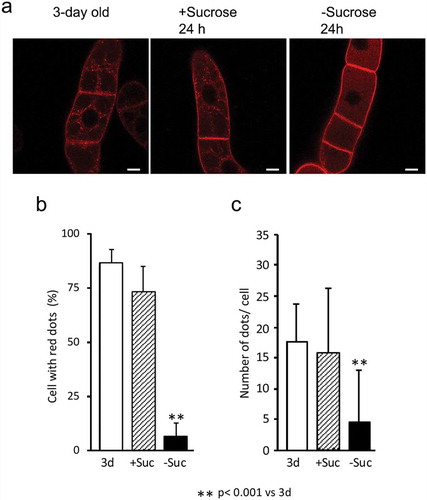
Figure 4. Autophagy inhibitors prevent the degradation of SUT2-GFP and YFP-SYP41. (a) Confocal fluorescence images of SUT2-GFP-expressing tobacco cells that has been cultured in normal (+) and sucrose-free (-) medium with inhibiters for autophagy (E-64 or 3-MA) at concentrations described in the Materials and methods section or without inhibiter (Control) for 24 h. Microscopic images were collected as described in the legend to ). The backgrounds of these images were adjusted between images by subtracting the average intensity of the non-cell part of each image using ImageJ. (b) SUT2-GFP cells were cultured as in a in the absence (Control) and presence of indicated inhibitors for 24 h in medium with (+) or without (-) sucrose. Equal amounts of microsomal proteins were separated by SDS-PAGE and RFP fluorescence in the gel was recorded as described in the Materials and methods section. Migration positions of SUT2-GFP and its degradation products were indicated at the left of the gel image. (c) Effect of autophagy inhibitors on the degradation of YFP-SYP41. Tobacco cells expressing YFP-SYP41 were incubated with or without inhibitors as described in the legend to b. YFP-SYP41 fluorescence was visualized after separation of proteins as described in the legend to ).
TGN is present in the starved cells
As described above, we found that punctate signals of three TGN-localizing proteins, namely SUT2, SYP41, and SCAMP2-mRFP, disappeared under sucrose-starvation. The latter two proteins also localized to the SVC, and the signals for the SVC were also not detectable under the sucrose-limitation condition. To investigate whether the TGN itself is disappeared or not in cells incubated in sucrose-free medium, we analyzed the existence of a non-proteinous TGN marker in cells that had been incubated in the sucrose-free medium. We used FM1-43 to trace TGN, as this dye reaches to TGN upon being endocytosed from the PM at around 30 min of incubation at room temperature, then is transported from TGN to tonoplast in tobacco within an hour in tobacco BY-2 cells grown in the regular medium [Citation26]. After incubation of tobacco cells in the normal or sucrose-free medium for approximately 25 h, tobacco cells were incubated with FM1-43 for 20–40 min and intracellular puncta with green fluorescence were visualized by confocal microscopy. Green-fluorescent puncta were observed in both cases () top).
Figure 5. TGN is present in the starved cells. (a) Confocal fluorescence images of tobacco cells that have been cultured in normal (+Sucrose) and sucrose-free (-Sucrose) medium for 23 h were incubated with FM 1–43 for 30 min. Upper panels, non-transformed BY-2 cells; lower panels, transformed BY-2 cells expressing a Golgi marker P4H1.1-mRFP. Inserts at the top right of the images are the enlarged image of the boxed area. Arrowheads indicate the green dots located proximate to the red dot of Golgi apparatus. Bars, 10 μm. (b) Quantified results of FM1-43 dots in the cells. Number of dots in cells were counted as described in the materials and methods from images taken from cells that have been incubated with FM 1–43 for 20 to 40 min. Average of three independent experiments were shown. Error bar, SD.
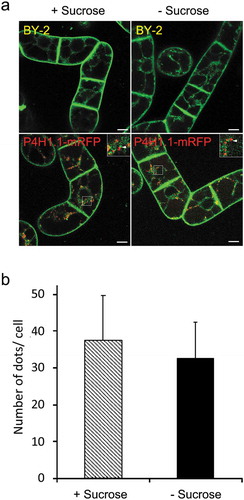
To confirm that these punctate signals represented the presence of TGN, transformed tobacco cells expressing P4H1.1-mRFP were incubated in normal or sucrose-free medium, stained with FM1-43 as described above, and then examined for both green and red fluorescence. Almost all the green and red puncta were located side-by-side in both cases () bottom). Thus, the green punctate structures found in sucrose-starved cells were indeed TGN, as in the case of normal cells. The numbers of green dots were counted from the images, and these numbers were not different significantly between cells incubated in normal and sucrose-free medium (). This result suggested that TGN was not degraded under the sucrose starvation.
Inhibition of pectin synthesis in sucrose-starved tobacco cells
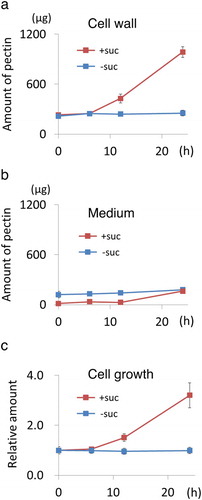
As described above, two TGN-localized proteins, namely SUT2 and SYP41, were selectively degraded, and SVC was disappeared by degrading SYP41 and a subset of SCAMP2. Because the SVC is a TGN-derived organelle that transports pectin to the cell wall from the Golgi [Citation6], we hypothesized that the disappearance of this transportation machine (SVC) would be associated with the cessation of the synthesis and deposition of its cargo (pectin) in starved cells. To address this possibility, we analyzed the amount of pectin in cells walls and medium of the tobacco cell culture in normal and sucrose-free medium () after developing a rapid quantification method of pectin using ruthenium red (see materials and methods and supplemental Figure 1). We found that pectin accumulated in the cell wall fraction was increased when cells were cultured in normal medium but were not increased in cells incubated in sucrose-free medium (). Small amount of pectin was detected in the medium fraction in both cases (). The increase in pectin in the cell wall fraction in cells incubated with the normal medium can be explained by the growth of cells (). These observations indicated that pectin synthesis and the secretion to cell wall continued in cells grown in normal medium and suggested that neither pectin synthesis nor secretion to the cell wall was active in cells incubated in the sucrose-free medium.
Figure 6. Secretion of pectin was inhibited from sucrose-starved tobacco cells. (a) Time-course analysis of the change of pectin in cell wall fraction prepared from cells cultured in normal and sucrose-free medium. Amount of pectin corresponding to 1 mL culture was shown. (b) Time-course analysis of the change of pectin in medium fraction as in a. (c) Time-course analysis of the change of the relative amount of cell volume in a unit culture volume. (a-c) Data are means ± SD. (n = 5).
Secretion of hydrolases and sporamin, a model secretory protein
We analyzed the secretion of a model soluble secretory protein, sporamin, and hydrolases. Sporamin is a storage protein in sweet potato and was secreted efficiently and rapidly from tobacco BY-2 cells when a mutant precursor lacking vacuole-targeting information was expressed in this cell line [Citation17]. Sporamin secretion was not inhibited under sucrose starving conditions (). Although the amounts of sporamin secreted differed between sucrose-rich and sucrose-free conditions, this difference may have been caused by the different numbers of cells in a unit volume of culture ().
Figure 7. Secretion of a model soluble protein sporamin from cells cultured in normal and sucrose-free medium. Transformed tobacco cells expressing a secretory form of sporamin [Citation17] was used in this experiment. (a) Time-course analysis of the increase of sporamin in the medium. Immunoblot with equal amounts of medium fractions in each lane was shown. (b) Results of the quantification of immunoblot. Experiments were repeated twice and obtained conceptually identical results.
![Figure 7. Secretion of a model soluble protein sporamin from cells cultured in normal and sucrose-free medium. Transformed tobacco cells expressing a secretory form of sporamin [Citation17] was used in this experiment. (a) Time-course analysis of the increase of sporamin in the medium. Immunoblot with equal amounts of medium fractions in each lane was shown. (b) Results of the quantification of immunoblot. Experiments were repeated twice and obtained conceptually identical results.](/cms/asset/54f6356f-8cf1-49d2-a344-57a8a3df5a29/tbbb_a_1756736_f0007_oc.jpg)
We also investigated the secretion of enzymes, especially hydrolases, because such activities are present in the cell walls in plants and because many of them are easy to measure. To investigate the activity of polysaccharide-degrading enzymes, medium from sucrose existence or sucrose-free cultures were incubated with indicated glycan derivatives, which were chromophore-tagged and immobilized. We then quantified the amounts of chromophores released into the medium. Released chromophores were detected in both the sucrose-existing and sucrose-free medium after incubation with many of the substrate glycans (). The levels of hydrolysis activities against many glycans were not different significantly, although hydrolyzing activities against pullulan and pectic-galactan were specifically observed in medium from sucrose-existing and sucrose-free cultures, respectively.
Figure 8. Glycan and sugar-ester hydrolases were secreted from cells incubated in both normal and sucrose-free medium. Culture medium of non-transformed tobacco BY-2 cells incubated for 24 h in either normal or sucrose-free medium was used in this study. (a) Glycan hydrolase activities were measured as described in materials and methods using chromophore-tagged and immobilized substrates using CPH assay kit as described in the materials and methods section. Relative amounts of eluted chromophore-tag released from immobilized substrates corresponding to 50 μL of medium was shown. (b) Sugar-ester hydrolases activities. Amount of released nitrophenol absorbance corresponding to 5 μL of medium in an hour was shown for each substrate. Red bars indicate the amount of nitrophenol under sucrose exist condition and blue bars indicates the amount of nitrophenol under sucrose-limitation condition.
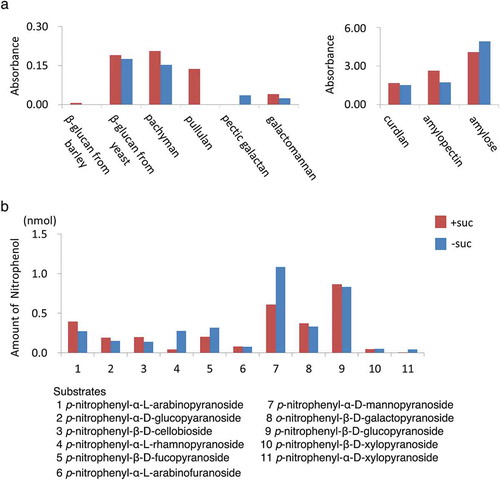
We also analyzed the presence of sugar-ester hydrolases (). Medium from the sucrose-containing or sucrose-free cultures was incubated with nitrophenyl-sugar esters and released nitrophenol was quantified. Activities for all the measured hydrolases were detectable in the medium in both cases. Most of the activities in these conditions were not different significantly, although α-L-rhamnopyranosidase, α-D-mannopyranosidase, and α-D-xylopyranosidase activities were higher in medium without sucrose. Taken together, these results showed that protein secretion was not arrested under the sucrose starved condition.
Discussion
We observed that both the level of endogenous SUT2 protein and the level of SUT2-GFP decreased significantly under the sucrose-starved condition (). Fluorescent dot structure of SUT2-GFP in the cell was diminished under the same condition (). Another TGN-localizing protein, SYP41, and its fluorescent derivative YFP-SYP41, which is also localized in SVC [Citation6], also decreased significantly under the sucrose-starved condition (). Likewise, the numbers of intracellular dot structure of SCAMP2-mRFP, which represent TGN and SVC [Citation6] decreased significantly in cells incubated in the sucrose-free medium (). In contrast, SUT4-GFP, which is localized in the tonoplast [Citation31], and P4H1.1-mRFP, which is localized in the Golgi [Citation18], were not degraded significantly under sucrose starvation ().
Staining of endomembrane organelles using FM1-43 indicated that TGN would be present in cells even under the sucrose starvation (). However, we cannot rule out a possibility that some of the FM1-43 positive dots might be the signal of multivesicular bodies, as FM1-43 is also directed to this organelle in Arabidopsis [Citation33]. Further analysis, such as an electron microscopic observation using a fixable derivative of FM1-43 and an antibody against this compound, will be required to address whether some of the punctate structures of FM1-43 in sucrose-starved cells are multivesicular bodies or not. In addition, it will be interesting to carry out electron microscopy of the starved cells to address the morphology of TGN in the starved cells. Unfortunately, our attempt to get electron micrographs of starved cells after fixation using a high-pressure freezer, the method of which allows to retain the SVC structure in normal cells [Citation6], has not been successful to date. Not only the morphology but also the function of TGN might be changed in starved cells as a subset of proteins in this organelle were degraded ( and ). Further analysis of other TGN localized proteins will reveal the changes of TGN function under the starvation.
In cells, there are two types of protein-degrading system, the vacuolar (or lysosomal) degradation, which involves autophagy, and proteasome-mediated degradation. Autophagy is a common system in eukaryotes to degrade proteins and organelles in lysosomes or vacuoles [Citation10]. Proteasome system is a system to degrade ubiquitinated proteins in the cytoplasm selectively [Citation34]. Analysis using autophagy and proteasome inhibitors revealed that the degradation of TGN-localized proteins under sucrose starvation was inhibited by autophagy inhibitors but not by a proteasome inhibiter (). In addition, the presence of red fluorescence in the vacuoles of SCAMP2-mRFP-expressing starved cells () right) suggests that the degradation of TGN and SVC-localizing proteins was taking place in the vacuoles by autophagy. We reported previously that a protein aggregate generated from a fusion protein of cytochrome b5 and red fluorescent protein (Cyt b5-RFP) is a good substrate for autophagy under nutrient-starved conditions in tobacco BY-2 cells [Citation12]. However, the degradation rate of Cyt b5-RFP under sucrose starvation was slower than that of the TGN-localized proteins observed in this work, since over half of Cyt b5-RFP was intact in cells incubated for 24 h in sucrose-free medium () in [Citation12]) whereas the punctate signal of SUT2-GFP was almost invisible within 8 h in sucrose-free medium ()). Thus, the degradation of TGN- and SVC-localized proteins observed in this work will be a specific and regulated autophagy that were induced rapidly upon the limitation of sugars in the medium. Further inhibitor treatment [Citation35] and/or isolation and proteomic analysis of autolysosomes [Citation36] from sucrose-starved BY-2 cells expressing SUT2-GFP or YFP-SYP41 will reveal this possibility.
Although further analysis is required to investigate whether this degradation is mediated by selective autophagy, it is interesting to note that an autophagy-like degrading system of Golgi proteins, called GOMED, has been reported in yeast and mammals [Citation37]. Therefore, we cannot rule out a possibility that a similar system might be involved in the degradation of TGN- and SVC- proteins observed in this work. Another possibility is that the alteration of the transport destination of SVC might be changed from PM to the vacuole, and a novel transport pathway of TGN proteins to vacuoles might be induced upon the starvation. The third possibility is that the TGN- and SVC- protein degradation might take place after these proteins are transported to PM. Such PM-to-vacuole transport for degradation after ubiquitination of target proteins has been reported in plants (summarized in [Citation38]), and the degradation machineries sometimes interact with autophagic systems [Citation39]. Future analysis will be required to clarify how a subset of TGN-localizing proteins as well as SVCs are directed to vacuoles for degradation.
We showed previously that SVC-mediated transport is responsible for exporting large quantities of pectin to the extracellular space in rapidly-growing plant cells [Citation6]. The number of SVC and related structures decreased when BY-2 cells reached to the stationary phase of growth [Citation40]. Under sucrose starvation, cell growth was arrested and pectin amount in the cell walls was nearly constant (), suggesting that pectin synthesis is arrested in cells cultured in sucrose-free medium. In contrast, when cells were cultured in normal medium, both cell growth and pectin synthesis continued (). This observation as well as the decrease of SVC under sucrose limitation suggested that both pectin synthesis machinery and pectin transport machinery, i.e. SVC, appears to be coordinately regulated by the supply of sugars from the outside of the cell. Future analysis will be necessary to reveal that this seemingly cooperative phenomena depend on the same sugar-dependent regulation mechanism.
It has been suggested that the tomato ortholog of tobacco SUT2 is the putative sensor for sucrose [Citation30]. Downregulation of the expression of tomato SUT2 reduced the fruit size, number of seeds in the fruit, and prevent the elongation of pollen tube with a decrease in sucrose uptake in vitro [Citation41]. The same group demonstrated that tomato SUT2 and its interacting protein MSBP1 are related to brassinosteroid signaling and symbiosis of arbuscular mycorrhizal fungi [Citation42,Citation43]. Since brassinosteroid is involved in cell proliferation and cell expansion [Citation44], all the knowledges about tomato SUT2 indicate that this protein is involved in events that increase the PM and cell wall. Our present observation that the depletion of sucrose from the culture medium prevented the growth of cells and downregulated the level of SUT2 protein, whereas in the normal medium the cell growth continued in the presence of SUT2 protein () also indicates that the SUT2 proteins (at least in Solanaceae) is involved in PM and cell wall proliferation.
How does this sugar-sensing take place? One hypothesis, based on our observation that endocytosis is active in BY-2 cells under both sucrose-rich and sucrose-free conditions (), is that the endocytosed apoplastic fluid reaches to the TGN, where SUT2 localizes, and if sucrose is present in the medium, a fraction of that sucrose reaches to the lumen of TGN by endocytosis. Such sucrose in TGN lumen stabilizes SUT2, and SUT2 at TGN would transduce a signal to cytoplasmic machineries to indicate that sucrose is available in the apoplast, and thereby prevent the degradation of the SVC and a subset of TGN-localizing proteins. However, in the case that sucrose is the absence in apoplast, endocytosed fluid in the TGN would not contain sucrose, and the absence of sucrose in the TGN lumen would somehow destabilize SUT2 and induce the degradation of a subset of TGN- and SVC-localizing proteins. Future elucidation of the degradation/stabilization mechanism of the SUT2 protein will be needed to confirm this possibility.
The TGN is an important organelle that sort proteins and glycans for delivery to proper destinations, such as the vacuoles, PM, and cell wall [Citation2]. However, we observed that a subset of TGN proteins were selectively degraded upon sucrose starvation ( and ). In contrast, the secretions of sporamin and hydrolases were not inhibited ( and ). When TGN-localized proteins decreased in cells, it is possible that the transport system is changed. The absence of SVC in sucrose-starved cells () is a clear indication that a mass secretory pathway of pectin was attenuated upon sucrose starvation. These results indicated that there are at least two distinct secretory pathways in tobacco BY-2 cells, and one of them, which transports hydrolases to the extracellular space, remained active even after a subset of TGN-localized proteins were degraded.
Under nutrient starvation, autophagy plays a role in recycling nutrition in cells [Citation10]. Sucrose starvation activates autophagy in tobacco BY-2 cells [Citation11]. Therefore, sucrose-starved tobacco cells need to transport a large quantity of hydrolytic enzymes to the vacuoles for autophagic degradation. In addition, the same cell needs to secrete hydrolytic enzymes to the extracellular space to degrade and to recycle cell wall materials as in the case of darkened A. thaliana plant [Citation45]. Because pectin (pectic-galactan)-degradation activity was only observed in medium from sucrose-free culture (), tobacco cells under starvation may degrade pectin in the cell wall as an energy source. The need for active transport of hydrolytic enzymes in the starved cells might be the reason why TGN was present even though a subset of TGN-localizing proteins were degraded under sucrose-limitation.
One of the TGN-localizing proteins that is the target of sucrose-starvation-dependent degradation is a tobacco SYP4 class SNARE protein SYP41 (). Unlike Arabidopsis thaliana, diploid Nicotiana species such as N. sylvestris and N. tomentosiformis have only one SYP4 gene. As tobacco (N. tabacum) is an allotetraploid of these two species, tobacco BY-2 cells should have up to two different SYP4 proteins originated from these mother species. Actually, the SYP41 protein that we used for the YFP fusion as well as to generate antibody is identical to the SYP4 protein in N. tomentosiformis and is only one amino acid different from that in N. sylvestris. In A. thaliana, there are three different SYP4-class SNAREs and they have overlapping functions [Citation46] as well as the localization to TGN [Citation47]. One of them, SYP43 is localized to not only Golgi-associated TGN but also to GI-TGN [Citation48]. Since GI-TGN is involved in the secretion of hydrolases from the cell [Citation8] and since GI-TGN and SVC seems to be related in function, the downregulation of the level of SYP41 () under the starvation condition suggests a decrease in trafficking efficiency. Future analysis of both the speed and volume of secretion in sucrose-starved BY-2 cells will reveal how the downregulation of SYP41 affects trafficking.
In summary, we found that proteins which were localized in the TGN and SVC in rapidly growing tobacco BY-2 cells were degraded under a sucrose starvation condition by a mechanism that is likely autophagy. On the other hand, proteins that are localized in the Golgi apparatus and tonoplast were not degraded significantly. Furthermore, a subfraction of SCAMP2 proteins localizing to the TGN and SVC were degraded in the vacuoles without affecting the localization of this protein at the PM. These results as well as the presence of TGN with nearly equal numbers in both non-starved and starved cells suggested that a subset of TGN and SVC localized proteins are degraded selectively under the starvation to adjust the endomembrane transport system to the starved condition. Analysis of pectin in cell walls and culture medium indicated that the secretion or biosynthesis of pectin was suppressed under the starvation. In contrast, secretion of a model secretory protein, glycan hydrolases, and sugar-ester hydrolases were not prevented. These changes in the endomembrane system observed in this work will be an adjustment mechanism to withstand energy deficiency in plant cells.
Author contribution
K. M. formulated the research, K. M., Y. O. and S. A. designed experiments, H. N. and K. M. developed method, all authors performed experiments, Y. O., K. M. and S. A. analyzed data, and K. M. and Y. O. wrote the manuscript.
Supplemental_figure_1.pdf
Download PDF (26.4 KB)Acknowledgments
We thank Dr. Kiminori Toyooka at RIKEN Center for Sustainable Resource Science for discussion, and Dr. Koji Yuasa at RIKEN Plant Science Center and Ms. Fumiko Watanabe at Faculty of Agriculture, Kyushu Univ. for the production of recombinant proteins.
Disclosure statement
No potential conflict of interest was reported by the authors.
Supplementary material
Supplemental data for this article can be accessed here.
Additional information
Funding
References
- Jürgens G. Membrane trafficking in plans. Annu Rev Cell Dev Biol. 2004;20(1):481–504.
- Jackson CL. Mechanisms of transport through the Golgi complex. J Cell Sci. 2009;122(4):443–452.
- Dupree P, Sherrier DJ. The plant Golgi apparatus. Biochim Biophys Acta Mol Cell Res. 1998;1404(1–2):259–270.
- S-J K, Brandizzi F. The plant secretory pathway: an essential factory for building the plant cell wall. Plant Cell Physiol. 2014;55(4):687–693.
- Drakakaki G. Polysaccharide deposition during cytokinesis: challenges and future perspectives. Plant Sci. 2015;236:177–184.
- Toyooka K, Goto Y, Asatsuma S, et al. A mobile secretory vesicle cluster involved in mass transport from the Golgi to the plant cell exterior. Plant Cell. 2009;21(4):1212–1229.
- Viotti C, Bubeck J, Stierhof Y-D, et al. Endocytic and secretory traffic in Arabidopsis merge in the trans-Golgi network/early endosome, an independent and highly dynamic organelle. Plant Cell. 2010;22(4):1344–1357. .
- Uemura T, Nakano RT, Takagi J, et al. A golgi-released subpopulation of the trans-golgi network mediates protein secretion in arabidopsis. Plant Physiol. 2019;179(2):519–532. .
- Shimada T, Takagi J, Ichino T, et al. Plant Vacuoles. Annu Rev Plant Biol. 2018;69(1):123–145.
- Marshall RS, Vierstra RD. Autophagy: the master of bulk and selective recycling. Annu Rev Plant Biol. 2018;69(1):173–208.
- Moriyasu Y, Ohsumi Y. Autophagy in tobacco suspension-cultured cells in response to sucrose starvation. Plant Physiol. 1996;111(4):1233–1241.
- Toyooka K, Moriyasu Y, Goto Y, et al. Protein aggregates are transported to vacuoles by a macroautophagic mechanism in nutrient-starved plant cells. Autophagy. 2006;2(2):96–106.
- Tasaki M, Asatsuma S, Matsuoka K. Monitoring protein turnover during phosphate starvation-dependent autophagic degradation using a photoconvertible fluorescent protein aggregate in tobacco BY-2 cells. Front Plant Sci. 2014;5:172.
- Sano T, Kuraya Y, Amino S, et al. Phosphate as a limiting factor for the cell division of tobacco BY-2 cells. Plant Cell Physiol. 1999;40(1):1–8.
- Riou-Khamlichi C, Menges M, Healy JMS, et al. Sugar control of the plant cell cycle: differential regulation of arabidopsis D-type cyclin gene expression. Mol Cell Biol. 2000;20(13):4513–4521.
- Ogden M, Hoefgen R, Roessner U, et al. Feeding the walls: how does nutrient availability regulate cell wall composition? Int J Mol Sci. 2018;19(9):2691.
- Matsuoka K, Nakamura K. Propeptide of a precursor to a plant vacuolar protein required for vacuolar targeting. Proc Natl Acad Sci USA. 1991;88(3):834–838.
- Yuasa K, Toyooka K, Fukuda H, et al. Membrane-anchored prolyl hydroxylase with an export signal from the endoplasmic reticulum. Plant J. 2005;41(1):81–94.
- Nagata T, Okada K, Takebe I, et al. Delivery of tobacco mosaic virus RNA into plant protoplasts mediated by reverse-phase evaporation vesicles (Liposomes). Mol Gen Genet. 1981;184(2):161–165.
- Takatsuka C, Inoue Y, Matsuoka K, et al. 3-Methyladenine inhibits autophagy in tobacco culture cells under sucrose starvation conditions. Plant Cell Physiol. 2004;45(3):265–274.
- Yanagawa Y, Hasezawa S, Kumagai F, et al. Cell-cycle dependent dynamic change of 26S proteasome distribution in tobacco BY-2 cells. Plant Cell Physiol. 2002;43(6):604–613. .
- Matsuoka K, Matsumoto S, Hattori T, et al. Vacuolar targeting and posttranslational processing of the precursor to the sweet potato tuberous root storage protein in heterologous plant cells. J Biol Chem. 1990;265(32):19750–19757.
- Matsuoka K, Demura T, Galis I, et al. A comprehensive gene expression analysis toward the understanding of growth and differentiation of tobacco BY-2 cells. Plant Cell Physiol. 2004;45(9):1280–1289. .
- Sharrocks AD. A T7 expression vector for producing N- and C-terminal fusion proteins with glutathione S-transferase. Gene. 1994;138(1–2):105–108.
- Liu J, Hayashi K, Matsuoka K. Membrane topology of Golgi-localized probable S-adenosylmethioninedependent methyltransferase in tobacco (Nicotiana tabacum) BY-2 cells. Biosci Biotechnol Biochem. 2015;79(12):2007–2013.
- Emans N, Zimmermann S, Fischer R. Uptake of a fluorescent marker in plant cells is sensitive to brefeldin A and wortmannin. Plant Cell. 2002;14(1):71–86.
- Kračun SK, Schückel J, Westereng B, et al. A new generation of versatile chromogenic substrates for high-throughput analysis of biomass-degrading enzymes. Biotechnol Biofuels. 2015;8(1):70. .
- Eda S, Kato K. Pectin isolated from the midrib of leaves of Nicotiana tabacum. Agric Biol Chem. 1980;44(12):2793–2801.
- Barker L, Kühn C, Weise A, et al. SUT2, a putative sucrose sensor in sieve elements. Plant Cell. 2000;12(7):1153–1164. .
- Weise A, Barker L, Kühn C, et al. A new subfamily of sucrose transporters, SUT4, with low affinity/high capacity localized in enucleate sieve elements of plants. Plant Cell. 2000;12(8):1345–1355. .
- Okubo-Kurihara E, Higaki T, Kurihara Y, et al. Sucrose transporter NtSUT4 from tobacco BY-2 involved in plant cell shape during miniprotoplast culture. J Plant Res. 2011;124(3):395–403.
- Krügel U, Kühn C. Post-translational regulation of sucrose transporters by direct protein-protein interactions. Front Plant Sci. 2013;4:237.
- Wang F, Shang Y, Fan B, et al. Arabidopsis LIP5, a positive regulator of multivesicular body biogenesis, is a critical target of pathogen-responsive MAPK cascade in plant basal defense. PLoS Pathog. 2014;10(7):e1004243.
- Miricescu A, Goslin K, Graciet E. Ubiquitylation in plants: signaling hub for the integration of environmental signals. J Exp Bot. 2018;69(19):4511–4527.
- Yano K, Yanagisawa T, Mukae K, et al. Dissection of autophagy in tobacco BY-2 cells under sucrose starvation conditions using the vacuolar H(+)-ATPase inhibitor concanamycin A and the autophagy-related protein Atg8. Plant Signal Behav. 2015;10(11):e1082699.
- Takatsuka C, Inoue Y, Higuchi T, et al. Autophagy in tobacco BY-2 cells cultured under sucrose starvation conditions: isolation of the autolysosome and its characterization. Plant Cell Physiol. 2011;52(12):2074–2087.
- Yamaguchi H, Arakawa S, Kanaseki T, et al. Golgi membrane‐associated degradation pathway in yeast and mammals. Embo J. 2016;35(18):1991–2007. .
- Isono E, Kalinowska K. ESCRT-dependent degradation of ubiquitylated plasma membrane proteins in plants. Curr Opin Plant Biol. 2017;40:49–55.
- Kalinowska K, Isono E. All roads lead to the vacuole-autophagic transport as part of the endomembrane trafficking network in plants. J Exp Bot. 2018;69(6):1313–1324.
- Toyooka K, Sato M, Kutsuna N, et al. Wide-range high-resolution transmission electron microscopy reveals morphological and distributional changes of endomembrane compartments during log to stationary transition of growth phase in tobacco BY-2 cells. Plant Cell Physiol. 2014;55(9):1544–1555. .
- Hackel A, Schauer N, Carrari F, et al. Sucrose transporter LeSUT1 and LeSUT2 inhibition affects tomato fruit development in different ways. Plant J. 2006;45(2):180–192.
- Bitterlich M, Krügel U, Boldt-Burisch K, et al. Interaction of brassinosteroid functions and sucrose transporter SlSUT2 regulate the formation of arbuscular mycorrhiza. Plant Signal Behav. 2014;9(10):e970426.
- von Sivers L, Jaspar H, Johst B, et al. Brassinosteroids affect the symbiosis between the AM fungus rhizoglomus irregularis and solanaceous host plants. Front Plant Sci. 2019;10:571.
- Fridman Y, Savaldi-Goldstein S. Brassinosteroids in growth control: how, when and where. Plant Sci. 2013;209:24–31.
- Law SR, Chrobok D, Juvany M, et al. Darkened leaves use different metabolic strategies for senescence and survival. Plant Physiol. 2018;177(1):132–150. .
- Kim SJ, Bassham DC. Functional redundancy between trans-Golgi network SNARE family members in Arabidopsis thaliana. BMC Biochem. 2013;14(1):22.
- Uemura T, Kim H, Saito C, et al. Qa-SNAREs localized to the trans-Golgi network regulate multiple transport pathways and extracellular disease resistance in plants. Proc Natl Acad Sci USA. 2012;109(5):1784–1789. .
- Uemura T, Suda Y, Ueda T, et al. Dynamic behavior of the trans-golgi network in root tissues of Arabidopsis revealed by super-resolution live imaging. Plant Cell Physiol. 2014;55(4):694–703.