
ABSTRACT
Purpose
Prevalence of visual impairment (VI) and access to services can vary significantly across and between different population groups. With renewed focus on universal health coverage and leaving no one behind, it is important to understand factors driving inequitable eye health. This paper presents results from five population-based surveys where prevalence of VI and cataract surgical coverage (CSC) were measured and examined for differences by sex, economic-status, and disability.
Methods
Rapid assessments of avoidable blindness took place in four rural sites: Kalahandi, Jhabua and Sitapur in India; and Singida, Tanzania; and one urban site: Lahore, Pakistan. In addition, the Equity Tool was used to measure economic status and the Washington Group Short Set was used to measure disability. Prevalence of VI and CSC were calculated and associations with sex, disability, and relative wealth examined.
Results
Prevalence of VI varied from 1.9% in Lahore to 15.0% in Kalahandi. CSC varied from 39.1% in Singida to 84.0% in Lahore. Additional disability was associated with greater levels of VI in all sites and lower CSC in Singida. Being female was associated with higher VI in Kalahandi, Lahore and Singida and lower CSC in Lahore and Singida. Being poorer was associated with higher VI in Singida and lower CSC in Singida and Sitapur.
Conclusion
Relationships between VI and relative wealth, sex, and disability are complex and variable. Although certain characteristics may be associated with lower coverage or worse outcomes, they cannot be generalized and local data are vital to tailor services to achieve good coverage.
Introduction
With growing recognition of universal health coverage as a fundamental human right and the increased emphasis on essential healthcare for all through its inclusion in the Sustainable Development Goals (SDGs), attention begins to turn to how this promise can be achieved and effectively monitored.Citation1–4 Fourteen service coverage indicators have been identified to be used alone and in combination in one index to be used as tracer indicators for universal health coverage.Citation5–8 These indicators focus strongly on maternal and child health and infectious disease interventions delivered at the primary level and as such do not represent service coverage at different points in the life course or at different service delivery points within the health system. Discussions continue about the need for indicators that represent health issues concerning other segments of the population, such as older people, that are captured at different points of delivery, such as secondary or higher-level referral care. The 2017 Universal Health Coverage Global Monitoring Report highlights the lack of available data for disaggregating the index by dimensions of equity.Citation6 It emphasises that the SDGs will not be achieved without good quality data disaggregated by characteristics such as sex, age, disability, or wealth. The report calls for the development of new approaches and tools to monitor population service coverage by elements of equity.
Despite the lack of available monitoring data, evidence that shows that women, poorer people, and people with disabilities may experience disproportionately poor health outcomes is strong. Poor people are more likely to experience greater health risks, they are less likely to seek timely, quality care when they become ill and experience worse outcomes.Citation9,Citation10 The majority of ocular morbidities are non-communicable diseases associated with aging and the burden of disease may be driven by the availability and affordability of services.Citation10 Sex and gender have a complex relationship with health outcomes and both may influence an individual’s health experiences throughout their lives through a myriad of pathways.Citation11 The majority of visual impairment (VI) globally is found among women; this is partially driven by their longer life spans, but also economic and social factors related to accessing health services.Citation12–14 Little evidence exists on how people with disabilities access health care generally and eye care specifically.Citation15 However, anecdotally, it is assumed that despite potentially greater need due to their impairments, access among people with disabilities is lower than among non-disabled people.
Eye health indicators
Arguably the most important indicators of eye health in a population are prevalence of visual impairment and cataract surgical coverage (CSC), which measures the proportion of people with cataract who have received cataract surgery.Citation5,Citation16,Citation17 The major risk factor for cataract is age, meaning the indicator represents a health condition predominantly found among the elderly, and it is a specialist service usually delivered following referral at secondary or even sometimes tertiary level.
Both prevalence and CSC are measured through population-based surveys, most commonly using the rapid assessment of avoidable blindness (RAAB), one of the methodologies preferred by the Global Action Plan for Avoidable Blindness 2014–2019 (GAP).Citation18 Currently, however, RAABs do not collect data on personal characteristics beyond sex and age, which can be problematic for planning interventions to reach ‘hard to reach’ populations.Citation19 If surveys are required to capture such data appropriate question sets, or tools, must be identified and integrated with them to produce robust and internationally comparable results.Citation20
This paper reports findings of five RAABs conducted in Asia and Africa, where disability and relative wealth were also measured using existing, validated question sets, or tools. This paper examines the relationships between prevalence of visual impairment and CSC and various dimensions of equity. It discusses the usefulness of examining results in relation to particular dimensions of equity for programmatic purposes and comments on the feasibility of using these tools alongside the RAAB methodology.
Methods
Study settings and design
Three of the five RAABs were conducted in rural districts of India in 2016: Kalahandi, Odisha; Jhabua, Madhya Pradesh; and Sitapur, Uttar Pradesh. One was conducted in a rural region in Tanzania in 2017, Singida. The final site was the city of Lahore, north-eastern Punjab, Pakistan which targeted urban ‘slum dwellers’ (adapted from the UN Habitat definition).Citation21 The four rural RAABs were representative of the area populations, which ranged from 1,025,048 people in Jhabua to 4,483,992 people in Sitapur.Citation21,Citation22 The selection of sites was opportunistic: they were the first RAABs conducted by Sightsavers after making a decision to examine wealth and disability more systematically within eye health programmes.
All studies followed the standard RAAB methodology and included people aged 50 years and over.Citation17,Citation23The sample size was calculated based on expected prevalence of blindness and varied from 3,040 respondents in Lahore to 3,850 respondents in Singida.
Data collection tools
The Indian RAABs used paper forms double entered into the RAAB software.Citation24 In Pakistan and Tanzania a mobile application (mRAAB) was used.Citation25 Disability and relative wealth data were collected electronically using a separate questionnaire designed using KOBO Toolbox.Citation26
Eye examination followed the standard RAAB procedure which has been well described elsewhere.Citation17,Citation23 Distance VI is defined as all presenting visual acuity (VA) worse than 6/12. Blindness is defined as presenting visual acuity worse than 3/60 in the better eye; and severe visual impairment (SVI) is defined as visual acuity worse than 6/60 but better than or equal to 3/60 in the better eye. An operable cataract is a cataract alongside VA worse than 6/60. An operated cataract was indicated by the presence of an intraocular lens or an absent lens. A surgical outcome was determined by presenting VA in the operated or better eye for unilateral and bilateral surgery, respectively. CSC (persons) represents those people who have had surgery, out of the total who have had it or who still need it. CSC is calculated by adding the number of people with two operated cataracts to those with one operated and one operable cataract, and dividing by those same people plus those with two operable cataracts.Citation19
In addition to the standard RAAB survey, two additional validated questions sets, or tools, were added to the survey to measure disability and economic status:
Disability
Disability was measured using the Washington Group Short Set tool which was designed to measure disability in censuses and surveys.Citation27 It has undergone extensive testing and validation and is endorsed for use by over 300 organisations including the World Bank.Citation28 The Washington Group Short Set comprises six questions on difficulties experienced in functional domains: seeing, hearing, walking or climbing (lower body), remembering or concentrating, washing or dressing (upper body), and communication.Citation27 Response categories are ‘no difficulty’, ‘some difficulty’, ‘a lot of difficulty’, and ‘cannot do at all’ which allows individuals to position their perception of the difficulty they face in a particular domain on a scale.
We constructed a binary measure of disability if an individual reported having ‘a lot of difficulty’ or ‘cannot do at all’ in at least one of the six domains.
Due to the close relationship between the seeing domain with visual impairment and cataract coverage, a second binary measure, non-visual disability, was also constructed to identify the individuals who had difficulties in the domains other than, or additional to, seeing. Non-visual disability was determined if an individual reported having a ‘lot of difficulty’ or ‘cannot do at all’ in at least one domain of the following: hearing, walking or climbing (lower body), remembering or concentrating, washing or dressing (upper body) and communication.Citation27 People with non-visual disability may or may not also have difficulty in the seeing domain. Disability data were not available in Lahore.
Economic status
Relative wealth was determined using a household asset-based index, the Equity Tool, developed by Metrics for Management in collaboration with the Metrics Working Group.Citation29 This tool was derived from data collected through Demographic and Health Surveys and has been extensively tested and validated. The Equity Tool is scored using a composite measure of relative wealth based on household infrastructure and ownership of durable assets. Scores are then compared to country-specific population wealth index values. Households are allocated to the corresponding national or urban wealth quintile and all individuals living within that household are assumed to share that economic status. An asset-based wealth index is particularly valuable to determine economic status in countries that lack reliable data on income and expenditures, and this approach is routinely used by in large national surveys. We chose a relative rather than absolute approach to measuring wealth given the known prevalence of poverty in the sites and while everyone may be ‘poor’ by some standards, we wanted to distinguish who among them may be relatively poorer or wealthier. The quintiles referred to in this paper are referenced against national data, except for Lahore which is referenced against urban data. To maintain comparability in our analysis between sites and due to homogeneity of wealth within certain sites, we have combined the poorest two quintiles (1 and 2) and the richest two (4 and 5) and compared them.
Ethics
All studies followed the fundamental principles of health research, the basic tenet of which is to do no harm. Participants were given full information about the study, in a form accessible to them, prior to enrolment and their right to decline with no repercussions was explained. Consent was formally recorded on paper forms, with participants signing their name where possible and making a witnessed mark in case of illiteracy or visual impairment. With the exception of the survey in Lahore (Pakistan), where informed verbal consent was preferred over written consent. Verbal consent was requested and recorded using the electronic data collection application. Participants unable to provide consent due to any reason were not enrolled. Simple ocular morbidities identified were treated on site and complex cases were referred to nearby facilities.
All studies received ethical approvals from local review boards:
Tanzania: National Institute for Medical Research – NIMR/HQ/R.8a/Vol. IX/2500
Pakistan: Government of Pakistan Ministry of National Health Services, Regulations & Coordination; Health Services Academy
Kalahandi: LEPRA Society, Bhubaneswar
Jhabua: Tejas Eye Hospital, Divyajyoti Trust
Sitapur: Indira Gandhi Eye Hospital and Research Centre
Data analysis
The RAAB software generated standard descriptive tables with sample and age and sex adjusted estimates of prevalence of visual impairment and CSC. To examine associations with relative wealth and disability data, the data were exported from the RAAB software and combined using the unique identifier in to a Stata dataset (version 15).Citation30 Univariate associations between blindness and SVI and sex (male and female), relative wealth (wealthiest and poorest quintiles) and disability (no additional disability and additional, non-visual disabilities) data were examined using logistic regression to calculate odds ratios. In total, 95% confidence intervals were generated using the ‘survey set’ commands to allow for the potential clustering effect associated with the two-stage sampling design. A difference was considered to be statistically significant if the 95% confidence intervals didn’t overlap with the null value, one.
Observations with missing data (relative wealth for 112, 3.8% respondents in Lahore and relative wealth and disability for 507, 13.6% respondents in Singida) were excluded. Nearly 50% of records in Lahore missed disability data and analysis by disability was not possible in this site.
Results
Participant characteristics
All surveys had high response rates, ranging from 93.6% in Jhabua, to 97.5% in Sitapur (). Singida (56.2%), Kalahandi (54.0%), and Jhabua (53.0%) enrolled more women, while Sitapur (52.6%) and Lahore (54.5%) enrolled more men. Median age ranged from 55 years in Lahore to 64 years in Singida.
Table 1. Characteristics of study participants.
Respondents in the four rural sites were relatively poorer than the national population, and participants in Lahore, the sole urban setting were relatively similar to the urban population of Pakistan, and thus relatively wealthier than the national population.
Prevalence of disability in the studied group was highest in Sitapur (28.6%) followed by Kalahandi (22.1%), Singida (20.6%), and Jhabua (12.9%). Non-visual disability was highest in Sitapur (19.5%), followed by Singida (13%), Jhabua (12.4%), and Kalahandi (9.4%). The proportion of people with disabilities reporting difficulties in the visual domain ranged from 72.9% (n = 444/612) in Kalahandi, 63.9% in Singida (n = 427/668), 62.9% in Sitapur (n = 597/949), to 33.3% in Jhabua (n = 135/405).
Prevalence of visual impairment
Prevalence of blindness and severe visual impairment among people aged 50+ years varied enormously between the sites. Prevalence was relatively low in Lahore (1.9%) and Jhabua (3.2%) and higher in Singida (7.1%), Sitapur (10.9%), and Kalahandi (15.0%). Cataract was the leading cause of severe visual impairment and blindness in all sites responsible for between 74.4% of the burden in Singida and 93.0% in Jhabua.
Univariate associations indicate that age has a small but significant association with increased odds of being blind or SVI in all five sites ().
Table 2. Univariate association with blindness and severe visual impairment.
Women appeared to have a greater odds of being blind or SVI in Kalahandi (OR 1.3, 95%CI 1.1–1.7), Lahore (OR 2.7, 95%CI 1.4–5.4), and Singida (OR 1.3, 95%CI 1.0–1.7), but no difference was observed in Jhabua (OR 1.0, 95%CI 0.7–1.5) or Sitapur (OR 1.0, 95%CI 0.8–1.2).
In all four sites where disability was assessed, people with additional, non-visual disabilities experienced higher odds of also being blind or SVI. This ranged from 2.1 greater odds in Kalahandi (95%CI 1.5–3.1), 3.5 greater odds in Sitapur (95%CI 2.7–4.5), 7.3 greater odds in Jhabua (95%CI 4.5–11.9), to 10.3 greater odds in Singida (95%CI 7.1–14.9).
An association between relative wealth and blindness or SVI was only observed in Singida, Tanzania where people in the richest two quintiles had 60% reduced odds of being blind or SVI than people in the poorest two quintiles (OR 0.4, 95%CI 0.2–0.7). Although point estimates suggested similar trends in Jhabua, Sitapur and Lahore, there was significant imprecision and confidence intervals straddled one.
Cataract coverage
CSC was highest in Lahore (84.0%) and lowest in Singida (39.1%) (). The three Indian sites had intermediate coverage of 57.4% in Jhabua, 56.0%, in Sitapur and 45.5% in Kalahandi.
Figure 1. Cataract surgical coverage in each of the five sites.
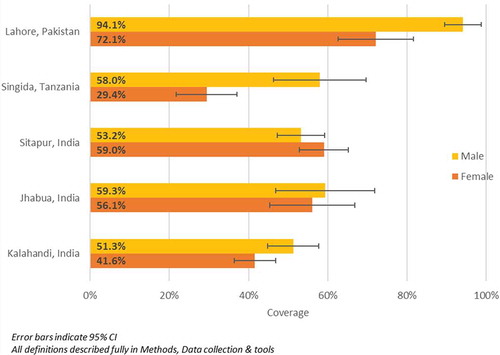
Inequalities between men and women were found in three settings (). In Singida, CSC among women was half that among men: 29.4% (95%CI 21.8–37.1%) compared to 58.0% (95%CI 46.2–69.6%) among men. In Lahore, despite their very high coverage overall, women experienced 22.0% lower CSC compared to men (women: 72.1%, 95%CI 62.6–81.6%; men: 94.1%, 95%CI 89.4–98.7%). In the three Indian sites, overlapping confidence intervals indicated no differences were observed between males and females.
Figure 2. Cataract surgical coverage by sex in each of the five sites.
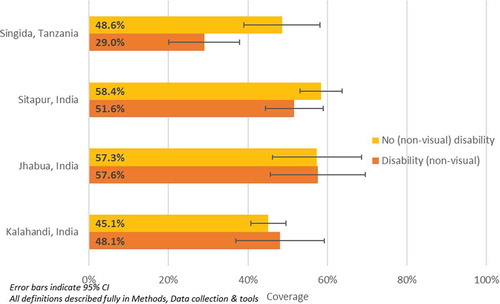
Non-visual disability-related inequalities in CSC were found in one site, Singida, where CSC among people with additional, non-visual disabilities was 29.0% (95%CI 20.1–37.9%) compared to 48.1% (95%CI 39.0–58.1%) among people without non-visual disabilities (). No differences were observed in the three Indian sites between people with and without non-visual disabilities.
Figure 3. Cataract surgical coverage by disability in four sites.
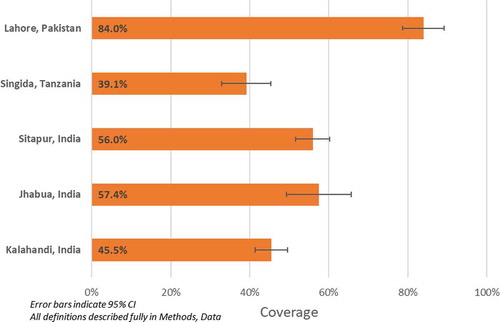
Figure 4. Cataract surgical coverage by wealth quintile in five sites.
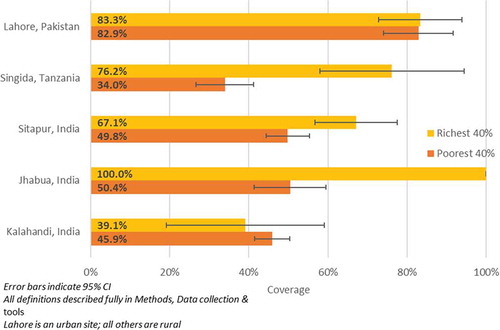
Significant differences between the relatively wealthy and relatively poor were found in two sites (). In Sitapur, the poorest had CSC of 49.8% (95%CI 44.4–55.3%) compared with 67.1% (95%CI 56.7–77.5%) among the relatively wealthiest. In Singida, the poorest had CSC of 34.0% (95%CI 26.7–41.2%) compared to 76.2% (95%CI 58.0–94.4%) among the wealthiest. No differences were observed between the relatively wealthiest and poorest in Lahore, Sitapur or Jhabua.
Discussion
We applied the standard RAAB methodology in five diverse sites and included additional tools which allowed us to examine results by two important dimensions of equity: disability and relative wealth. These additional data highlighted a number of similarities and differences in prevalence of visual impairment and coverage of cataract services and provided insights into a broader understanding of inequalities in access to surgical care among older people.
The most striking observation was unequal coverage of cataract services for women irrespective of whether the site had low cataract coverage, as in Singida or very high cataract coverage, as in Lahore. Gender inequalities in eye care have been well documented.Citation12–Citation14,Citation31 This study shows that women are often but not always, disadvantaged. Ramke et al. also found considerable variations between the settings.Citation19 It is therefore important to better understand the reasons for gender disparities in different contexts and the experiences of the programmes that have avoided them.
The integration of the Washington Group Short Set and Equity Tool to measure disability and relative wealth, respectively, was useful to better understand inequalities within the study settings. Inequalities in relative wealth within some RAABs were difficult to analyse due to uneven distribution and small numbers of people in certain quintiles in what appear to be relatively homogenous sites with regards to relative wealth. The findings from Singida and Sitapur seem to suggest that limited coverage hit the hardest those in the poorest economic groups. Populations in all four rural sites were among the poorest in their countries, while the urban site had a relatively wealthy population compared to the national average. Thus, in Lahore, Pakistan’s wealthiest city, even ‘slum dwellers’, a population subgroup expected to be disadvantaged, were relatively wealthy, had good access to quality cataract services and low prevalence of blindness and SVI. In contrast, in Singida, one of the poorest regions in Tanzania, CSC was low and the combined prevalence of blindness and SVI was high.
The study also suggests that the relationship between economic wealth of an area and population health is not straightforward. The three rural Indian sites experienced significantly different levels of blindness and VI and all were among the 250 poorest districts in receipt of the Backward Regions Grant Fund, indicating they are recognised for their poverty levels and may not be representative of other rural areas in India.Citation32 A total of 85% of the population of Jhabua are considered ‘tribal’ and different socio-cultural traditions may lead to differing patterns of health-seeking behaviour from other rural Indian locations. Other research has suggested that financial barriers to cataract surgery may interact with gender, family, community, and social norms resulting in a complex situation that is difficult to capture using quantitative tools.Citation33 Despite this, it is critical to continue to monitor economic status in both surveys and routine data collection to ascertain more definitive estimates of economic disparities and their impact. This data will allow programme managers to effectively tailor programmes and financing strategies according to the needs to local populations.
Finally, analysis of data by disability was useful, largely because very little is known about coverage of eye care services by people with ‘additional’, non-visual impairments. The Washington Group Short Set was a useful tool for this study as it allowed for flexibility in analysis and worked across different cultures. People with additional, non-visual disabilities in all four rural sites appear at risk of high prevalence of visual impairment, and data from Singida suggest that people with additional, non-visual disabilities may be disadvantaged in terms of service coverage. More research is needed to understand the relationship between visual disability and reported difficulties in other functional domains, as well as the pathways for this observed disadvantage.
Several limitations and lessons learnt need to be taken into account, when replicating the integration of additional tools within the RAAB methodology. First, the approach has limitations in examining inequalities in broader eye care, as RAAB surveys do not give detailed information on most specific causes of blindness, for example posterior segment diseases, and cannot tell us about visual impairment in younger age groups and children.Citation17 RAABs are powered to calculate the prevalence of blindness in a study site and may not sample enough participants to reliably measure the differences between population subgroups. Also, the data presented here are unadjusted for age and sex and the true population CSC may be slightly different due to small variations between the study and underlying populations. The response rate for the surveys, particularly those in Sitapur (97.5%), Lahore (97.0%), and Singida (96.7%) are quite high indicating either excellent mobilisation of communities or potentially, under-enrolment of participants absent from home on the day of the study. This study did not attempt to analyse service delivery policies such as visual acuity thresholds for surgical intervention or programmes in the sites that may have influenced who received services and when and so cannot attempt to draw links between the coverage and service provision and policies.
In this analysis, we noted particular difficulties with disaggregating CSC by relative wealth due to the unequal distribution between quintiles and the very small numbers in some groups. It is possible that another measure of economic status may be more reliably added to RAABs or used in conjunction with the Equity Tool to prevent this. An absolute measure of wealth, for example using poverty scorecards, may also be useful for making more reliable international comparisons since in some settings even those in the richest quintiles may live below defined international or national poverty lines.Citation34
Overall, the integration of additional tools alongside RAAB data provided important evidence on how coverage of cataract services differs by sex, disability, and relative wealth in different settings. The results also suggest that the assumption that certain population subgroups experience disadvantage cannot be generalized, and it is important to understand the factors at play in any particular context. Effective cataract surgical monitoring systems should be used in conjunction with population-level data such as that generated from RAABs to provide a more comprehensive view of the distribution and drivers behind poor eye health.
Financial support
Kalahandi, Jhabua, Sitapur – Sightsavers
Singida – Standard Chartered Bank
Lahore – The Fred Hollows Foundation and Sightsavers
Conflicts of Interest
None of the authors have any proprietary interests or conflicts of interest related to this submission.
Acknowledgments
The authors would like to acknowledge the support of the following individuals and organisations for their support in conducting the research or reviewing the draft of this manuscript:
Prof. Dr Asad Aslam Khan, National Coordinator of Pakistan’s National Blindness Control Programme;
Regional Medical Officer Singida Region, Tanzania
Dr B R Shamanna, Adjunct Faculty, Indian Institute for Public Health, Hyderabad, India
Dr Srikrishna Sulgodu, Assistant Professor, Indian Institute for Public Health, Hyderabad, India
LEPRA Society, Bhubaneswar, India
Tejas Eye Hospital, Mandvi, India
Indira Gandhi Eye Hospital and Research Centre, Lucknow, India
Gosbert Katunzi, Kolonel Kema, Abraham George, Sofia Abrahamsson, Rachel Murphy, and Stevens Bechange, Sightsavers.
References
- United Nations. The Sustainable Development Goals Report. New York; 2017. The United Nations
- Ghebreyesus TA. All roads lead to universal health coverage. Lancet Glob Health. 2017;5(9):e839–e840. doi:10.1016/S2214-109X(17)30295-4.
- Rodney AM, Hill PS. Achieving equity within universal health coverage: a narrative review of progress and resources for measuring success. Int J Equity Health. 2014;13(1):72. doi:10.1186/s12939-014-0072-8.
- Boerma T, Eozenou P, Evans D, Evans T, Kieny M-P, Wagstaff A. Monitoring progress towards universal health coverage at country and global levels. PLoS Med. 2014;11(9):e1001731. doi:10.1371/journal.pmed.1001731.
- World Health Organization. Tracking Universal Health Coverage: First Global Monitoring Report. Geneva, Switzerland: World Health Organization; 2015.
- World Health Organization, International bank for reconstruction and development, bank. W. Tracking universal health coverage: 2017 global monitoring report. 2017.
- Hogan DR, Stevens GA, Hosseinpoor AR, Boerma T. Monitoring universal health coverage within the sustainable development goals: development and baseline data for an index of essential health services. Lancet Glob Health. 2018;6(2):e152–e168. doi:10.1016/S2214-109X(17)30472-2.
- Hogan D, Hosseinpoor AR, Boerma T Developing an index for the coverage of essential health services. 2016.
- Adler NE, Newman K. Socioeconomic disparities in health: pathways and policies. Health Aff (Millwood). 2002;21(2):60–76. doi:10.1377/hlthaff.21.2.60.
- Bloom DE, Cafiero E, Jané-Llopis E, et al. The global economic burden of noncommunicable diseases. Program on the Global Demography of Aging. 2012.
- Macintyre S, Hunt K, Sweeting H. Gender differences in health: are things really as simple as they seem? Soc Sci Med. 1996;42(4):617–624. doi:10.1016/0277-9536(95)00335-5.
- Courtright P, Bassett K. Gender and blindness: eye disease and the use of eye care services. Community Eye Health. 2003;16:11.
- Lewallen S, Courtright P. Gender and use of cataract surgical services in developing countries. Bull World Health Organ. 2002;80:300–303.
- Lewallen S, Mousa A, Bassett K, Courtright P. Cataract surgical coverage remains lower in women. Br J Ophthalmol. 2009;93(3):295–298. doi:10.1136/bjo.2008.140301.
- World Health Organization. World report on disability. 2011.
- Gray Z, Ackland P Cataract surgical coverage. IAPB;2015.
- Kuper H, Polack S, Limburg H. Rapid assessment of avoidable blindness. Community Eye Health. 2006;19:68–69.
- World Health Organization. Universal Eye Health: A Global Action Plan 2014–2019. Geneva; World Health Organisation, 2013.
- Ramke J, Gilbert CE, Lee AC, Ackland P, Limburg H, Foster A. Effective cataract surgical coverage: an indicator for measuring quality-of-care in the context of universal health coverage. PLoS One. 2017;12(3):e0172342. doi:10.1371/journal.pone.0172342.
- Ramke J, Qureshi B, Gilbert CE. To realize universal eye health we must strengthen implementation research. Middle East Afr J Ophthalmol. 2017;24(2):65–66. doi:10.4103/0974-9233.214183.
- U.N. Habitat. State of the World’s Cities 2010/2011: Bridging the Urban Divide. 2010.
- Office of the Registrar General & Census Commissioner India. Census of India website 2011. www.censusindia.gov.in. 2011.
- Dineen B, Foster A, Faal H. A proposed rapid methodology to assess the prevalence and causes of blindness and visual impairment. Ophthalmic Epidemiol. 2006;13(1):31–34. doi:10.1080/09286580500473787.
- RAAB v.5.0 [computer program]. Version 5.0; 2015.
- mRAAB [computer program]. Version 1.30; 2016.
- KoBoToolbox [computer program]. 2017.
- Madans JH, Loeb ME, Altman BM. Measuring disability and monitoring the UN convention on the rights of persons with disabilities: the work of the washington group on disability statistics. BMC Public Health. 2011;11(4):S4. doi:10.1186/1471-2458-11-S4-S4.
- UK Department for International Development. Global disability summit: summary of commitments. In: Development DfI, ed. London2018.
- Chakraborty NM, Fry K, Behl R, Longfield K. Simplified asset indices to measure wealth and equity in health programs: a reliability and validity analysis using survey data from 16 countries. Glob Health Sci Pract. 2016;4(1):141–154. doi:10.9745/GHSP-D-15-00384.
- Stata [computer program]. Version 15.1; 2018.
- Gilbert CE, Lepvrier-Chomette N. Gender inequalities in surgery for bilateral cataract among children in low-income countries: a systematic review. Ophthalmology. 2016;123(6):1245–1251. doi:10.1016/j.ophtha.2016.01.048.
- Ministry of Panchayati Raj GoI. Backward regions grant fund programme guidelines. 2007.
- Aboobaker S, Courtright P. Barriers to cataract surgery in Africa: a systematic review. Middle East Afr J Ophthalmol. 2016;23(1):145. doi:10.4103/0974-9233.164615.
- Schreiner M. Seven extremely simple poverty scorecards. EDM. 2010;21(2):118–136. doi:10.3362/1755-1986.2010.011.