
 ?Mathematical formulae have been encoded as MathML and are displayed in this HTML version using MathJax in order to improve their display. Uncheck the box to turn MathJax off. This feature requires Javascript. Click on a formula to zoom.
ABSTRACT
Making the link between human emotion and music is challenging. Our aim was to produce an efficient system that emotionally rates songs from multiple genres. To achieve this, we employed a series of online self-report studies, utilising Russell's circumplex model. The first study (n = 44) identified audio features that map to arousal and valence for 20 songs. From this, we constructed a set of linear regressors. The second study (n = 158) measured the efficacy of our system, utilising 40 new songs to create a ground truth. Results show our approach may be effective at emotionally rating music, particularly in the prediction of valence.
1. Introduction
The ability to carry a large digital library of music is now commonplace, thanks to the advent of psychoacoustic audio compression techniques and portable digital music players, the function of which have increasingly become integrated with ubiquitous devices, such as laptops, tablets and smartphones. The choice and portability of music afforded by the digital revolution has actually made listeners more active as opposed to passive, in that they seek out particular songs for specific emotional or contextual purposes, rather than being exposed to the playback of music over which they have little or no control in the selection of North et al. (Citation2004) and Krause et al. (Citation2015). This has led to a revolution in the way music is used in everyday life, where music playlists can be easily created to reflect a host of situations, intentions and contexts (Juslin & Laukka, Citation2004; Kamalzadeh et al., Citation2012).
Music recommendation systems have become commonplace on platforms that support the organisation and acquisition of digital music. The approaches that are employed by such systems often draw upon collaborative or content-based filtering techniques, which have their digital origins in recommendation systems for online shopping and other commercial applications. The former is a community-based process that typically uses a rating system, which bases its recommendations upon other users that have similar tastes (Ricci et al., Citation2011). The latter also uses a rating system, but focusing upon the attributes of users (e.g. demographics, preferences, etc.) and features they are interested in (musical genre, tempo, artist, etc.) (Mobasher et al., Citation2000).
While these approaches provide one possible solution for generating music playlists, they have several disadvantages. Collaborative filtering methods require a large amount of historical data from users, which gives rise to issues of privacy. Content-based methods also lack an understanding of users' interests and preferences (Shao et al., Citation2009). More importantly, with respect to affective computing, these systems do not make recommendations based upon an individual's emotional state or incorporate knowledge of the emotional content and perceptual effects of the music. Affective music playlists have recently begun to receive more widespread attention as an alternative approach, which takes these emotional concepts into account. Music is often regarded as a language of emotions (Cooke, Citation1990); it expresses feelings that listeners perceive, recognise, and are moved by. Studies have suggested that the most common motive for listening to music is to influence emotions (Juslin & Sloboda, Citation2011). In correspondence with this, the use of emotion in creating music playlists is a frequently occurring concept with users (Stumpf & Muscroft, Citation2011), yet currently there are few effective systems for organising music according to emotion using computational methods. To this end, a scalable solution for designing affective music playlists is proposed in this paper, which has the ability to account for such emotional factors.
The aim of this research is to develop a system that can organise the vast amount of music that is available to the general public in a meaningful, personalised way, by providing a mechanism by which music can be emotionally labelled. In practice, users of the system could self-report their emotional state as coordinates in arousal and valence space. This would allow recommendation of similar music by selecting and sequencing songs according to their Euclidean distance from the user's coordinates, within a defined radius. Alternately, users could emotionally traverse their music collection by defining start and endpoints in arousal and valence space, plotting the vector between the two points, and selecting songs within a fixed Euclidean distance of intervals along the vector. This work constitutes a core component of a larger project that examines methods to produce affective and contextually aware music playlists (Griffiths et al., Citation2015, Citation2016), which was carried out in the context of the Affective Audio Team (Weinel et al., Citation2014).
In what follows, a critical overview of the fields of music recommendation systems and affective playlists is provided. Next, the methodology used for our two research studies is described before each study is presented in detail. The first study deals with the creation of a set of regressors by mapping audio features to emotionally labelled music. The second study uses a similar approach to obtain a ground truth of emotionally labelled music, plotted to the circumplex model of affect. Following this, we determine the efficacy of our affective models through a validation study utilising this ground-truth data. Finally, we summarise our findings, compare our approach to alternatives in the literature, and provide suggestions for future work that may build upon these outcomes.
2. Background
The field of Music Emotional Retrieval (MER) has grown in recent years and is a specific subset of the longer established investigation into Music Information Retrieval (MIR). MER deals with the determination of affective information from either symbolic or signal-based musical representation. Typically, research in the field of MER seeks to recognise emotions by analysing the musical features in songs, so that the music can be classified or the data used for recommendation purposes. As such, the field incorporates knowledge and tools from multiple disciplines.
Y. H. Yang, Lin, Su, et al. (Citation2008) modelled emotions according to a two-dimensional arousal and valence system. This work employed a regression approach with the intention of alleviating ambiguity, in contrast to an alternate model that classifies music in terms of categorical emotions. Their work made use of a corpus of music, consisting of 195 songs in total. A ground-truth was created using subjective data gathered from 253 human participants with a test-retest methodology subsequently being applied, using 22 participants, alongside statistical measures of the regression model's error rates to validate the approach. The authors used the coefficient of determination as a measure of the model's performance against the set of results obtained from participants. This is one of the most common indicators of affective classification performance used in MER. This analysis showed that their model was able to account for 58.3% of the variance in the arousal dimension and 28.1% of the variance in the valence dimension.
Lu et al. (Citation2005) proposed a hierarchical framework to automate mood detection from acoustic music. Their framework comprised three musical feature sets, including intensity, timbre, and rhythm, which are used to determine the emotional content of the music. The features were clustered using a Gaussian Mixture Models (GMM) to classify the music using the dimensions of arousal and valence. Specifically, the model was based upon Thayer's concept, which has four quadrants categorised as: contentment, depression, exuberance, and anxious/frantic. The system itself was validated using a dataset consisting of approximately 250 songs, which were annotated by three expert human participants, who listened to short 20 s clips of each song. Validation procedures demonstrated that it was effective with average accuracy, which is another ad-hoc measure of affective classification performance, being reported as 86.3%.
Eerola et al. (Citation2009) provide a comparison of two common paradigms of emotion representation within music is presented by contrasting multi-dimensional affective space and a collection of basic emotions. Ground-truth data from 360 different film soundtracks samples were used in order to assess the compatibility of such dimensional and discrete concepts. In order to evaluate these models, an expert panel (n = 12) with an extensive musical background rated the musical excerpts with basic emotions (i.e. happy, sad, tender, scary, and angry) and dimensional concepts using Likert scales. The authors used a three-dimensional hybrid model of emotion based upon Thayer and Russell's theories (i.e. energetic-arousal, tense-arousal, and valence). Model prediction of perceived emotions in music was based upon timbre, harmonicity, register, rhythm, articulation, and structural audio features using the MIRToolbox (Lartillot & Toiviainen, Citation2007) and a sample of 110 soundtracks, rated by 116 participants. Three methods of regression were contrasted, which were Multiple Linear Regression, Partial Least Squares, and Principal Component Analysis in conjunction with a Box–Cox transform. In performance evaluation using , they were able to account for a maximum (upper-bound) of 85% of the variance in the activity dimension, 72% in the valence dimension, and 79% in the tension dimension.
Table provides a summary of the aforementioned studies, and a number of others, providing an indication of the variety of approaches used by MER researchers. In MER tasks, decisions must be made regarding the underlying model of emotion adopted, type of emotion being measured, classification approach, and the music to be used. Models of emotion commonly used in the literature include: Russell's circumplex model of affect (Russell C) (Russell, Citation1980); Thayer's arousal valence model (Thayer AV) or Thayer's Energy-Stress model (Thayer ES) (Thayer, Citation1990); and an adaption of Thayer and Russell's work creating a three-dimensional energy-tension-valence model (ETV) (Eerola et al., Citation2009).
Table 1. Recent work in music emotion recognition (MER).
It is important to be clear if measurements are being made of the emotion that a listener would perceive in a piece of music versus an emotion that might be induced in the listener. The key difference here relates to whether or not the music makes the listener think upon an emotion or whether they actually feel an emotion (Juslin, Citation2009). The classification approach may vary and typically involves statistical or machine-learning techniques to model the relationship between features extracted from the music to aspects or dimensions of the selected model of emotion. Such approaches typically take the form of Support Vector Regression (SVR); Support Vector Machines (SVM) regression; Gaussian Mixture Models (GMM); Fuzzy Logic, Principal Component Analysis (PCA), and so on. Finally, the choice of songs used is important to understand, especially how they represent a diversity of musical genres and the culture from which they are drawn.
Other authors have recognised the disparity in approaches of the MER field (Huq et al., Citation2010), particularly the adoption of various models of emotion and techniques for elicitation of responses in participants. The absence of participant or user context within MER scenarios is highlighted as being a factor that needs to be addressed in the field. In response, as well as providing affective musical responses, the Moodo dataset (Pesek et al., Citation2017) also includes context and colour response information. A key driver of the Moodo dataset is to support the development of personalised affective recommendation systems, much like the larger project within which our own work is located. The affective music ratings, perceived and induced, of Moodo were constructed by participants rating music by way of a discrete set of emotional labels. A total of 200 music clips, each 15 s long, were rated by 741 participants, each of whom listened to a subset of 10 music clips. High-level music features were produced for the songs in the dataset by a human annotator (rhythm, tempo, harmonic complexity, and tunefulness) along with automatically extracted musical similarity metrics and analysed using DataFusion by Matrix Factorization (DFMF). Using linear models, the authors of Moodo found that user profile information was a significant predictor of emotional labels, suggesting that knowledge of the user and their content is valuable in producing personalised affective outputs from a MER system. Given the discrete approach adopted by the Moodo creators, the results must be viewed as a task of classification, rather than regression.
The studies in Table have predominantly adopted a dimensional approach to the modelling of emotion, and that all but one of the existing studies use models by Russell (Citation1980) and Thayer (Citation1990), or variations thereof. Most of the measures of emotion presented in Table are based upon the perceived affect (emotions the listener may associate with the music), as opposed to the impact the music may induce on one's affect. However, it has been argued that the two are not easy to disentangle, since one is likely to influence the other Roda et al. (Citation2014). The majority of the studies in Table used varying types of regression or machine learning, which were generally formed from high-level audio features, such as musical tempo or key, and used to predict music in terms of dimensional concepts. With some exceptions where Chinese music or soundtrack music is employed, the majority of studies are limited to music drawn from Western popular music and classical music. It is notable that authors have tended to select datasets from distinct genres of music, rather than to analyse a wide cross-section of musical genres from within a specific musical culture. This presents a notable opportunity, since it seems reasonable to assume that an individual's digital music library is likely to contain music from a range of genres. The previous investigation into MER approaches for multiple genres have showed indication that arousal features may be feasibly and accurately predicted across genre, but that valence prediction across genres may be more challenging (Eerola, Citation2011).
3. Method
The research carried out was the result of two distinct studies. Both share a common foundation in terms of the model of emotion being employed and the method behind the elicitation of participatory ground-truth data. This was coupled with a signal-level analysis of extracting a range of audio features, with the intention of identifying links between the participants' emotional ratings and the audio features to produce regression models.
Linear regression was selected on the basis that the best MER results currently reported in the literature utilise regression (Eerola et al., Citation2009), as do other highly performing MER systems (Hu & Yang, Citation2017; Malheiro et al., Citation2016; Roda et al., Citation2014). Given the new sets of data being created in our work, this was a natural starting point for investigation. Regression offers benefits of being computationally efficient, stable in the presence of small variations, and less prone to over-fitting, when compared to other machine learning techniques. Since this research sought to work with specific audio features, and their prominence in MER tasks, a key advantage of linear regression is that its performance is easily explainable (Hagras, Citation2018).
A procedural overview of the research stages we report upon in this work is shown in Figure .
Figure 1. Overview of the research process.
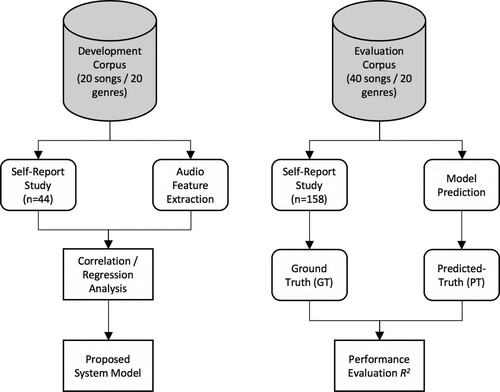
The first study sought to quantify emotional responses to a cross-section of music using a group of participants, affording the generation of a model of music and affect that links a series of audio features to dimensions of arousal and valence. The second study demonstrates the efficacy of this model by acquiring a ground truth from another participant group, using a separate selection of songs, and evaluating the emotional prediction of our system to that of the ground truth. For ease of interpretation, we deal with the particulars of each study in turn in later sections.
3.1. Model of emotion
In order to standardise the method of representing emotion in the system that has been developed, it is necessary to adopt an appropriate model of emotion. There is a plethora of models in existence that describe affect. Many of the most popular methods in the MER domain fall into one of two branches: categorical (Ekman, Citation1992, Citation1999; Panksepp, Citation1992) or dimensional (Russell, Citation1980; Thayer, Citation1990; Watson & Tellegen, Citation1985).
In terms of the categorical paradigm, the disagreement concerning the exact number and labelling of distinct emotions suggests that these maybe based upon linguistic and cultural taxonomies, rather than on actual defined sensations (Zentner & Eerola, Citation2010) and is a disadvantage. Conversely, a possible limitation of dimensional models is that the alignment of each axis does not necessarily correspond with the underlying physiological system that underpins the affective experience, although additional dimensions can be added to attempt to address this deficiency (Thayer, Citation1990). There is already a large body of work in existence describing both models (Barthet et al., Citation2012; Eerola & Vuoskoski, Citation2011, Citation2012; Scherer, Citation2000) although there is no agreed standard in affective music research (Calvo & D'Mello, Citation2010; Scherer, Citation2004). To this extent, both models are frequently found in the existing literature on music and emotion (Bigand et al., Citation2005; Dibben, Citation2004; Juslin, Citation2000; Leman et al., Citation2005; Resnicow et al., Citation2004; Wedin, Citation1972).
This work adopted an approach that conforms to Russell's circumplex model of affect (Russell, Citation1980), which is oriented around the use of two dimensions corresponding to arousal and valence. It is argued that the simplicity of the model is one of the reasons for its popularity (Juslin, Citation2013) alongside the relative ease with which it can be integrated with variables from user studies and audio features. In particular, the choice of a two-dimensional model means that users being asked to express emotional ratings should find it fast and easy to engage with. However, a possible disadvantage of this approach is that some studies have concluded that arousal and valence dimensions alone are not able to account for all the variance in the emotions expressed by music (Collier, Citation2007; Ilie & Thompson, Citation2006) and that higher-dimensional approaches may be more appropriate, accounting for subtle and nuanced aspects of affective response. Despite these criticisms, the simplicity of the circumplex model, coupled with evidence suggesting that there are no significant correlations between musical features beyond arousal and valence (Bigand et al., Citation2005; Eerola et al., Citation2009; Leman et al., Citation2005) support this decision.
3.2. Online self-report studies
Data in our studies were collected using post-performance ratings, as opposed to a continuous self-report methodology (Schubert, Citation2011). Our work with participants used a self-report methodology, facilitated with a series of online questionnaires involving listening to several music selections and then providing affective ratings for each. This approach is simpler and can alleviate cognitive strain when compared to asking participants to produce real-time or continuous ratings (Zentner & Eerola, Citation2010). To make the mechanism intuitive, participants were required to express affective ratings using a mixture of categorical and ordinal variables, which were then mapped onto the circumplex model, adhering to the forced choice paradigm (Kallinen, Citation2005). According to Scherer et al. (Citation2013), when individuals are permitted to choose their own words, the differences in vocabulary and culture make it difficult to compare data across individuals and studies, hence the compulsion of predefined constructs avoid this obstacle. Self-report approaches are commonly encountered in music and emotion studies (Drossos et al., Citation2015; Hadjidimitriou & Hadjileontiadis, Citation2013; Kreutz et al., Citation2008; Ritossa & Rickard, Citation2004; Vuoskoski & Eerola, Citation2011).
In selecting the number of songs in the study, we wanted to focus on reliability of ratings for each song sample rather than a using larger number of songs with fewer ratings. We took a pragmatic view of the time and number of participants we could realistically recruit in obtaining this number of ratings per song.
3.3. Approach to mapping self-report data to the circumplex model
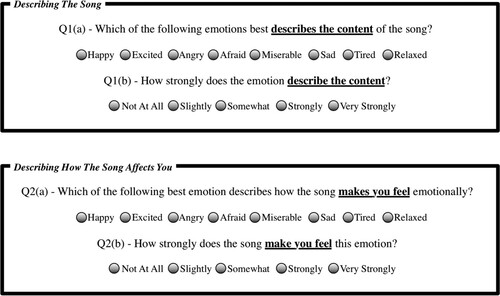
This subsection recapitulates the salient aspects of earlier work into mapping self-report data to the circumplex model (Griffiths et al., Citation2015). Since our method was to use an online tool to obtain a high number of responses, there was a concern that this could make training participants difficult, especially in the use of expressing emotions on the circumplex model or via an intermediary interface, such as the SAM scale (Bradley & Lang, Citation1994). To facilitate fluid interaction, we, therefore, selected a set of eight named emotions, covering all quadrants of the circumplex model: happy; excited; angry; afraid; miserable; sad; tired; and relaxed. After selecting one of these labels, participants were asked to indicate the strength of that emotion using an ordinal scale: not at all; slightly; somewhat; strongly; and very strongly. For each song used in the self-report studies, participants were then asked the following questions, the first two relating to perceived emotion, the third and fourth to induced emotion:
Which of the following emotions best describes the content of the song?
How strongly does the emotion describe the content?
Which of the following emotions best describes how the song makes you feel emotionally?
How strongly does the song make you feel this emotion?
Participants were prompted with these questions as illustrated in Figure .
Figure 2. A graphical representation of the affective online self-report question format.
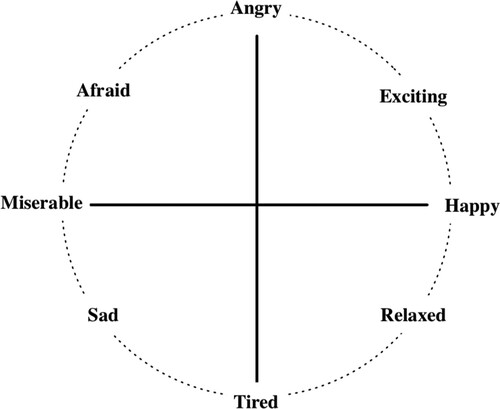
These eight emotions were chosen from a total of twenty-eight emotion vocabularies used in Russell's category-sort study (Russell, Citation1980). and are related to the eight emotion categories (pleasure, excitement, arousal, distress, misery, depression, sleepiness, and contentment) that were formed in a circular ordering in affective space. These conceptually indicate that emotions differ in their level of similarity and that some are usually perceived as contrasting emotions. The eight emotion labels chosen for this study were selected because of their musical relevance and total frequency in Russell's work. In further support of this choice, it can be noted that these terms appear in categories A, C, and F, respectively, in Schubert's work (Schubert, Citation2003). The emotions relaxed and sad are also used in the Geneva Emotional Music Scales (GEMS) (Zentner et al., Citation2008), whilst the term afraid was established in the study of Strong Experiences of Music (SEM) (Gabrielsson, Citation2001), which sought basic affect labels from users that described the strongest impact music had on their emotions. Since only one term was chosen from each category, a minor reformulation to the wording of the eight labels around the perimeter of the circumplex was undertaken, as shown in Figure . The placement of each of the eight emotions in this circular form means that each can be assigned a respective angle at 45 increments in a counter-clockwise direction (Griffiths et al., Citation2015), where the emotion ‘Happy’ represents 0
. The equal spacing of the labels on the model is supported by the majority of studies described in Section 2, that utilise either a Russell or Thayer type model of emotion.
Figure 3. Russell's eight categories placed in a circular order on the circumplex model.
These approaches permit the resultant data from participants to be placed in affective space, afforded by the circumplex model, using polar coordinates, where valence pertains to an angle θ and arousal refers to the radius ρ. As such, the ratings obtained are unipolar in nature, which is more applicable in this case, since it is argued that the opposite ends of the dimensions could be independent of one another (Watson & Tellegen, Citation1999). This approach allows a translation of the information from participants to the circumplex model. These points can then be converted to Cartesian co-ordinates for convenience and to allow for each emotional response to be mapped to the dimensions of valence v and arousal a using the standard form
(1)
(1)
(2)
(2) For example, consider a song receiving a participant rating of ‘sad’ and a strength of emotion rating of 4. This is represented as an angle
and radius
. It then follows that valence is calculated as
and arousal as
, producing the Cartesian co-ordinates
of
.
It has been shown that discrete emotion terms, with underlying arousal and valence dimensions when conducting self-reports, are just as effective as a dimensional approach, and that both of these approaches are largely applicable in this field (Eerola et al., Citation2009).
4. Study one: creation of the model
4.1. Materials
To address the lack of research examining music across multiple genres, we decided to select twenty songs, one from each of twenty identifiable music genres. The songs were selected to provide pieces of music that were available as CD-quality WAV PCM samples, and give a typical representation indicative of, and popular within, the given genre. The songs selected are described in Table . Using a cross-section of music tracks affords the system the capability to generalise, and thus be broadly applicable to a person's digital music collection, which is likely to consist of multiple styles and genres. In considering the range of broad genres included, it is accepted that these are located in the authors' own culture of Western popular music. Each song was represented at CD quality, as uncompressed PCM in the WAV format with a sample rate of 44100 Hz, 16-bit depth, two-channel stereo. For ease of reference, we refer to each song in this study by its respective genre, rather than full name.
Table 2. Songs selected for model creation.
4.2. Participants and approach
Following ethical approval from the University, users were invited to participate in the affective online self-report study principally through invitations distributed via the AUDITORY list ( http://www.auditory.org/), an email list that specialises in the discourse of auditory perception, and a convenience snowball sample from the researchers' social media presence. We recruited participants over a period of 2 months with the intention of capturing at least 25 participants responses per song for questions 1(a), 1(b), 2(a), and 2(b), explained in Figure . A total of 44 participants took part, 26 female and 18 males, the majority of whom were in the 25 to 54 age group. The full age distribution of participants is shown in Table . Each participant rated all 20 songs.
Table 3. Age distribution of participants in development study.
The study was conducted online, using a website specially developed by the researchers to elicit audio ratings with respect to emotion. Participants were advised that the study would take up to 20 min to complete, that they would be listening to 20 song excerpts from 20 musical genres and be asked to provide emotional ratings. Emphasis was placed on the participants being instructed to use a good pair of headphones or speakers.
After confirming their consent to engage with the study, participants were presented with a one-minute sample from each of the selected songs, taken from the mid-point in its duration. The songs were presented to participants in a fixed sequence. Each song appeared on a separate page of the website so as to avoid confusion. Participants were then asked a series of short questions, asking them to evaluate the perceived and induced emotional impact of each song. Subsequently, demographic information was gathered pertaining to the age range, gender, and listening device (speakers or headphones) used by each participant. Subsequently, 26 participants reported using speakers and the remaining 18 used headphones.
4.3. Results
Due to the nominal nature of the questions relating specifically to emotion and the ordinal characteristic of the emotional strength question, the mode was selected as the measure of central tendency to label each of the 20 songs. The emotional label and strength value for each song was determined by selecting the highest frequently occurring selection. User ratings for each song were verified for independence of the eight named emotion categories using Pearson's Chi-Square test. Ratings for each song were statistically significant (p<0.05), with the exception of the music from the RnB genre in terms of its induced emotion rating. We hypothesise that this may have been due to participant fatigue, since this was the last song to be rated during the study. This process was applied to determine perceived and induced emotion for each song. The resulting data for each song, alongside significance statistics, are shown in Table .
Table 4. Summary of emotional ratings from participants.
5. Study two: development of the model
With the affective rating of the songs by participants complete, the next stage was to identify significant correlations between the ratings and features extracted from the audio signal representation of each song. A total of 45 audio features were extracted from each of the songs using the MIR Toolbox (Lartillot & Toiviainen, Citation2007) feature library and the Matlab Audio Analysis Library (Giannakopoulos & Pikrakis, Citation2014). A set of audio features were selected for the modelling of arousal and valence, based upon the MER studies described in Section 2. The complete set of features used was: mean loudness; regularity loudness; tempo; low-energy rate; RMS energy; mean energy; mean energy entropy; standard deviation RMS energy; standard deviation energy; standard deviation energy entropy; median RMS energy; median energy; median energy entropy; mean zero-crossing rate; mean spectral centroid; mean spectral spread; mean spectral entropy; mean spectral flux; mean spectral roll-off; standard deviation zero-crossing rate; standard deviation spectral centroid; standard deviation spectral spread; standard deviation spectral entropy; standard deviation spectral flux; standard deviation spectral roll-off; median zero-crossing rate; median spectral centroid; median spectral spread; median spectral entropy; median spectral flux; median spectral roll-off; spectral roll-off (Hz); brightness; spectral skewness; spectral kurtosis; spectral flatness; mean spectral roughness; standard deviation spectral roughness; median spectral roughness; mode; mean onset peaks (rhythm strength); mean onset peaks – normal window (rhythm strength); mean autocorrelation peaks (rhythm regularity); mean autocorrelation peaks – compressed (rhythm regularity); and mean tempo.
The loudness and regularity of loudness features were computed from the overall music track (i.e. globally), but the rest were analysed on a frame-by-frame basis using low, mid and high-level features. Low-level features were extracted using a Hamming window with a size of 20 ms, with a hop size of 10 ms. Mid-level features were obtained using a window of 3 s in length.
The initial analysis examined the perceived emotion ratings received from the participants. Spearman's rank correlation coefficient was selected to determine the degree of association between the ratings of arousal and valence and each of the feature vectors (Hu & Kando, Citation2012). Only statistically significant audio features obtaining Spearman's and
were selected for inclusion in the model.
The energy feature correlation coefficients were calculated having removed three outliers. The removal of these outliers was deemed to be justified given our intention to strive for reliability of the dataset and the fact that each song had received 44 ratings. The songs Try Sleeping with a Broken Heart and For Whom the Bell Tolls, from the RnB and heavy metal genres, respectively, were identified as being outliers during the analysis process by calculating Cook's distance using a 4/n cut-off. The rock genre song Back in Black was also removed since it had a Cook's distance close to the cut-off (D = 0.151) and was stylistically similar to the heavy metal song, with their loudness levels being within 1.01 LUFS of one another. In terms of the rock and heavy metal songs, it may be the case that the loudness levels did not meet the expectations of their corresponding arousal ratings because of the time they were produced (1980 and 1984, respectively). In the 1980s, when the digital CD became the primary medium and engineers were cautious with respect to digital clipping, the average level of a rock song in the 1980s was −16.8 dBFS (Southall, Citation2006). This led music production at the time to move towards more compressed forms of audio mastering. The resultant features identified to represent perceived valence and arousal are described in Table .
Table 5. Audio features correlated with arousal and valence.
These features in Table show a strong link between the energy (time domain) values in each song and the arousal determination, with a similar trend between spectral (frequency domain) features and the valence dimension. This family of acoustic features and characteristics have also been studied and found effective in predicting affect by other researchers in the MER field (Hu & Yang, Citation2017; Juslin, Citation2000; Y. H. Yang, Lin, Su, et al., Citation2008).
When analysing the ratings of induced emotions, none of the audio features yielded significant results for valence or arousal, that met our threshold requirement of significance. This outcome is not surprising, given the highly subjective nature of individual emotion as well as the potential difficulty that participants may have had in identifying an experienced emotion in such a study. It is also notable that, as explained in Section 2, the majority of existing studies in MER have focused upon perceived emotion, rather than induced. This finding results in the model that is devised being functional specifically for perceived emotion in music.
The linear regression equations that model the relationship of perceived arousal and valence to each of the significant audio features are shown in Table , alongside the goodness-of-fit, measured using the coefficient of determination (), which includes the Sum of Squared Errors (SSE), and the Root Mean Squared Error (RMSE), respectively. In this MER research, we seek to evaluate the relationship between the set of emotion ratings from participants X and the predicted set of emotion ratings from the regression models Y.
Table 6. Linear regression models for perceived arousal and valence.
The coefficient of determination (Equation3(3)
(3) ) is a measure of goodness-of-fit calculated based upon set of dependent variables Y output from a regression model and calculated knowing the set of independent input variables X. This fit is expressed as the proportion of variance that can be explained by the model and has a range between 0 and 1, where larger values indicate a greater amount of variability being explained by the model and is. The coefficient of determination is calculated by
(3)
(3) where
and
are the mean values of the sets X and Y, respectively.
SSE is a measure of difference between the regression trend and the dependent variables. Therefore, it is a measure of the residual error between a prediction made by the regression model and mean participants' rating for a set of songs. Values closer to 0 indicate a better fitting model.
RMSE is the standard error of the regression model. It is the square root of the ratio between the SSE and a total number of predictions n evaluated by the model. Values closer to 0 indicate a better fitting model.
Since each of the two emotional dimensions has been mapped to three audio features, it is necessary to reduce the output of each regressor to a single value. Initially, we considered weighting each of the three features relative to Spearman's ρ from the correlation analysis. However, the differences between these were miniscule, and so it was decided to use the mean for the initial model and its evaluation. A series of Matlab functions were created that take a new song as input and would produce a set of Cartesian coordinates as output, according to the linear regression equations in Table , one representing arousal and the other valence, allowing them to be mapped to the circumplex model.
6. Ground-truth and model validation
In order to validate our model of perceived affect in music it was necessary to produce a second set of emotionally rated songs. To achieve this, a new set of music, drawn from a range of genres, was rated by a range of human participants and compared to the values generated by our system. As such, we performed a statistical comparison of a ground-truth (GT), the results from a second online self-report study, with respect to a predicted-truth (PT), which are the outputs from the affective regressor described in the previous section.
6.1. Materials
A total of 40 songs were selected for inclusion in this evaluation. These were again drawn from the twenty genres outlined in the first study, but this time two songs were chosen from each. As before, these were chosen by the researchers as being popular songs that typified their particular genre and were readily available as CD quality WAV PCM digital audio. The songs are described in Table .
Table 7. Songs selected for model evaluation.
Each song was represented as CD-quality uncompressed PCM in the WAV format with a sample rate of 44100 Hz, 16-bit depth, and two-channel stereo. For ease of future reference in the remainder of this section, we refer to songs by their respective genre, rather than full name.
6.2. Participants and approach
Following further ethical approval from the University, users were invited to participate in another affective online self-report study, principally again through the use of the AUDITORY list and a convenience snowball sample from the researchers' social media presence. A total of 158 participants took part, 75 female and 83 males, the majority of whom were in the 25 to 54 age group. The age distribution of participants is shown in Table .
Table 8. Age distribution of participants in evaluation study.
Unlike the self-report study used to create the model, this time the music tracks were randomly selected and presented to the users in order to mitigate extraneous factors, such as fatigue or training effects. Since there was a total of 40 tracks in this dataset, a subset of 10 tracks was chosen at random, without replacement, for each participant in the study. The recruitment of participants was continued until each of the 40 song samples had received a minimum of 25 valid responses.
6.3. Results
Since each participant was asked to provide ratings for 10 randomly chosen songs from the set of 40, each song did not receive an identical number of ratings. The mean number of ratings per song was 39.5 (S.D. = 5.25) with the minimum being 25 and the maximum being 54. Ratings from participants were processed in the same manner as explained in Section 3, turning the nominal and ordinal indicators into polar coordinates and then producing arousal and valence values as Cartesian coordinates. To add granularity to this evaluation, the GT data for each song is expressed as the mean of the participants' responses, expressed as Cartesian coordinates for arousal and valence. Ratings in the GT are presented along with the PT values, in arousal and valence space, in Figure .
Figure 4. Ground-truth versus predicted-truth mean arousal and valence values.
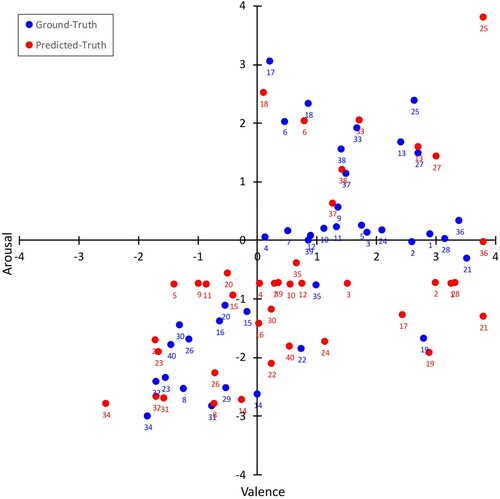
Notably, there is an absence of values in Quadrant II of Figure . Other MER datasets (Chen et al., Citation2015; Zentner et al., Citation2008) tend to exhibit a large number of responses in quadrant I and much lower responses in quadrant II. Given the number of songs examined, it is likely that these songs follow this trend, although it is recognised that this is likely to limit the ability to predict real emotional values that exist in quadrant II. Upon analysing the data in more detail, it was identified that a small number of outliers existed, which were identified by calculating Cook's distance using a 4/n cut-off. In the case of arousal, shown in Figure , two songs were defined as outliers: Mouth for War and Right In from the genres of heavy metal and dance, respectively. When investigating valence, shown in Figure , two outliers were identified: You Do Something to Me and Coumba from the genres of indie and world music.
Figure 5. GT versus PT for arousal dimension showing outliers.
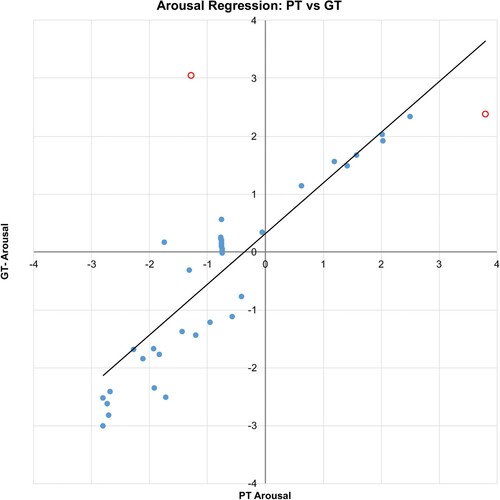
Figure 6. GT versus PT for Valence dimension showing outliers.
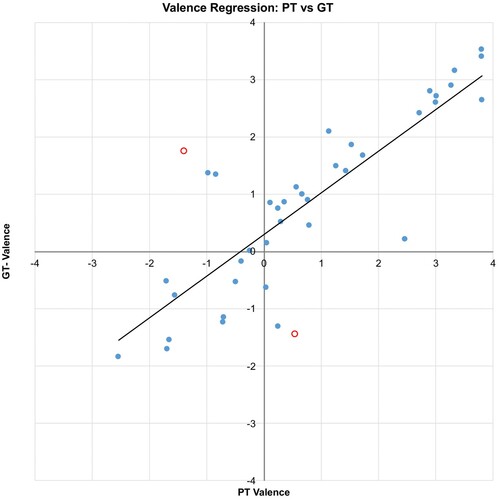
As such, it is useful to examine the model with and without the outliers included. A full description of the performance data of the model, with and without outliers included, is given in Table .
Table 9. Performance metrics for affective model.
These findings show that our system, when adjusted for outliers, explains 85.0% of the variance in the arousal dimension and 77.6% in the valence dimension. Where the outliers are included, these values reduce to 70.8% and 67.4%, respectively. The imbalance between these two values is not uncommon in the field of MER, where it is often reported that prediction of arousal is more effective than prediction of valence (Eerola et al., Citation2009; Hu & Yang, Citation2014; Kim et al., Citation2010; Y. H. Yang, Lin, Su, et al., Citation2008).
7. Analysis and comparison to existing methods
The data obtained in the previous section indicate very good levels of prediction in the system presented, especially since it has been developed using a modest corpus of songs that span multiple genres of music. To contextualise the performance of our approach, and evaluate its efficacy, it is helpful to compare it to existing work in the literature, as explored in Section 2. To this extent, Table details previous studies where it is possible to compare the prediction accuracy of the system using the coefficient of determination for arousal and valence dimensions. The values we have included in Table from these other works represents the strongest results reported, if more than one variation of an approach or dataset was presented in a publication.
Table 10. Evaluation of proposed system against existing work: (, 1st;
, 2nd;
, 3rd place ranking).
Whilst not included in the table due to the volume of individual results, it is worth also noting the MER performance metrics reported in an analysis of approaches to affective prediction in the MediaEval Database for Emotional Analysis in Music (DEAM) dataset (Aljanaki et al., Citation2017). This dataset was produced partially to address the lack of publicly available data, particularly due to copyright reasons and consists of affective ratings of 1802 songs. It documents various studies in MER that report performance metrics of with the largest values of 0.83 for arousal and 0.48 for valence. The authors indicate that the use of recurrent artificial neural networks yield the best performance.
In comparing our system to others in Table , it is shown that our system is capable of producing extremely good results, in terms of how well these musical features and models are predicting arousal and valence. Our approach outperforms those alternatives with which it is possible to draw meaningful comparison, where a small number of outliers are removed. Where outliers are not removed in the performance analysis, it still obtains better valence prediction than the majority of other methods, which has already been identified as being the harder of the two dimensions to reliably model (Eerola et al., Citation2009; Hu & Yang, Citation2014; Kim et al., Citation2010; Y. H. Yang, Lin, Su, et al., Citation2008).
In addition to this, the system with outliers included maintains respectable performance in terms of arousal. These performance metrics must also be contextualised against the fact that our model has been developed and evaluated using a corpus of music that represents twenty different genres of music and which uses simple, computationally efficient, aggregated linear regressors and a small number of audio features (six), making it a lightweight, effective, and scalable tool for affective prediction of music.
8. Conclusions and future work
The results presented in this paper provide an initial indication that a functional affective playlist generator has been created and evaluated, which is able to function using music from a broad spread of genres. Using multiple linear regressors result in a computationally efficient and easily implementable approach that can label songs on the emotional arousal and valence dimensions. In particular, the approach we have described appears to be efficient in the prediction of songs on the valence dimension, where existing studies consistently report difficulties over the relative ease with which arousal can be dealt with. It is hypothesised that the spread of musical genres and use of regressors in this research might be the reason for this particular finding, since these are features of existing work in the literature where higher valence outcomes are reported (Eerola et al., Citation2009; Hu & Yang, Citation2017; Malheiro et al., Citation2016).
In terms of limiting factors for this study, there are several things to highlight. First, the number of songs used in the study is relatively small compared to other works in the MER domain, which was a deliberate and pragmatic choice to provide an initial assessment about the feasibility of the multi-genre approach. Future work is being considered using online crowdsourcing platforms, such as Amazon Mechanical Turk, to obtain ratings for a larger corpus of songs. Second, participant ratings in study one were gathered by presenting songs in a fixed sequence, which may have given rise to an order effect. Similarly, the questions about perceived and induced emotion appeared in the same sequence in both data collection activities. Third, we did not consciously make an effort to direct study one participants to focus upon, or ignore, either the music or lyrics of each song, but rather that they listen to each excerpt as they would in everyday life. However, some participants from study one highlighted that they were not sure if they should consider the lyrics or not. Consequently, in study two, we updated the instructions to explain that participants could consider lyrics or music as they wished when performing the rating. There is potential for this to have influenced the consistency of ratings in study one in particular. On reflection, providing consistency in this guidance in both studies or asking participants to extent to which they used music and lyrics in the process, would have been a way to control for any effect this may have had and is a feature that future rating studies should employ.
Even stronger validation of the models that we have presented could be achieved by further testing that makes use of existing, larger-scale datasets that contain human annotation of arousal and valence values. The selection of such datasets would need to be carefully considered, particularly with respect to cultural norms and of diversity of the material represented. The majority of existing datasets that focus on Western music tends to be narrow in genre. It may be that a process needs to take place in order to construct a new, multi-genre dataset from a range of those that currently exist. Doing this under expert selection, from musicologists, for example, would be a valid way to approach this type of task. There is also a need to account for the cultural background, preference and familiarity with songs in the dataset for anyone providing a rating. Sourcing affective ratings in controlled listening environments, using standardised reproduction equipment, rather than online methods, is another option to consider for creating highly reliable datasets in future. Such efforts would be valuable future work.
One avenue that may lead to better models would be to use the original ‘stems’ from the multitrack music recording process, rather than the final stereo mix master. Whilst this does not reflect the typical way that ordinary users store their music library, and will likely be more complex to process, it may offer more accurate and subtle insights into the emotion of the music. A successful model would only need to be applied once in this manner and the results could then be sent to end-users across their usual music download or streaming service. By evaluating the stems, as opposed to all of the content, affective nuances such as articulation (e.g. legato or staccato), what key the music is in, and whether its mode is mostly major or minor could be more noticeable.
Future work would benefit from looking at as wide a range of audio features as possible to determine those that are the most useful predictors of affect, especially since this is an aspect of MER that is continually evolving (Panda et al., Citation2018).
As outlined in the introduction, the system presented here forms part of an affective and contextual audio playlist generator (Griffiths et al., Citation2015, Citation2016). As such, other expansions of the work include evaluating the affective features in tandem with contextual ones and to determine an appropriate balance or relationship between the two. In the longer-term, since it is possible to produce a two-dimensional prediction of each piece of music in a library, we intend to examine the effect of users being able to plot emotional vectors through this space. This, for example, would allow users to indicate their current emotional state and to specify a destination state and a time duration over which the transition is to be made, theoretically allowing them to move from one emotional state to another. We foresee particular applications of this type of system in healthcare and exercise applications, particularly where mental health issues may be present and where regulation of mood may help to reduce stress and agitation, or to prevent users from transitioning from low mood to a state of depression. This could be especially poignant in the care of people living with dementia, autistic spectrum disorder, stroke, or acquired brain injury, for example.
Disclosure statement
No potential conflict of interest was reported by the author(s).
References
- Aljanaki, A., Yang, Y. H., & Soleymani, M. (2017). Developing a benchmark for emotional analysis of music. PLoS ONE, 12(3), e0173392. https://doi.org/https://doi.org/10.1371/journal.pone.0173392
- Barthet, M., Fazekas, G., & Sandler, M. (2012, June 19–22). Music emotion recognition: From content- to context-based models. Proceedings of Ninth International Symposium on Computer Music Modeling and Retrieval, London, UK.
- Barthet, M., Marston, D., Baume, C., Fazekas, G., & Sandler, M. (2013, November 4–8). Design and evaluation of semantic mood models for music recommendation. Proceedings of 14th International Society for Music Information Retrieval Conference, Curitiba, PR, Brazil.
- Baume, C., Fazekas, G., Barthet, M., Marston, D., & Sandler, M. (2014, January 26–29). Selection of audio features for music emotion recognition using production music. Audio Engineering Society Conference: 53rd International Conference: Semantic Audio, London, UK.
- Berenzweig, A., Logan, B., Ellis, D. P., & Whitman, B. (2004). A large-scale evaluation of acoustic and subjective music-similarity measures. Computer Music Journal, 28(2), 63–76. https://doi.org/https://doi.org/10.1162/014892604323112257
- Bigand, E., Vieillard, S., Madurell, F., Marozeau, J., & Dacquet, A. (2005). Multidimensional scaling of emotional responses to music: The effect of musical expertise and of the duration of the excerpts. Cognition & Emotion, 19(8), 1113–1139. https://doi.org/https://doi.org/10.1080/02699930500204250
- Bradley, M. M., & Lang, P. J. (1994). Measuring emotion: The self-assessment manikin and the semantic differential. Journal of Behavior Therapy and Experimental Psychiatry, 25(1), 49–59. https://doi.org/https://doi.org/10.1016/0005-7916(94)90063-9
- Calvo, Rafael A., & D'Mello, Sidney. (2010). Affect detection: An interdisciplinary review of models, methods, and their applications. IEEE Transactions on Affective Computing, 1(1), 18–37. https://doi.org/https://doi.org/10.1109/T-AFFC.2010.1
- Chang, C. Y., Lo, C. Y., Wang, C. J., & Chung, P. C. (2010, December 16–18). A music recommendation system with consideration of personal emotion. International Computer Symposium (ICS2010), Tainan, Taiwan.
- Chen, Y. A., Yang, Y. H., Wang, J. C., & Chen, H. (2015, April 19–24). The AMG1608 dataset for music emotion recognition. IEEE International Conference on Acoustics, Speech and Signal Processing (ICASSP), South Brisbane, QLD, Australia.
- Collier, G. L. (2007). Beyond valence and activity in the emotional connotations of music. Psychology of Music, 35(1), 110–131. https://doi.org/https://doi.org/10.1177/0305735607068890
- Cooke, D. (1990). The language of music (Reprint). Oxford University Press, USA.
- Deng, J. J., & Leung, C. (2012, October 23–25). Emotion-based music recommendation using audio features and user playlist. 6th International Conference on New Trends in Information Science, Service Science and Data Mining (ISSDM2012), Taipei, Taiwan.
- Dibben, N. (2004). The role of peripheral feedback in emotional experience with music. Music Perception, 22(1), 79–115. https://doi.org/https://doi.org/10.1525/mp.2004.22.1.79
- Drossos, K., Floros, A., Giannakoulopoulos, A., & Kanellopoulos, N. (2015). Investigating the impact of sound angular position on the listener affective state. IEEE Transactions on Affective Computing, 6(1), 27–42. https://doi.org/https://doi.org/10.1109/TAFFC.2015.2392768
- Eerola, T. (2011). Are the emotions expressed in music genre-specific? An audio-based evaluation of datasets spanning classical, film, pop and mixed genres. Journal of New Music Research, 40(4), 349–366. https://doi.org/https://doi.org/10.1080/09298215.2011.602195
- Eerola, T., Lartillot, O., & Toivianen, P. (2009, October 26–30). Prediction of multi-dimensional emotion ratings in music from audio using multivariate regression models. 10th International Society for Music Information Retrieval Conference (ISMIR 2009), Kobe, Japan.
- Eerola, T., & Vuoskoski, J. K. (2011). A comparison of the discrete and dimensional models of emotion in music. Psychology of Music, 39(1), 18–49. https://doi.org/https://doi.org/10.1177/0305735610362821
- Eerola, T., & Vuoskoski, J. K. (2012). A review of music and emotion studies: Approaches, emotion models, and stimuli. Music Perception: An Interdisciplinary Journal, 30(3), 307–340. https://doi.org/https://doi.org/10.1525/mp.2012.30.3.307
- Ekman, P. (1992). An argument for basic emotions. Cognition & Emotion, 6(3–4), 169–200. https://doi.org/https://doi.org/10.1080/02699939208411068
- Ekman, P. (1999). Basic emotions. In T. Dalgleish & M. J. Power (Eds.), Handbook of cognition and emotion (pp. 45–60). John Wiley & Sons, Ltd.
- Gabrielsson, A. (2001). Emotions in strong experiences with music. In P. N. Juslin & J. A. Sloboda (Eds.), Music and emotion: Theory and research (pp. 431–449). Oxford University Press.
- Giannakopoulos, T., & Pikrakis, A. (2014). Introduction to audio analysis: A MATLAB approach. Academic Press.
- Griffiths, D., Cunningham, S., & Weinel, J. (2015, September 8–11). A self-report study that gauges perceived and induced emotion with music. Internet Technologies and Applications (ITA 15), Wrexham, UK.
- Griffiths, D., Cunningham, S., & Weinel, J. (2016, July 12–14). An interactive music playlist generator that responds to user emotion and context. Electronic Visualisation and the Arts (EVA), London, UK.
- Hadjidimitriou, S. K., & Hadjileontiadis, L. J. (2013). EEG-based classification of music appraisal responses using time-frequency analysis and familiarity ratings. IEEE Transactions on Affective Computing, 4(2), 161–172. https://doi.org/https://doi.org/10.1109/T-AFFC.2013.6
- Hagras, H. (2018). Toward human-understandable, explainable AI. Computer, 51(9), 28–36. https://doi.org/https://doi.org/10.1109/MC.2018.3620965
- Hu, X., & Kando, N. (2012, October 8–12). User-centered Measures vs. System effectiveness in finding similar songs. 13th International Society for Music Information Retrieval Conference (ISMIR 2012), Porto, Portugal.
- Hu, X., & Yang, Y. H. (2014, September 14–20). A study on cross-cultural and cross-dataset generalizability of music mood regression models. 40th International Computer Music Conference (ICMC 2014), Athens, Greece.
- Hu, X., & Yang, Y. H. (2017). Cross-dataset and cross-cultural music mood prediction: A case on western and Chinese pop songs. IEEE Transactions on Affective Computing, 8(2), 228–240. https://doi.org/https://doi.org/10.1109/TAFFC.2016.2523503
- Huq, A., Bello, J. P., & Rowe, R. (2010). Automated music emotion recognition: A systematic evaluation. Journal of New Music Research, 39(3), 227–244. https://doi.org/https://doi.org/10.1080/09298215.2010.513733
- Ilie, G., & Thompson, W. F. (2006). A comparison of acoustic cues in music and speech for three dimensions of affect. Music Perception, 23(4), 319–330. https://doi.org/https://doi.org/10.1525/mp.2006.23.4.319
- Jun, S., Rho, S., Han, B J., & Hwang, E. (2008, July 29–August 1). A fuzzy inference-based music emotion recognition system. 5th International Conference on Visual Information Engineering (VIE 2008), Xi'an, China.
- Juslin, P. N. (2000). Cue utilization in communication of emotion in music performance: Relating performance to perception. Journal of Experimental Psychology: Human Perception and Performance, 26(6), 1797–1813. https://doi.org/https://doi.org/10.1037/0096-1523.26.6.1797
- Juslin, P. N. (2009). Emotional responses to music. In S. Hallam, I. Cross, & M. Thaut (Eds.), Oxford Handbook of Music Psychology (1st Edn). Oxford University Press.
- Juslin, P. N. (2013). What does music express? Basic emotions and beyond. Frontiers in Psychology, 4, 596. https://doi.org/https://doi.org/10.3389/fpsyg.2013.00596
- Juslin, P. N., & Laukka, P. (2004). Expression, perception, and induction of musical emotions: A review and a questionnaire study of everyday listening. Journal of New Music Research, 33(3), 217–238. https://doi.org/https://doi.org/10.1080/0929821042000317813
- Juslin, P. N., & Sloboda, J. (2011). Handbook of music and emotion: Theory, research, applications. Oxford University Press.
- Kallinen, K. (2005). Emotional ratings of music excerpts in the western art music repertoire and their self-organization in the Kohonen neural network. Psychology of Music, 33(4), 373–393. https://doi.org/https://doi.org/10.1177/0305735605056147
- Kamalzadeh, M., Baur, D., & Möller, T. (2012, October 8–12). A survey on music listening and management behaviours. 13th International Society for Music Information Retrieval Conference (ISMIR 2012), Porto, Portugal.
- Kim, Y. E., Schmidt, E. M., Migneco, R., Morton, B. G., Richardson, P., Scott, J., Speck, J. A., & Turnbull, D. (2010, August 9–13). Music emotion recognition: A state of the art review. 11th International Society for Music Information Retrieval Conference (ISMIR 2010), Utrecht, Netherlands.
- Koelstra, S., Muhl, C., Soleymani, M., Lee, J. S., Yazdani, A., Ebrahimi, T., Pun, T., Nijholt, A., & Patras, I. (2011). Deap: A database for emotion analysis; using physiological signals. IEEE Transactions on Affective Computing, 3(1), 18–31. https://doi.org/https://doi.org/10.1109/T-AFFC.2011.15
- Krause, A. E., North, A. C., & Hewitt, L. Y. (2015). Music-listening in everyday life: Devices and choice. Psychology of Music, 43(2), 155–170. https://doi.org/https://doi.org/10.1177/0305735613496860
- Kreutz, G., Ott, U., Teichmann, D., Osawa, P., & Vaitl, D. (2008). Using music to induce emotions: Influences of musical preference and absorption. Psychology of Music, 36(1), 101–126. https://doi.org/https://doi.org/10.1177/0305735607082623
- Lartillot, O., & Toiviainen, P. (2007, September 10–15). A MATLAB toolbox for musical feature extraction from audio. 10th International Conference on Digital Audio Effects (DAFx-07), Bordeaux, France.
- Leman, M., Vermeulen, V., L. De Voogdt, Moelants, D., & Lesaffre, M. (2005). Prediction of musical affect using a combination of acoustic structural cues. Journal of New Music Research, 34(1), 39–67. https://doi.org/https://doi.org/10.1080/09298210500123978
- Lu, L., Liu, D., & Zhang, H. J. (2005). Automatic mood detection and tracking of music audio signals. IEEE Transactions on Audio, Speech, and Language Processing, 14(1), 5–18. https://doi.org/https://doi.org/10.1109/TSA.2005.860344
- Malheiro, R., Panda, R., Gomes, P., & Paiva, R. P. (2016). Emotionally-relevant features for classification and regression of music lyrics. IEEE Transactions on Affective Computing, 9(2), 240–254. https://doi.org/https://doi.org/10.1109/TAFFC.2016.2598569
- Mo, S., & Niu, J. (2017). A novel method based on OMPGW method for feature extraction in automatic music mood classification. IEEE Transactions on Affective Computing, 10(3), 313–324. https://doi.org/https://doi.org/10.1109/T-AFFC.5165369
- Mobasher, B., Cooley, R., & Srivastava, J. (2000). Automatic personalization based on web usage mining. Communications of the ACM, 43(8), 142–151. https://doi.org/https://doi.org/10.1145/345124.345169
- Myint, E. E. P., & Pwint, M. (2010, July 5–7). An approach for multi-label music mood classification. 2nd International Conference on Signal Processing Systems, Dalian, China.
- North, A. C., Hargreaves, D. J., & Hargreaves, J. J. (2004). Uses of music in everyday life. Music Perception, 22(1), 41–77. https://doi.org/https://doi.org/10.1525/mp.2004.22.1.41
- Panda, R., Malheiro, R., & Paiva, R. P. (2018). Novel audio features for music emotion recognition. IEEE Transactions on Affective Computing, 11(4), 614–626. https://doi.org/https://doi.org/10.1109/T-AFFC.5165369
- Panksepp, J. (1992). A critical role for ‘affective neuroscience’ in resolving what is basic about basic emotions. Psychological Review, 99(3), 554–560. https://doi.org/https://doi.org/10.1037/0033-295X.99.3.554
- Pesek, M., Strle, G., Kavčič, A., & Marolt, M. (2017). The Moodo dataset: Integrating user context with emotional and color perception of music for affective music information retrieval. Journal of New Music Research, 46(3), 246–260. https://doi.org/https://doi.org/10.1080/09298215.2017.1333518
- Resnicow, J. E., Salovey, P., & Repp, B. H. (2004). Is recognition of emotion in music performance an aspect of emotional intelligence? Music Perception, 22(1), 145–158. https://doi.org/https://doi.org/10.1525/mp.2004.22.1.145
- Ricci, F., Rokach, L., & Shapira, B. (2011). Introduction to recommender systems handbook. In F. Ricci, L. Rokach, B. Shapira, & P. B. Kantor (Eds.), Recommender systems handbook (pp. 1–35). Springer US.
- Ritossa, D. A., & Rickard, N. S. (2004). The relative utility of ‘pleasantness’ and ‘liking’ dimensions in predicting the emotions expressed by music. Psychology of Music, 32(1), 5–22. https://doi.org/https://doi.org/10.1177/0305735604039281
- Roda, A., Canazza, S., & De Poli, G. (2014). Clustering affective qualities of classical music: Beyond the valence-arousal plane. IEEE Transactions on Affective Computing, 5(4), 364–376. https://doi.org/https://doi.org/10.1109/TAFFC.2014.2343222
- Russell, J. A. (1980). A circumplex model of affect. Journal of Personality and Social Psychology, 39(6), 1161–1178. https://doi.org/https://doi.org/10.1037/h0077714
- Saari, P., Barthet, M., Fazekas, G., Eerola, T., & Sandler, M. (2013). Semantic models of musical mood: Comparison between crowd-sourced and curated editorial tags. 2013 IEEE International Conference on Multimedia and Expo Workshops (ICMEW), 1–6.
- Saari, P., Fazekas, G., Eerola, T., Barthet, M., Lartillot, O., & Sandler, M. (2015). Genre-adaptive semantic computing and audio-based modelling for music mood annotation. IEEE Transactions on Affective Computing, 7(2), 122–135. https://doi.org/https://doi.org/10.1109/TAFFC.2015.2462841
- Scherer, Klaus R. (2004). Which emotions can be induced by music? What are the underlying mechanisms? And how can we measure them? Journal of New Music Research, 33(3), 239–251. https://doi.org/https://doi.org/10.1080/0929821042000317822
- Scherer, K. R. (2000). Psychological models of emotion. In J. C. Borod (Ed.), The neuropsychology of emotion (pp. 137–162). Oxford University Press.
- Scherer, K. R., Shuman, V., Fontaine, J., & Soriano Salinas, C. (2013). The GRID meets the wheel: Assessing emotional feeling via self-report. In J. J. R. Fontaine, K. R. Scherer, & C. Soriano (Eds.), Components of emotional meaning: A sourcebook. Oxford University Press.
- Schmidt, E. M., Turnbull, D., & Kim, Y. E. (2010, March 29–31). Feature selection for content-based, time-varying musical emotion regression. International Conference on Multimedia Information Retrieval (MIR '10), Philadelphia, PA.
- Schubert, E. (2003). Update of the Hevner adjective checklist. Perceptual and Motor Skills, 96(3 Suppl), 1117–1122. https://doi.org/https://doi.org/10.2466/pms.2003.96.3c.1117.
- Schubert, E. (2011). Continuous self-report methods. In P. N. Juslin & J. Sloboda (Eds.), Handbook of music and emotion: Theory, research, applications. Oxford University Press.
- Shao, B., Wang, D., Li, T., & Ogihara, M. (2009). Music recommendation based on acoustic features and user access patterns. IEEE Transactions on Audio, Speech, and Language Processing, 17(8), 1602–1611. https://doi.org/https://doi.org/10.1109/TASL.2009.2020893
- Southall, N. (2006). Imperfect sound forever. Stylus Magazine, 1.
- Stumpf, S., & Muscroft, S. (2011, July 11–15). When users generate music playlists: When words leave off, music begins? 2011 IEEE International Conference on Multimedia and Expo, Barcelona, Spain.
- Sun, X., & Tang, Y. (2009, December 12–14). Automatic music emotion classification using a new classification algorithm. Second International Symposium on Computational Intelligence and Design, Changsha, China.
- Thayer, R. E. (1990). The biopsychology of mood and arousal. Oxford University Press.
- Vuoskoski, J. K., & Eerola, T. (2011). Measuring music-induced emotion: A comparison of emotion models, personality biases, and intensity of experiences. Musicae Scientiae, 15(2), 159–173. https://doi.org/https://doi.org/10.1177/1029864911403367
- Wang, J. C., Yang, Y. H., Wang, H. M., & Jeng, S. K. (2015). Modeling the affective content of music with a Gaussian mixture model. IEEE Transactions on Affective Computing, 6(1), 56–68. https://doi.org/https://doi.org/10.1109/TAFFC.2015.2397457
- Watson, D., & Tellegen, A. (1985). Toward a consensual structure of mood. Psychological Bulletin, 98(2), 219–235. https://doi.org/https://doi.org/10.1037/0033-2909.98.2.219
- Watson, D., & Tellegen, A. (1999). Issues in dimensional structure of affect—Effects of descriptors, measurement error, and response formats: Comment on Russell and Carroll (1999). Psychological Bulletin, 125(5), 601–610. https://doi.org/https://doi.org/10.1037/0033-2909.125.5.601
- Wedin, L. (1972). Evaluation of a three-dimensional model of emotional expression in music. Psychological Laboratories. University of Stockholm.
- Weinel, J., Cunningham, S., Griffiths, D., Roberts, S., & Picking, R. (2014). Affective audio. Leonardo Music Journal, 24, 17–20. https://doi.org/https://doi.org/10.1162/LMJ_a_00189.
- Yang, Y., & Chen, H. (2011). Prediction of the Distribution of Perceived Music Emotions Using Discrete Samples. IEEE Transactions on Audio, Speech, and Language Processing, 19(7), 2184–2196. https://doi.org/https://doi.org/10.1109/TASL.2011.2118752
- Yang, Y. H., & Hu, X. (2012, October 8–12). Cross-cultural music mood classification: A comparison on English and Chinese songs. 13th International Society for Music Information Retrieval Conference (ISMIR 2012), Porto, Portugal.
- Yang, Y. H., Lin, Y. C., Cheng, H. T., & Chen, H. H. (2008, October 26–31). Mr. Emo: Music retrieval in the emotion plane. 16th ACM International Conference on Multimedia, Vancouver, British Columbia, Canada.
- Yang, Y. H., Lin, Y. C., Su, Y. F., & Chen, H. H. (2008). A regression approach to music emotion recognition. IEEE Transactions on Audio, Speech, and Language Processing, 16(2), 448–457. https://doi.org/https://doi.org/10.1109/TASL.2007.911513
- Zentner, M., & Eerola, T. (2010). Self-report measures and models. In P. N. Juslin & J. A. Sloboda (Eds.), Handbook of music and emotion: Theory, research, applications (pp. 187–221). Oxford University Press.
- Zentner, M., Grandjean, D., & Scherer, K. R. (2008). Emotions evoked by the sound of music: Characterization, classification, and measurement. Emotion, 8(4), 494–521. https://doi.org/https://doi.org/10.1037/1528-3542.8.4.494