
ABSTRACT
Trimaran hulls have some advantageous features over monohull and twin hull counterparts. Naval architects prefer to use axe bow when the achievement of high speed becomes the main design objective as this type of bow cuts through water rather than rising on top of waves. Structural and hydrodynamic behaviours of an axe bow trimaran depend significantly on its design features as well as the operating environment. However, such behaviours are unknown when the hull experiences nearshore wave reflections. Therefore, a scaled-model hull has been tested in coastal wave basin to investigate its behaviour under nearshore wave reflections focusing mainly on the hull’s motions in various heading directions as well as in various wave frequencies. The results presented also relate motions with the wave pressures indicating that an axe bow trimaran hull, travelling near shorelines, experiences unusual motions and wave loadings when it encounters waves influenced by nearshore reflections.
1. Introduction
A trimaran vessel constructed with a central and two outer hulls generally provides static and dynamic stabilities that are exemplary due to its unique features such as very wide beam, low draught and slender hulls. In addition, a trimaran hull offers excellent seakeeping performances in wavy seas, reduced wave making resistance and increased fuel efficiency at high speeds; provides large deck areas and allows access to the areas that are inaccessible for its mono-hull counterparts (Fang and Chen Citation2008; Hafez and El-Kot Citation2012; Luhulima et al. Citation2014). The righting arm or the GZ value is an important parameter of a hull to identify its stability characteristics. It is well established that the higher the GZ values, the better the statical and the dynamical stabilities. The maximum GZ value occurs for a trimaran hull at a very low angle of heel compared to that of any monohull and/or even catamaran vessels. This means a trimaran hull requires high energy input in order to heel to a small angle. Due to these advantages, trimaran hull was able to attract the attentions of naval architects and had been proved to be second to none as high-speed commercial and naval vessels (Fang and Chen Citation2008). However, the sizes of the outer hulls and the transverse distances of those outer hulls from the central hull directly affect the flow behaviours and these, in turn, affect the hydrodynamic performances of a trimaran vessel. A number of researchers (Fang and Chen Citation2008; Yu et al. Citation2015) suggested that the sizes of the outer hulls and its distances from the central hull should be optimized for all headings to maximize the hydrodynamic behaviours of a trimaran vessel. In addition, shifting the longitudinal positions of the two outer hulls towards forward (i.e. putting at a position further away from the stern) may reduce wave loads (Fang and Chen Citation2008). Tang et al (Citation2016) investigated the motion behaviour and the vibration responses of a trimaran hull subjected to oblique waves. They found that both heave and roll motions are sensitive to beam seas, whereas pitch motion is severe in following seas. Furthermore, slamming and whipping loads for trimaran vessels are severe in heavy seas. Katayama et al. (Citation2009) identified that high-speed trimaran hull experiences parametric rolling in head seas. This type of rolling can cause severe passenger and crew discomforts, extreme pressures on the hulls, non-linear propeller torque and reduced stability. Thus, trimaran hull should be designed carefully to avoid such rolling motions.
In general, a marine vessel with an axe bow is considered very effective in normal to moderate wavy seas and this is because the bow of the vessel (due to its sliced shape and low buoyancy) cuts through water rather than riding on top of wave crests. However, in heavy seas, an axe bow vessel shows a tendency of digging into waves and taking green water on its deck causing bow trimming and free surface effects. For this reason, the depth of the forward part of an axe bow hull is higher compared to the rest of the body. Since the buoyancy produced by an axe bow is relatively low in comparison with that of the conventional bows, usable deck area at the fore part of an axe bow hull is relatively limited. As a result, load distributions along the length of an axe bow hull are carried out carefully so that bow section carries fewer load but matches with its buoyancy. If an axe bow part of the hull is over-loaded for some reasons, the hull would experience a trim by the bow. Deng et al (Citation2015) studied the effects of trimming and sinkage on the hydrodynamic resistance of a trimaran hull. They identified that both parameters accelerate the total resistance of the hull and the effects become significant when a trimaran hull runs at high speeds. Jiang et al (Citation2016) investigated the hydrodynamic performances of a planing trimaran and discovered that the lift force produced by the connecting structure between the central hull and one of the outer hulls known as tunnel plays an important role in determining the resistance of the hull. The higher the lift force produced by the tunnel, the lower the resistance of a trimaran hull.
However, the available literature published elsewhere up to date confirms that most of the researchers have focused mainly on investigating the hydrodynamic performances of trimaran vessels those operate in deep seas. To the best of the authors’ knowledge, there are so far no published research works which have reported the motions of an axe bow trimaran hull when it operates with high speeds near shorelines. Therefore, the behaviours of a trimaran that is travelling near a shore and experiencing nearshore wave reflections still remain a mystery. Since a trimaran hull would often need to be operated near shorelines for embarking and disembarking purposes, a trimaran hull’s motion behaviour as well as structural safety while in coastal water is necessary to be investigated urgently to improve hull design. It is worth mentioning that identifications and estimations of the wave pressures generated on various locations within a trimaran hull have the same importance as the identifications and the measurements of the global wave loads for the entire hull. This is because wave loads are different at different parts of a hull and vary with wave properties as well as with a vessel’s heading direction. Location-based hull loading information can help to identify the vulnerable locations that need to be strengthened further to avoid catastrophic hull structural failures. This is particularly important for axe bow vessel as this type of bow section is constructed with light structures. This is because an axe bow has a shape similar to an axe, hence, the name. The sectional areas of an axe bow portion of the hull are smaller in values, thus the underwater volume of an axe bow section is also smaller compared to the underwater volumes of the other parts of the hull. Since the underwater volume defines the buoyancy of a hull, an axe bow portion produces very low buoyancy compared to the rest of the hull. If the bow is constructed in such a way that it becomes heavier than the amount of buoyancy it produces, the hull would experience trim by the bow. Therefore, (to avoid any design trim) an axe bow section should be constructed as light as possible to match the downward force generated by the self-weight of the bow section with the upward force exerted by the buoyancy of that section. In general, a bow of a vessel is susceptible to slamming, whipping, pounding and panting; therefore, the hull structure at bow locations should be sufficiently strengthened. In addition, a high-speed trimaran vessel experiences splitting moment, tunnel slamming as well as wet deck slamming and these factors accelerate the fatigue damage mechanism of the hull (Shehzad et al. Citation2013). Hence, the work presented in this paper investigates the wave pressures generated at various locations of an axe bow trimaran hull and its corresponding motion behaviours under various heading directions, wave frequency and wave amplitude influenced by nearshore wave reflections.
2. Materials and methods
2.1. Model development
To investigate the hydrodynamic behaviour of a full-size vessel using a scaled model hull in a laboratory tank or basin, it is required to achieve the geometric, the dynamic and the kinematic similarities between the full-size hull and the scaled model hull. It is worth mentioning that the finite depth of a water tank or basin in a laboratory might affect the hydrodynamic behaviour of the model hull during testing. As a result, model hull dimensions should be determined using a suitable scale that is appropriate for the laboratory and ensure sufficient clearance between the model hull bottom and the tank/basin floor. Keeping this in mind, a 1:130 scale was utilized to create a computer model of an axe-bow trimaran hull (as can be seen in ) to use in this study. The detailed dimensions of the model corresponding to the dimensions of the basin (where all the tests have been carried out) are shown in .
Figure 1. Computer model of an axe bow trimaran hull presented in isometric view.
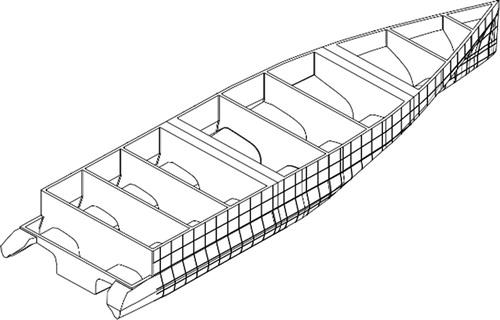
Table 1. Principal particulars of the model (in meter).
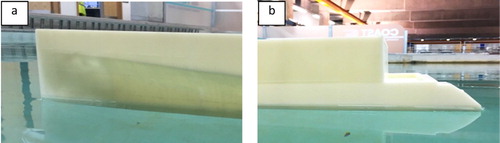
The scaled dimensions of the computer model presented in have also been chosen carefully to ensure that there are sufficient internal spaces available within the model hull to house necessary instrumentations. The scaled physical model has been manufactured using the developed computer model and a 3D printing facility. It should be noted that a 3D printing machine has been used so that all the critical design features presented within the computer model could be captured accurately. The density of the material used in 3D printing machine to print the model has been carefully selected to ensure that the model floats at scaled draught resembling the original design draft of the full-scale hull. Before printing the model hull, three solid cubes have been printed with different material densities to verify whether the actual density of the product is different from that of the theoretically calculated density. In addition, tensile and compressive strengths tests have been performed to identify whether the density of the material chosen for printing the model provides sufficient strength to withstand the wave loads during testing. The printed model in its final form has been tested on a calm water within the basin (as shown in ) to ensure that the model achieves required draught during testing. The mass displacement of the model hull at the design draft has been identified as 1.146 kg.
Figure 2. Images showing the 3D printed model hull during testing of design draught and displacement: (a) bow section and (b) stern section.
2.2 Experimental set-up
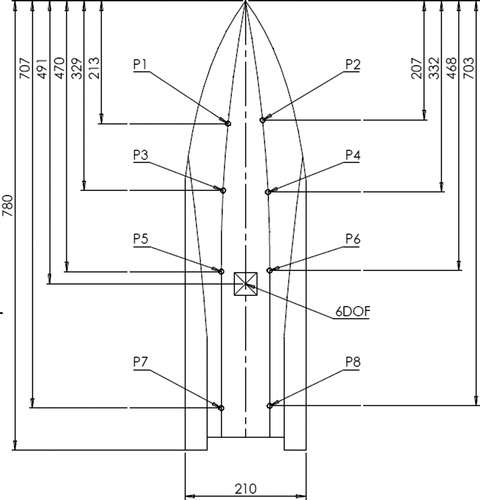
A six degrees of freedom (6DOF) motion sensor has been mounted on the centre of gravity (CoG) of the model hull. This has been done to ensure that all motions of the hull under wave reflections are captured and monitored properly at the CoG of the hull. To record the wave pressures experienced by the model hull at various locations, eight holes of diameter 4.1 mm each have been drilled into the sides of the centre hull to insert eight Pitot tube-type pressure sensors. Once inserted, a marine grade adhesive has been applied to seal the gaps around the Pitot tubes so that the watertight integrity of the hull is maintained. A clearance of 0.1 mm between the Pitot tubes’ metal pipes and the corresponding holes has been maintained to ensure a strong adhesive bond. Excess metal pipes of the Pitot tubes have been cut into appropriate lengths prior to inserting into the holes. The model with six degrees of freedom motion sensor mounted at the CoG along with the pressure sensors is shown in . The exact positions of the sensors within the model hull are shown in .
Figure 3. The model hull equipped with eight pressure sensors and a 6DOF motion sensor floating in the coastal wave basin.
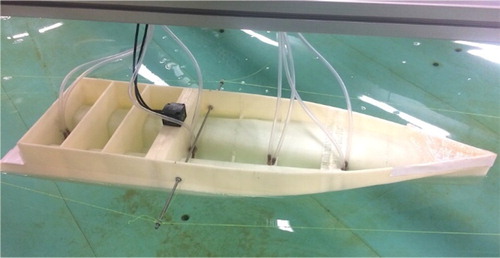
Figure 4. Schematic diagram showing the positions of eight pressure sensors (designated as P1-P8) and the motion sensor (i.e. 6DOF) within the model hull. Dimensions shown are in mm.
All the tests have been carried out in a coastal wave basin which is 15.5 m long and 10 m wide with a maximum operating depth of 0.5 m. The basin is equipped with 20 absorbing piston paddles which operate as five modules of four paddles. Each paddle’s dimension is 0.5 by 0.5 m. Each of the five modules can be configured close coupled as a straight line or an arc or an individual. The paddles operate with the help of a wave synthesizing software capable of producing long- and short-crested spectral sea states with special wave effects. The software requires the user to define one of the standard spectra (e.g. Bretschneider, ITTC two-parameter, Pierson Moskowitz, JONSWAP etc.) for creating irregular waves. The paddles in the basin can produce regular waves with a peak wave height of 0.32 m and is also capable of generating oblique waves up to 40 degrees from normal. In the present study, the software has been set up by defining wave amplitudes and frequencies (as shown in ) to generate unidirectional regular waves. The basin is arranged with wave generating paddles in one end and a sloping beach representing shorelines in the other end. The laboratory beach has been constructed in such a way that it can simulate a fixed-bed beach and support sediment transports and coastal erosions. Therefore, the wave-beach interaction used in this experiments is considered as a laboratory representation of real-world nearshore wave behaviour. A number of published articles (Hukuda and Mysak Citation1982; Xu et al. Citation1997; Body and Ehrenmark Citation1998; Jensen et al. Citation2003; De Bakker et al. Citation2015) have investigated the role of a beach on wave damping. It has been identified that a beach absorbs wave energy and reduces wave reflections (Xu et al. Citation1997). A sloping beach with a maximum 12.5° angle of slope breaks waves and absorbs wave energy. The linear bottom friction on a sloping beach, where the water depth is zero along the coast line acts as a wave damping mechanism (Hukuda and Mysak Citation1982). The infragravity waves that propagate towards beach as free waves generally reflect from the shorelines and create cross-shore standing waves. However, the incoming infragravity waves lose considerable amount of energy near the shoreline (De Bakker et al. Citation2015). Therefore, it can be said that a beach reduces reflection by absorbing wave energy to some extent but does not completely eliminate reflection. It is anticipated that the wave-beach interaction arrangement applied in this experiment is a true representation of a real-world scenario and would be good enough to study the effects of nearshore wave reflections on hull motions. The wave heights in the basin have been continuously monitored using four wave gauges placed in various locations within the basin. The paddles have been programmed in such a way that desired wave heights are achieved and maintained throughout the duration of the tests. The software that operates the paddles in the basin suggests the distance from the paddles where the model should be placed. This is to ensure that the wave reaches to its maximum wave height before interacting with the model hull. The basin is also equipped with five individually controlled pumps located across the basin to generate currents. However, the pumps have not been operated during the tests so that only the effects of waves and the reflections on the model hull are captured.
Table 2. Wave parameters used in the tests.
In addition to four installed wave gauges, the test rig has been constructed carefully with two water-resistant high-speed motion capture cameras to monitor and analyse waves and wakes visually. The pressure sensors utilized are analogue output differential pressure sensors with a range ±2.49 kPa in an SIP AA package. The range for the 6DoF motion sensor is ±100 deg/s for angular rate and ±5 g for acceleration. Electrical components have been wired to a computer located next to the wave basin and calibrated prior to each test. The model hull has been tested at zero forward speed to capture the impacts of waves and nearshore reflections. The wave generating machine has been programmed according to the requirements of each of the tests planned. All the data have been recorded using computerized data acquisition system. Whenever a test has been paused, all the associated equipment have been recalibrated prior to restarting the test. A total of 22 tests have been conducted with various test set-ups and the gathered data have been analysed. Once a perfect experimental set-up has been identified, a series of actual tests have been conducted changing three variables: vessel heading, wave amplitude and wave frequency. The parameters used for the test set-ups are shown in . The model hull was completely stationary with a mooring arrangement that allowed the hull to float naturally having free motions in six degrees. The wave generating paddles have produced waves in unidirections. Therefore, the model hull’s orientations had been changed with respect to the directions of the waves to achieve head, beam and following seas. A 180 degree heading direction refers to a head sea in which the bow of the hull encounters the oncoming waves and a 0 degree heading direction represents a following sea where the stern of the hull encounters the waves. In other words, the bow and the waves both travel in the same directions for following seas resembling a 0 degree orientation, whereas the head sea condition resembles a 180 degree difference between the bow and the oncoming waves as both travel in the opposite directions to each other.
For each of the heading directions, five wave amplitudes have been considered and for each amplitude, five wave frequencies have been utilized. Each test has been carried out for 120 s and all the data have been recorded in time series. An interval of two minutes between two consecutive tests has been applied to settle the water after each test. The motions of the model hull have been monitored by reading data from the motion sensor and analysing the images captured in the cameras to ensure that the model hull becomes completely stationary prior to the next test. The chosen time scale has been proved to be sufficient for the basin water to settle down. A change to the model heading direction has been occurred five times throughout the entire experiment and the changing process took approximately 15–20 min for each of the heading directions. All other changes made between the tests have only required time for setting up the wave generating software program (for changing wave amplitude and frequency) and it took no longer than two minutes for achieving calm water condition.
3. Results
A series of test data acquired from the sensors have been stored using computer-controlled data acquisition system. For each run, the data logging system has synchronized the real-time data acquired from four wave gauges, eight pressure sensors and one 6DOF motion sensor prior to record into a file. Around sixteen thousands raw data from wave gauges, pressure sensors and the motion sensor have been recorded for each of the test setting. Therefore, it was difficult to analyse all of the recorded data due to the volume of data points being captured over the entire test period as well as due to a large range of noises in the signals from all the sensors. Hence, the application of a computer code was inevitable to remove the noises from the signals. Wavemenu within Matlab was used and Wavelet 1D analyser was applied to synthesize the signals. The coding was focused on specific set-ups that displayed greater accelerations and vessel motions to provide a more detailed comparison of the vulnerable wave pressure regions along the length of the hull. The gathered raw data for all three variables (i.e. wave profile, pressure and hull motion) required different levels of manipulation to achieve usable and comparable signals. The method applied for manipulating the raw data for each of the variables and the time domain used for analysing all the signals, were the same throughout all test conditions for consistency. As well as the manipulation method to select appropriate signals from the original signals, mathematical functions were written to define components, maximums, minimums and the mean values. The preceding sections will discuss the results from the synthesized signals.
3.1. Wave properties
The heights of the waves generated in the coastal wave basin have been monitored using four wave gauges. Gauge1 and gauge2 have been placed at a distance 14.5 and 13.5 times the length of the model hull, respectively (the distances are measured from the shoreline). Both gauge3 and gauge4 have been placed at 11.5 times the length of the model hull from the same reference line. Gauge1 and gauge2 both are located behind the model hull and other two gauges are at/around midship region covering the port and the starboard sides of the model hull. shows the wave properties measured using gauge3 which is located near the midship region of the model hull. The paddles of the coastal wave basin have been programmed to produce regular waves with amplitudes 0.008, 0.014 and 0.016 m, respectively while keeping the frequency constant at 0.8 Hz. The amplitudes of the waves have been recorded continuously for the crests and the troughs, as can be seen in the data presented in , and it is obvious that the measured amplitudes are higher than the expected. Throughout the experiments, it has been observed that the amplitudes at the crests and at the troughs consistently vary over time. The maximum amplitude values at the crest and at the trough are 25% and 12.5% higher, respectively, than the expected value of 0.008 m. These values are 14.3% and 20.7%, respectively, higher than the programmed amplitude of 0.014 m, whereas 12.5% and 9.4% higher for the programmed amplitude of 0.016 m.
Table 3. Wave properties measured near the midship region.
demonstrates a comparison among the wave amplitudes measured by the wave gauges located at various positions within the basin, as outlined above. It is interesting to note that all four wave gauges have recorded amplitudes that are significantly different from the programmed amplitude of 0.016 m. The amplitude at the trough measured with gauge1 is 18.8% higher than the programmed amplitude and this is the highest variation among all the amplitudes recorded. When all the gauges have shown percentage increase in amplitudes, the trough monitored using gauge2 saw a decrease in the value. Further measurements have been carried out with different settings in amplitude and frequency and are shown in . The wave amplitude at the crest has been increased by 4.2% for gauge1, 16.7% for gauge2 and 9.4% for gauge4 but decreased by 1.0% for gauge3. However, gauge1, gauge3 and gauge4, all three gauges have recorded wave amplitudes that are, respectively, 6.3%, 27.1% and 1.0% lower than the expected values at trough. The variations in amplitudes clearly indicate that the waves experienced by the model hull are significantly influenced by the nearshore reflections.
Table 4. Wave properties measured using various wave gauges at 0.8 Hz wave frequency.
Table 5. Wave properties measured using various wave gauges at 1.2 Hz wave frequency.
3.2. Hull motion
Hull motion data have been captured continuously for the entire period of the tests through the use of a six degrees of freedom (6DOF) motion sensor. shows an example of raw motion data as received from the sensor when the hull was heading in bow quartering seas and encountering waves of amplitude 0.014 m at 1.2 Hz frequency. The figure reveals that the heave and the sway motions of the hull both are quite severe even in the bow quartering seas and there are instances where the sway motion is higher than the heave motion. Roll, pitch and yaw motions are also noticeable, but these are not as high as the translational motions. The heave motion is significant in both head and following seas. Similar to the bow quartering seas, all other rotational and translational motions have also been observed in head seas as well as in following seas and this type of motion behaviour is unusual as the roll motion should be negligible or fully absent in the head/following seas. In order to investigate further, both roll and pitch motions have been compared in for various vessel headings and wave frequencies. It has been identified that pitching motion is higher than the roll motion in all heading directions as well as in all frequencies investigated.
Figure 5. As received signals from the motion sensor (i.e. 6DOF) showing roll, pitch, yaw, sway and heave motions of the model hull.
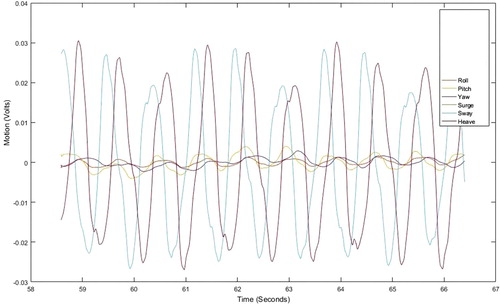
Figure 6. Plot of rotational motions (roll and pitch) of the model hull as a function of wave frequency in various heading directions.
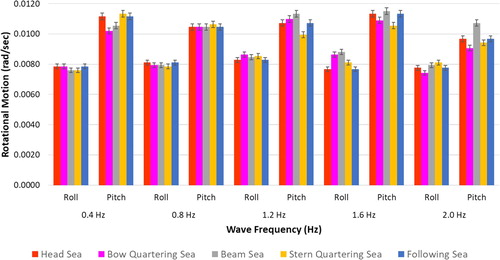
The roll motion of the model hull varies between the values 0.0076–0.0079 rad/sec for 0.4 Hz, 0.0079–0.0081 rad/sec for 0.8 Hz, 0.0083–0.0086 rad/sec for 1.2 Hz, 0.0077–0.0088 rad/sec for 1.6 Hz and 0.0074–0.0081 rad/sec for 2.0 Hz. The highest rolling motion is observed as 0.0088 rad/sec for beam seas at 1.6 Hz wave frequency. Whereas the pitching motion of the model hull varies in the range 0.0102–0.0113 rad/sec for 0.4 Hz, 0.0105–0.0106 rad/sec for 0.8 Hz, 0.0099–0.0113 rad/sec for 1.2 Hz, 0.0106–0.0113 rad/sec for 1.6 Hz and 0.0091–0.0107 rad/sec for 2.0 Hz. Among the pitching motions presented in , the highest motion is observed in stern quartering seas at 0.4 Hz as well as at 0.8 Hz wave frequencies, whereas the highest pitching motion occurred in beam seas when the hull encountered 1.2, 1.6 and 2.0 Hz wave frequencies.
3.2. Wave pressure
An increase in wave amplitude is directly related to an increase in pressure experienced by a hull. Therefore, the maximum pressure values recorded by the pressure sensors (please see where sensor positioning is defined) have been analysed to identify the relationships among the heading directions, the wave frequencies and the wave pressures. Since the entire hull surface experiences the static and the dynamic pressures produced by the waves, data from all the pressure sensors have been combined to determine the overall wave pressure exerted on the hull in various heading directions. The pressure sensors’ data reveal that the hull experiences 55.2 mBar wave pressure during travelling in head seas, whereas the pressure values are 50.8, 53.2 and 51.9 mBars in bow quartering, beam and stern quartering seas, respectively. The highest wave pressures are experienced by the hull at its bow locations which are situated at/around one-quarter length of the hull when measured from the forward perpendicular.
From the pressure sensors’ data, it has been identified that a wave frequency of 1.2 Hz has the most data points with higher values. Thus, the highest wave pressure has been experienced by the trimaran model hull at a wave frequency of 1.2 Hz compared to other frequencies. When all the data from all pressure sensors for all headings have been combined to identify the total pressure experienced by the model hull at a given frequency, it has been found that 1.2 Hz wave frequency provides the highest and 2.0 Hz wave frequency provides the smallest values of the wave pressure, respectively. As the model hull has an axe bow feature, it has very high sides along the forward one-quarter length of the hull. The high sides are to eliminate the chances of wave splash in high seas when the hull plunges through waves rather than riding on top of the waves. This might be the cause for the hull to experience high wave pressures along the bow regions compared to that of the other regions within the hull. As a result, there is a strong possibility that the hull might experience cracks/failures near the bow regions.
4. Discussion
During recording the experimental data, considerable care has been taken to increase the accuracy of the data. For example: data have been recorded 30 s after the start of a test. This is to allow the model to reach a consistent motion which cannot be achieved immediately after the start of the test. All surge, sway, heave and yaw motions have been investigated; however, emphasis has been given to capture both roll and pitch motions as these two are the most important factors that affect the stability of a hull and play important roles in determining the overall performance of the vessel. The results obtained from the tests reveal that translational motions are significantly higher than the rotational motions in head, quartering and following seas. For all the heading directions studied, pitching motion is more significant than the roll motion; however, pitching motion is higher in quartering seas for lower wave frequencies, whereas the highest pitching motion occurs in beam seas for higher wave frequencies. The maximum values of pitching motions are consistently 23–28% greater than the roll motions. It is interesting to note that occurrence of roll motion has almost a repeated pattern, whereas pitch motion occurrence is less repetitive in nature over any given period of time. The hull’s pitch motion behaviour in beam seas and roll motion behaviour in head/following seas are quite unusual. The trends in the motion behaviours of the hull observed over a given period of time appeared to be repeated at a fixed interval for the entire time history. Such trends could be due to a number of reasons. First, due to the axe bow feature of the hull, the sharp vertical bow region did not produce enough buoyancy, and this might have resulted in such motion behaviours of the hull in all sea conditions. Second, the vessel has very flat bottoms for the main hull as well as for both the side hulls. The tunnels in between the main hull and each of the side hulls have vertical sides which altogether form a rectangular channel shape. As a result, the midship section coefficient of the hull is reduced. Normally, vessels with small midship section coefficient are sensitive to roll motion (Papanikolaou Citation2014). These features along with the reduced buoyancy in the bow region might have contributed to achieve unusual motion behaviours by the vessel. Thirdly, the wave measurement data confirm that the vessel experiences higher wave amplitudes than that of the amplitudes expected by the vessel in normal sea conditions. The wave reflections from the shores have contributed to an overall increase in the amplitudes. When the crests of the regular waves collided with the crests of the shore reflected waves, an overall increase in the wave amplitudes at the crests occurred. In contrast, when the troughs of the regular waves collided with the troughs of the shore reflected waves, a significant decrease in the wave amplitudes at the troughs occurred. However, in the events where the crests of the regular waves collided with the troughs of the shore reflected waves and vice versa, the hull encountered waves with reduced wave amplitudes. Since the frequency and the amplitudes of the nearshore wave reflections depend on various factors, such as the surface slope of the shore, the water depth of the shore, the surface friction between the waves and the shore, the energy dissipation/loss by the waves after reaching the shore, the gravitational effects etc. the merging/collision between the regular waves and the nearshore reflected waves does not happen at regular intervals. Hence, the hull has continuously encountered waves with constant and/or random wave amplitudes. In addition, the nearshore reflected waves did not follow the directions of the oncoming regular waves. Thus, the hull has experienced waves from multiple directions due to the nearshore reflections. This has forced the hull to acquire strange and unusual motion behaviours in all heading directions. It is evident that roll and pitch motions both are dependent on vessel’s headings as well as wave frequency. Severe roll motions occur for the hull in beam and quartering seas. The results show that if the vessel’s heading is changed, the roll motion might be reduced significantly. As the wavelength, which is similar to the trimaran hull width, approaches the hull in beam seas, the accelerations experienced by the trimaran hull are exaggerated. Higher pressures are experienced by the windward locations of the hull as the model reaches maximum rolling displacement. When maximum values of roll and pitch are achieved simultaneously, the combination increases the pressures recorded. In short, higher wave pressures in the forward one-quarter length of the hull might have also contributed to the hull’s strange and unusual motion behaviours.
Author contributions
The paper is jointly prepared by Christopher Lewis McGibbon (C.M.) and Md Jahir Rizvi (M.R.). Conceptualization, C.M. and M.R.; methodology, C.M.; formal analysis, C.M. and M.R.; investigation, C.M.; resources, M.R.; data curation, C.M.; writing – original draft preparation, C.M.; writing – review and editing, M.R.; visualization, M.R.; supervision, M.R.
Acknowledgements
The authors would like to acknowledge the technical supports from the School of Engineering, Computing and Mathematics at the University of Plymouth for allowing the authors to use the COAST and the Rapid Prototype laboratory facilities. The authors also gratefully acknowledge the technical consultations received from the system engineers in Condor Marine Services Ltd. Help and cooperation from Mr. Nick Parkes for the model development and the experimental investigations are gratefully acknowledged. Thanks must be given to the technicians: Bob Williams to build the model using 3D printing facilities, Lee Martin for the advice on CAD model development, Andrew Oxenham and Greg Nash for setting up the test rig in the coastal wave basin and Alastair Reynolds for setting up the sensors and the electrical equipment. Special thanks to Dr Sanjay Sharma of the University of Plymouth for the help on Matlab coding. The authors also acknowledge the expert advices received from Dr Robert Allen and Dr Jasper Graham-Jones of University of Plymouth.
Disclosure statement
No potential conflict of interest was reported by the author(s).
References
- Body GL, Ehrenmark UT. 1998. Reflection of gravity waves by a steep beach with a porous bed. Fluid Mech. 359:265–280.
- De Bakker ATM, Herbers THC, Smit PB, Tissier MFS, Ruessink BG. 2015. Nonlinear infragravity-wave interactions on a gently sloping laboratory beach. Phys Oceanogr. 45(2):589–605.
- Deng R, Li C, Huang DB, Zhou GL. 2015. The effect of trimming and sinkage on the trimaran resistance calculation. Front Fluid Mech Res. 126:327–331.
- Fang MC, Chen TY. 2008. A parametric study of wave loads on trimaran ships traveling in waves. Ocean Eng. 35(8–9):749–762.
- Hafez KA, El-Kot AA. 2012. Comparative investigation of the stagger variation influence on the hydrodynamic interference of high speed trimaran. Alexandria Eng J. 51(3):153–169.
- Hukuda H, Mysak LA. 1982. On the damping of second-class trapped waves on a sloping beach. Phys Oceanogr. 12(12):1527–1531.
- Jensen A, Pedersen GK, Wood DJ. 2003. An experimental study of wave run-up at a steep beach. Fluid Mech. 486:161–188.
- Jiang Y, Sun HB, Zou J, Hu AK, Yang JL. 2016. Analysis of tunnel hydrodynamic characteristics for planing trimaran by model tests and numerical simulations. Ocean Eng. 113:101–110.
- Katayama, T., Taniguchi, T. & Umeda, N. (2009) ‘An experimental study on parametric rolling of a high speed trimaran in head sea ‘, 10th International Conference on Stability of Ships and Ocean vechicles (STAB2009). St Petersberg 22–26 June. p. 541–548.
- Luhulima, R. B., Setyawan, D. & Utama, I. K. A. P. (2014) ‘Selecting monohull, catamaran and trimaran as suitable passenger vessels based on stability and seakeeping criteria’, The 14th International Ship Stability Workshop (ISSW). 29 Sep–1 Oct; Kuala Lumpur, Malaysia. p. 262–266.
- Papanikolaou A. 2014. Ship design: methodologies of preliminary design. 1st ed. Greece: Springer.
- Shehzad K, Huilong R, Guoqing F, Khurram A. 2013. Study on spectral fatigue assessment of trimaran structure. Res J Appl Sci Eng Technol. 5(3):1015–1021.
- Tang HY, Ren HL, Li H, Zhong Q. 2016. Experimental investigation of wave-induced hydroelastic vibrations of trimaran in oblique irregular waves. Shock Vib. 2016:1–17.
- Xu Q, Pawlowski JS, Baddour RE. 1997. Development of green-naghdi models with a wave-absorbing beach for nonlinear, irregular wave propagation. Mar Sci Technol. 2(1):21–34.
- Yu W, Chen XJ, Wu GH, Liu JY, Hearn GE. 2015. A fast numerical method for trimaran wave resistance prediction. Ocean Eng. 107:70–84.