
 ?Mathematical formulae have been encoded as MathML and are displayed in this HTML version using MathJax in order to improve their display. Uncheck the box to turn MathJax off. This feature requires Javascript. Click on a formula to zoom.
Abstract
We use a spiral phase plate to generate few-cycle optical vortices from an ultrafast titanium:sapphire oscillator and characterize them in the spatiotemporal domain with a recently introduced technique based on spatially resolved Fourier transform spectrometry. The performance of this simple approach to the generation of optical vortices is analysed from a wavelength-dependent perspective as well as in the spatiotemporal domain, allowing us to characterize ultrashort vortex pulses in space, frequency and time.
1. Introduction
An optical vortex is a field with a phase singularity, such that the phase is undefined in the centre of the vortex and thus the intensity must be zero. In addition, the phase variation along a path enclosing the singularity is non-zero [Citation1], i.e.:(1)
(1)
Here , which must be an integer different from zero, is called the topological charge. In the simplest case, the phase front of the light twists helically like a corkscrew around the singularity, according to
, where
and
are the radial and angular components in cylindrical coordinates. Phase singularities in propagating wave fields were for the first time observed by Nye and Berry in ultrasound fields in the 1970s [Citation2]. Vortices in laser beams were later described [Citation3] and it was recognized by Allen and co-workers in 1992 that helically phased beams carry orbital angular momentum (OAM) [Citation4]. The particular properties of optical vortex beams have led to many applications [Citation5], such as imaging of faint objects around a bright one [Citation6] and overcoming the diffraction limit in stimulated emission depletion microscopy [Citation7].
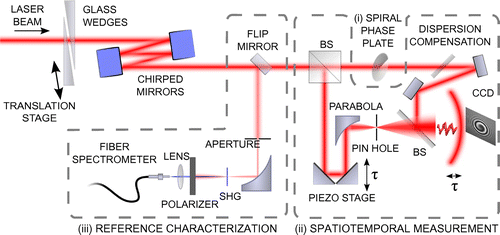
Figure 1. Schematic experimental set-up for the generation and characterization of broadband optical vortex pulses. The beam from an ultrafast oscillator is compressed with a chirped mirror and fused silica wedge compressor. The characterization set-up can be divided into three sub-sections, (i) generation of broadband vortex pulses with a spiral phase plate, (ii) spatiotemporal characterization of the vortex pulses by spatially resolved Fourier transform spectrometry with the help of a dispersion balanced Mach–Zehnder interferometer and (iii) temporal characterization of the pulse entering the interferometer by the d-scan method, allowing us to determine the reference spectral phase.
Several methods exist today to convert a Gaussian laser beam into a vortex beam. The most commonly used are based on phase masks, which are simply inserted into the beam in transmission [Citation8], diffraction holograms [Citation9] and refractive-diffractive elements [Citation10,Citation11]. Recent advances on spatial light modulators enable the production of optical vortices with added flexibility, enabling easy change of target wavelength and topological charge. Recently, optical vortices have also attracted interest in the ultrafast laser community [Citation12–Citation16]. Combining vortex pulses with high-intensity ultrashort sources opens the way for strong-field physics with singular light beams [Citation17,Citation18]. Generating ultrashort vortices is challenging since most techniques used to create monochromatic vortices have limitations when applied to broadband laser sources [Citation19]. Even though polychromatic methods have been suggested and applied to ultrashort pulse vortex generation [Citation12,Citation13,Citation20], these are usually more complex to implement, making monochromatic techniques still attractive.
An easy way to create ultrashort vortex pulses is to use a spiral phase plate, i.e. a plate, usually made of glass, with angularly increasing thickness. Transmission through glass introduces an optical phase which varies with thickness and wavelength. The thickness jump of the spiral phase plate is arranged in such way that the corresponding phase jump is an integer multiple of only at its design wavelength. It is therefore not clear what impact the inherent chromaticity of the phase plate has on the quality of (broadband) ultrashort vortices. Characterizing ultrashort vortex pulses is another challenge: a few-cycle optical vortex is an inherently three-dimensional object in space and time and its complete characterization requires spatiotemporal characterization techniques.
In this work, we generate few-cycle optical vortex pulses from an ultrafast titanium:sapphire (Ti:Sapph) laser oscillator with a spiral phase plate and characterize them in the spatiotemporal domain using a technique based on spatially resolved Fourier transform spectrometry, which was developed independently in Lund and Saclay [Citation21–Citation23]. The technique is well suited for this particular case where high spatial resolution is needed, since scanning is performed only in one dimension (time), and because it allows for sub-cycle precision on the determination of relative phases across large areas.
2. Experimental set-up
The experimental set-up is schematically shown in Figure . Three main parts can be distinguished: (i) generation of the vortex pulses, (ii) spatiotemporal measurement, where the vortex pulses are characterized by interfering them with a spatially filtered reference and (iii) temporal characterization of the pulse entering the interferometer. The ultrafast oscillator (Venteon Pulse-one) used as laser source for the experiments has a repetition rate of 80 MHz and around 3 nJ of energy per pulse with a spectrum supporting 5.0 fs pulses. Chirped mirrors (Venteon DCM7) provide negative dispersion, and fused silica wedges are used for dispersion fine-tuning. A 1 mm thick spiral phase plate (RPC Photonics) with topological charge of one () at 800 nm, lithographically etched into a fused silica plate, is used in transmission to generate optical vortex pulses.
The spatiotemporal characterization is based on spatially resolved Fourier transform spectrometry [Citation21,Citation22]. Central in this approach is a dispersion-balanced Mach–Zehnder interferometer. Here, a cube beam splitter is used for splitting and a thin dielectric beam splitter for recombination. While the cube beam splitter has identical dispersion for both interferometer arms, an additional glass plate is inserted in one interferometer arm to compensate for the dispersion of the recombiner, which is different in transmission and reflection. A computer-controlled piezoelectric stage allows scanning the delay between the arms with sub-cycle precision. The vortex beam is generated in one arm and a spherically expanding reference wave is generated in the other arm by focusing with an off-axis parabolic mirror to a pinhole. The pinhole provides mild spatial filtering in the Fourier plane, removing large transverse wave numbers, originating from e.g. dust particles, and thus increasing the homogeneity of the reference wave, but not introducing measurable diffraction effects. After recombining collinearly with the vortex beam on the second beam splitter, the resulting interference pattern is recorded with a CCD camera at a distance of 50 cm from the interferometer, while one interferometer arm is scanned in delay in equidistant sub-cycle steps. Since the expanding reference beam is much larger than the original beam at the position of the camera, it can be assumed spatially homogeneous with good accuracy. Since only a very small angle segment of the spherical reference beam is used, effects originating from different path lengths in the second beam splitter or the wavelength dependence of diffraction are negligible.
When scanning the delay between the interferometer arms, an interferogram for each pixel of the camera chip is obtained, containing the spatially and spectrally resolved phase difference between the reference and the vortex beam. The known spherical curvature of the reference beam is subtracted numerically. From the interferogram, the spectral and temporal representation of the field to be measured, i.e. and
, can be obtained from basic Fourier operations provided that the phase of the reference field is known and the bandwidth of the reference covers that of the field to be measured [Citation21]. The characterization is performed at the plane of the camera chip. The field in any other plane, e.g. directly behind the spiral phase plate, can be obtained by numerical beam propagation methods from the plane of the camera chip to the plane of interest. The accuracy of the numerical propagation depends critically on the spatial sampling of the interference on the camera chip. More specifically, the spatial sampling determines the maximum transverse wave numbers that can be propagated and must be chosen sufficiently high to reproduce small features of the beam in any plane. The maximum transverse wave number supported by a given sampling can be estimated by
, where
is the pixel size of the camera chip or the size of several pixels that may be binned together in the data acquisition to reduce noise.
In our experimental approach, placing the spiral phase plate inside the interferometer allows us to avoid the generation of a homogeneous reference wave from a beam carrying OAM, which would be possible but more difficult. As a consequence, neither the vortex nor the reference field (inside and after the interferometer) are actually ultrashort pulses. They have picosecond duration as consequence of the dispersion of the thick beam splitter. This however does not compromise our method, which consists in measuring phase differences. The spectral phase of the reference pulse is equal to that of the pulse entering the interferometer, which can be characterized independently as described in the next paragraph [see Figure (iii)] plus the phase added by the beam splitter. Our measurement allows us to determine the spatially resolved spectral phase difference between the vortex pulse and the reference pulse. Since the thickness of the beam splitter is the same for the reflected and transmitted pulses, the same phase is added to both the reference and vortex pulses, and therefore cancels out in our measurement. The spectral phase of the few-cycle vortex pulse, which would be generated by the spiral phase plate without the additional dispersion of the interferometric set-up, can therefore be deduced. A more direct measurement would be to use a zero-dispersion interferometer, with, for example, pellicle beam splitters. This approach would however be more challenging due to mechanical and acoustical noise coupling to the pellicle and thus prone to errors. The pulse which would be observed directly behind the plate can be obtained by numerical back propagation from the position of the camera to the position of the plate (see also Figure ).
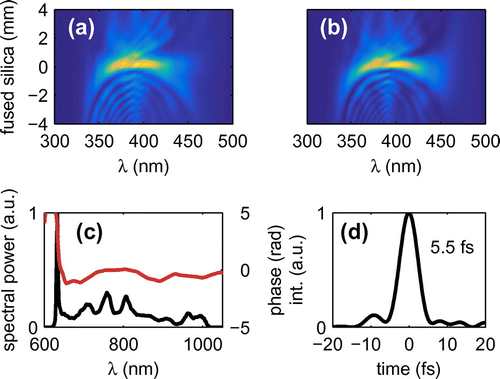
Figure 2. Temporal characterization of the reference beam. (a) Measured and (b) retrieved d-scan traces, (c) measured fundamental spectrum (black line) and retrieved phase (red line) and (d) reconstructed temporal profile at the reference glass insertion (zero amount of glass on the d-scan plots). The pulse duration (FWHM) at the reference insertion is 5.5 fs FWHM.
The optical pulse entering the interferometer is characterized by the d-scan technique [see Figure (iii)] [Citation24]. A small central portion of the beam is selected by an iris with about diameter (see Figure ). This portion of the beam contains sufficient power for second harmonic generation (SHG), while being small enough to be assumed spatially homogeneous. We furthermore assume that the characterized centre of the beam coincides spatially with the centre of the expanding reference wave generated in one interferometer arm. An off-axis parabolic mirror focuses the beam to a thin (
) KDP crystal and a broadband polarizer blocks the fundamental NIR light from entering the fibre that sends the SHG signal to a spectrometer. The SHG spectrum is recorded as function of glass insertion (dispersion) around the optimal compression insertion. From the measured SHG trace (Figure (a)) and the measured fundamental spectrum (Figure (c)), the spectral phase (Figure (c)) is retrieved using an iterative numeric algorithm [Citation25] that minimizes the difference between measured (Figure (a)) and retrieved (Figure (b)) traces. From the retrieved phase, the corresponding time domain pulse can be obtained at any glass insertion. The shortest pulses obtained have a FWHM duration of 5.5 fs (Figure (d)). In the following, the wedges are adjusted in such way that the shortest possible pulses are sent to the interferometric set-up.
The interferometric characterization set-up was first tested without the spiral phase plate. By characterizing the undistorted collimated beam, we can confirm that there is no measurable difference between the spectral phase of the central portion of the beam and the filtered reference, and that the reference beam is spherical and homogeneous.
3. Frequency-dependent spatial characterization
Figure 3. (a)–(c) Intensity and (d)–(f) phase profiles for three different wavelengths at the plane of the camera. The dimensions of each of the plots are 4 mm 4 mm.
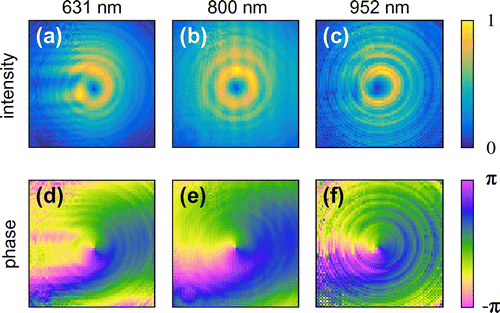
Our spatiotemporal characterization technique provides directly the Fourier transform of the time-dependent electromagnetic field U(x, y, t). Figure shows intensity
and phase
profiles at the position of the CCD detector for three different wavelengths, spanning the spectral bandwith of the pulse. For the design wavelength of the phase plate (800 nm) a clean vortex is obtained (Figure (b) and (e)), with the expected intensity pattern and helical spatial phase. The effect of the plate’s chromaticity, resulting in a break of circular symmetry of the intensity profile, increases as the wavelength departs from the nominal one (Figure (a),(c),(d) and (f)). The diffraction rings, which originate from the centre of the spiral phase plate, are observed for all wavelengths. At 631 nm (Figure (a)), strong diffraction effects on one side are noticeable. They originate from the fact that the phase jump introduced by the plate is not a multiple of
(it is equal to
at 631 nm). Figures (c,f) show the measured profile at 952 nm. At this wavelength, the phase jump is estimated to be around
, leading to less evident distortion on the intensity and phase profiles. We find that for any wavelength within the spectrum of the pulse, there is a phase singularity present in the centre of the beam with the intensity dropping to zero.
The effects originating from phase plates with non-integer phase jumps, i.e. not multiple of (see e.g. [Citation26,Citation27]), can be reproduced by simple propagation simulations. Figure shows an optical field, originally Gaussian, just after a spiral phase plate with a phase jump of
(Figure (a) and (d)) and after propagation to the position of the detector (Figure (b) and (e)). The simulated intensity and phase profiles (Figure (b) and (e)) qualitatively agree with the measured profiles at 631 nm (Figure (a) and (d)). The diffraction rings from the centre of the plate are qualitatively reproduced. The measured diffraction patterns deviate slightly from what would be expected from a perfect phase plate, suggesting imperfections in the centre of the plate due to manufacturing limitations.
Figure 4. Simulated intensity and phase profiles (a), (d) after the spiral phase plate and (b), (e) numerically propagated to the position of the detector. We assume a Gaussian beam and a phase step of due to the plate. (c), (f) Calculated intensity and phase profiles obtained by back-propagating the measured field (Figure (a) and (d)) to the plane of the plate. The dimensions of each of the plots are 4 mm
4 mm.
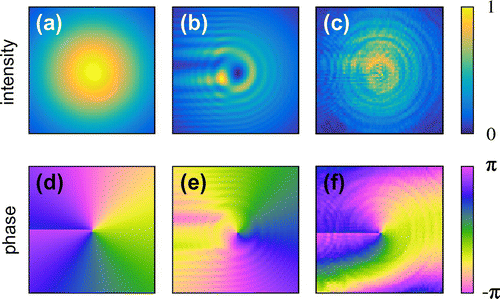
We also back-propagated the measured field (Figure (a) and (d)) to the plane containing the phase plate. The results are plotted in Figure (c) and (f), clearly showing a phase discontinuity of due to the thickness jump of the phase plate.
4. Temporal reconstruction
From the amplitude and phase measurements in the spectral domain the spatiotemporal field
can be obtained by simply Fourier transforming at each point in space.
Figure 5. Three-dimensional reconstruction of the vortex beam. (a) Intensity profile in space and time obtained by taking the square of the absolute field. The plot shows an isosurface set at half the peak intensity. The inset shows the same surface from a view along the propagation direction, visualizing the phase singularity (dimensions of inset plot are 4 mm 4 mm). (b) Isosurface set at 0 of the real part of the complex field. For clarity, only regions where the intensity is higher than 0.4 times the peak intensity are shown. (c) Isosurfaces of the real part of the field, set at 0.7 (red) and
0.7 (blue) of the peak field.
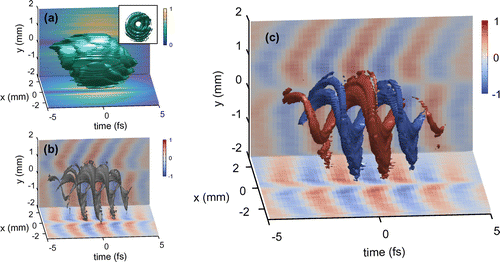
Figure (a) shows the spatiotemporal intensity profile as an isosurface set at half the peak intensity value. The projections on the vertical and horizontal planes in Figure are obtained by taking cuts through the centre of the beam. The time duration of the pulse taken at any individual point on the main ring is approximately the same as for the reference pulse, i.e.
5.5 fs. However, considering the vortex as a whole, the duration is by about one-cycle of the carrier frequency longer, i.e. around 8 fs. That result is not surprising since the phase jump of the plate delays part of the beam by one cycle (
fs).
To visualize the spiraling nature of the electric field in time we take the real part of the complex field, . Figure (b) shows isosurfaces of
set at a value of zero, which shows the wavefront of the spiraling field, while Figure (c) shows isosurfaces set at 0.7 and
0.7 of the peak field value. Note that the absolute phase of the electric field is arbitrary, since the carrier-to-envelope offset phase of the reference was not measured.
5. Conclusions
In conclusion, we have demonstrated the generation and complete characterization of ultrashort vortex pulses. The combination of the d-scan technique with spatially resolved Fourier transform spectrometry has proven to be a powerful technique for the characterization of ultrashort optical pulses with complex spatial distribution and spatiotemporal couplings, being especially suited for measurements requiring high spatial resolution with accurate phase sensitivity across the whole beam profile. The spiral phase plate, although not designed for broadband operation, has a good trade-off between performance and ease of use, since it is extremely simple to align, has low losses and is well suited for high-power applications. Despite the chromatic response of the spiral phase plate, the phase singularity in the centre of the beam remains intact.
Additional information
Funding
Notes
No potential conflict of interest was reported by the authors.
References
- Dennis, M.R.; O’Holleran, K.; Padgett, M.J. Progress in Optics. Vol. 53; Elsevier: Amsterderm, 2009; pp 293–363.
- Nye, J.F.; Berry, M.V.; Roy, P. Soc. Lond. A: Mat. 1974, 336, 165–190.
- Coullet, P.; Gil, L.; Rocca, F. Opt. Commun. 1989, 73, 403–408.
- Allen, L.; Beijersbergen, M.; Spreeuw, R.J.C.; Woerdman, J.P. Phys. Rev. A 1992, 45, 8185–8189.
- Yao, A.M.; Padgett, M.J. Adv. Opt. Photon. 2011, 3, 161–204.
- Swartzlander, G.A. Jr. Opt. Lett. 2001, 26, 497–499.
- Bretschneider, S.; Eggeling, C.; Hell, S.W. Phys. Rev. Lett. 2007, 98, 218103.
- Beijersbergen, M.; Coerwinkel, R.; Kristensen, M.; Woerdman, J.P. Opt. Commun. 1994, 112, 321–327.
- Bazhenov, V.; Soskin, M.; Vasnetsov, M. J. Mod. Opt. 1992, 39, 985–990.
- Bock, M.; Jahns, J.; Grunwald, R. Opt. Lett. 2012, 37, 3804–3806.
- Musigmann, M.; Jahns, J.; Bock, M.; Grunwald, R. Appl. Opt. 2014, 53, 7304–7311.
- Mariyenko, I.; Strohaber, J.; Uiterwaal, C. Opt. Express 2005, 13, 7599–7608.
- Yamane, K.; Toda, Y.; Morita, R. Opt. Express 2012, 20, 18986–18993.
- Bock, M.; Brunne, J.; Treffer, A.; K\"{o}ing, S.; Wallrabe, U.; Grunwald, R. Opt. Lett. 2013, 38, 3642–3645.
- Grunwald, R.; Elsaesser, T.; Bock, M. Sci. Rep. 2014, 4, 7148 (8 pages).
- Yamane, K.; Yang, Z.; Toda, Y.; Morita, R. New J. Phys. 2014, 16, 053020.
- Zürch, M.; Kern, C.; Hansinger, P.; Dreischuh, A.; Spielmann, Ch. Nat. Phys. 2012, 8, 743–746.
- Gariepy, G.; Leach, J.; Kim, K.T.; Hammond, T.J.; Frumker, E.; Boyd, R.W.; Corkum, P.B. Phys. Rev. Lett. 2014, 113, 153901.
- Moh, K.J.; Yuan, X.-C.; Tang, D.Y.; Cheong, W.C.; Zhang, L.S.; Low, D.K.Y.; Peng, X.; Niu, H.B.; Lin, Z.Y. Appl. Phys. Lett. 2006, 88, 091103.
- Atencia, J.; Collados, M.-V.; Quintanilla, M.; Mar{\’i}n-S{\’a}ez, J.; Sola, I.J. Opt. Express 2013, 21, 21056–21061.
- Miranda, M.; Kotur, M.; Rudawski, P.; Guo, C.; Harth, A.; L’Huillier, A.; Arnold, C.L. Opt. Lett. 2014, 39, 5142–5145.
- Gallet, V. Dispositifs Expérimentaux Pour la Caractérisation Spatio-temporelle de Chaines Laser Femtosecondes Haute-puissance. Ph.D. Thesis, Orsay University, 2014.
- Pariente, G.; Gallet, V.; Borot, A.; Gobert, O.; Quéré, F. Nat. Photon. 2016, 10, 547–553.
- Miranda, M.; Fordell, T.; Arnold, C.; L’Huillier, A.; Crespo, H. Opt. Express 2012, 20, 688–697.
- Miranda, M.; Arnold, C.L.; Fordell, T.; Silva, F.; Alonso, B.; Weigand, R.; L’Huillier, A.; Crespo, H. Opt. Express 2012, 20, 18732–18743.
- Berry, M.V. J. Opt. A: Pure Appl. Opt. 2004, 6, 259–268.
- Leach, J.; Yao, E.; Padgett, M.J. New J. Phys. 2004, 6, 71 (8 pages).