
ABSTRACT
Despite girls enjoying and being good at physics, the proportion of girls studying physics and going into physics related careers still lags behind that of boys. A large volume of research exists on the factors related to the uptake of girls into physics, however little research looks at the link between parents and their child’s physics uptake. Research shows that children’s attitudes towards physics correlate strongly with their parents’ attitudes, but more research is needed. The evidence presented here moves the research forward by modelling a number of parental attitudes and background characteristics to establish the strength of association with their child participating in physics in the future. It also develops validated scales for use with parents and suggestions for interventions to establish causality. 2,049 parents and carers of 13/14 year old children in England completed the survey. The findings indicate that parents who enjoyed physics, consider physics useful for getting a job and judge their child as academic, have the strongest associations with their child’s future participation in physics. Other key variables include the parent valuing physics, the parent attending school outside of the UK, the child being a boy and parents judging daughters as courageous and/or determined.
Introduction and rationale
Despite girls being good at physics, the proportion of girls studying physics and going into physics-related careers still lags behind that of boys (IOP, Citation2018; Ma, Citation2011; Riegle-Crumb et al., Citation2006). Evidence from Freeman (Citation2004), IOP (Citation2018) and Nord et al. (Citation2011) shows the gender gap has remained a problem for over 35 years. Figures from 2016 (IOP, Citation2018) show girls perform just as well as boys in physics at GCSE, but only 1.9% progress to study physics A-level (the academic qualifications studied at post-16 in England, Wales and Northern Ireland), compared to 6.5% of boys. As stated in IOP (Citation2018) Generations of innovative, talented and brilliant girls are being led to believe they can’t be engineers, scientists, programmers or technicians. As well as addressing this social inequality, enabling more girls to take up physics A-level would help tackle the skills gap in the UK and much of the developed world, increasing economic, technical and intellectual progress (e.g. Gorard & See, Citation2008; IOP, Citation2018). The gender gap exists despite the large volume of research published on the factors related to the uptake of girls into physics. However, very little research exists on the link between parents’ attitudes and their child’s physics uptake, an area that shows promise and needs further research (Archer et al., Citation2012). We begin this paper by summarising the literature on factors associated with the uptake of girls into physics, followed by a focus on parent and carer attitudes and aspirations with their child’s uptake of physics. The research presented here moves forward our understanding of parental involvement in the physics gender gap, through the development and validation of a survey that explores in greater depth the strength of the relationship between various aspects of the parents’ attitudes and beliefs. Both how they are linked with their child’s future participation in physics and how ‘thinkable’ it is for their child to study physics, i.e. whether they can picture their child in physics.
Background literature
Factors associated with the participation of girls in physics
There are numerous studies exploring the factors associated with girls’ participation in physics, as illustrated by the extensive literature review in Murphy and Whitelegg (Citation2006). The authors found evidence of multiple factors related to girls’ participation in physics. Participation was found to be related to career aspiration, interest and enjoyment in physics, views of the relevance of physics, the impact of teachers, being in a single-sex school, achievement and self-concept, perceptions of the difficulty of physics and assessment processes.
Mujtaba and Reiss (Citation2013a) investigated which specific aspects of classroom practice were linked to future participation in physics. The strongest item linking perceptions of teachers with an intended participation in physics was ‘teachers’ encouragement of individual students to continue with physics after the age of 16’ and that girls were less likely to receive this encouragement. They also found that girls had fewer positive experiences of physics lessons and physics education compared to boys. Furthermore, even stronger associations with future participation in physics were linked to the concept of ‘extrinsic material gain’. In particular, the thought that physics will help the students get the job they want in the future, physics being considered interesting, and physics being considered valuable. Mujtaba and Reiss (Citation2013b) go on to show girls’ future participation in physics is also linked to being competitive and tending to be less introvert.
Gorard and See (Citation2008) link attainment and socio-economic background to participation in science post-16. They argue that because socio-economic status is linked to attainment, the participation in science by those in lower socio-economic groups are lower as prior attainment in science is often used to determine future participation. The authors suggest that prior attainment should not be used to determine future participation as entering higher education and becoming a scientist need not be the only reason to study science.
Several studies suggest that students’ interest in science varies over time and is, in general, higher at the age of 10/11 with little difference between the genders but their interest drops year on year, with girls’ interest dropping faster than boys’ (e.g. Barmby et al., Citation2008; Murphy & Beggs, Citation2005). There is also evidence that children’s interest in science is formed by the age of 14 and that career aspirations in science at this age are strongly associated with university science uptake (e.g. Lindahl, Citation2007; Tai et al., Citation2006).
DeWitt et al. (Citation2014) found most students in their sample of young people aged 12–13 years enjoyed school science and had positive views of scientists. However, these attitudes did not translate to an interest in science careers. They suggest there is a mismatch between the students’ own identities and how they view scientists, and this prevents participation in science careers (see also DeWitt et al., Citation2013; Markus & Nurius, Citation1986). DeWitt et al. (Citation2014) highlight the importance of working with schools and families to help broaden the image of science and science careers so that young people can identify with it. They also suggest the importance of emphasising the value of continuing science as it opens doors to non-science careers. DeWitt and Archer (Citation2015) describe aspirations as a proxy that science is ‘thinkable’ for a student (Archer et al., Citation2010). They also link aspirations to future choices and participation (see also Atherton et al., Citation2009; Tai et al., Citation2006). DeWitt and Archer (Citation2015) discuss how aspirations are relatively stable over time and are shaped by social identities and inequalities, parental and family factors as well as the young person’s experiences of school science. High aspirations were strongly associated with males, those families from some ethnic minority backgrounds (Asian, black and other), with high levels of cultural capital. However, the strongest association with aspiration were linked to the young person’s attitude towards school science and the attitudes of their parents. These links are complex in that positive attitudes towards school science and positive parental attitudes do not always translate into science aspirations. DeWitt and Archer (Citation2015) suggest ‘science capital’ (for example parents with post-compulsory education science qualifications and careers in STEM) may also be important and explain the lack of direct translation. Such an environment may mean science is part of their child’s everyday life at home.
Research suggests young people’s views of scientists do not match their own views of themselves (particularly for girls). Losh (Citation2010) highlights research that shows both adults and students see scientists as lonely, ‘socially inept, workaholic males’. Newton and Newton (Citation1992, Citation1998) demonstrate similar results in children’s stereotypical views of scientists as balding and bespectacled men working alone in laboratories. Harvard Crimson (Citation2005) and Terzian and Grunzke (Citation2007) suggest girls are not choosing science careers due to the lonely workaholic stereotype. Helford (Citation2000) and Losh (Citation2010) suggest the media portray female scientists as ‘superwomen’. Francis et al. (Citation2017) show that physics is perceived as ‘quintessentially masculine’ and ‘hard’. Whilst Archer et al. (Citation2013) argue that many girls think of themselves as ‘girly’, ‘normal’,’ caring’ and ‘active’ and that this does match their perception of physicists being ‘clever/brainy’, ‘not nurturing’ and ‘geeky’. It is therefore not surprising that Archer et al. (Citation2017) suggest that girls need to be ‘exceptional’ to overcome these barriers to visualising themselves in physics. Furthermore, stereotypical views may be implicit, with the international work of Nosek et al. (Citation2009) demonstrating that higher levels of implicit stereotyping around gender and science in the adult population can adversely affect science achievement in a nation’s young people.
DeWitt et al. (Citation2019) found that those who consider physics as difficult and masculine may not conclude that physics is for them, regardless of gender. Archer et al. (Citation2012, p. 904) state that more needs to be done within STEM participation policies to make science a ‘thinkable’ career option for all. Archer et al. (Citation2012) suggest increasing children’s and parents’ knowledge of the wide variety of science careers and they also agree with Adamuti-Trache and Andres (Citation2008) and Lyons and Quinn (Citation2010) that science education needs to do more to highlight value of science qualifications for future employment.
Parent associations
There is a strong, but complex link between families (including parents) and their child’s engagement, aspirations and attainment in science, but studies in this area are limited (e.g. Archer et al., Citation2012; Aschbacher et al., Citation2010).
Parents and carers have been linked to the gender gap in STEM participation (e.g. Archer et al., Citation2012; Tenenbaum & Leaper, Citation2003). Tenenbaum and Leaper (Citation2003) demonstrated that parents were more likely to believe science is less interesting and more difficult for their daughters than for their sons and their beliefs about their child were significantly associated with their child’s interest and self-efficacy in science. Andre et al. (Citation1999) also found that parents perceived boys as more competent in science, and, as well as having higher expectations for boys, they considered science a more important subject for boys. Jacobs et al. (Citation2006), show that parents’ gendered attitudes towards occupation expectations when their child is 15 are associated with their child’s own aspirations at 17. Furthermore, the parental career expectations for their child at 17 were found to be related to the actual job the child had at 28. The same authors also found that women in gender non-traditional jobs, such engineering or construction work, had higher levels of job satisfaction compared to any other group. This highlights the importance of educating parents about the importance of gender non-traditional jobs and the importance parental expectations play (Jacobs et al., Citation2006).
Jacobs (Citation1991) identified a link between parents’ gendered views and their child’s self-concept and performance in maths, but showed it was more complex than a direct link. Gendered stereotypes influence the parents’ beliefs about their child and the beliefs influence the child’s self-perceptions which in turn influence the child’s performance. Similarly, in Finland, Räty and Kärkkäinen (Citation2011) found that the parent’s views are related to their views of their child’s own competence in mathematics (a similarly male-dominated subject to physics). Parents believe mathematics is easier for boys than girls, but interestingly when the parents’ views changed over time to anti-stereotypical views, they viewed girls as having greater maths competency than boys.
Breakwell and Robertson (Citation2001) looked at attitudes towards science over time in the UK. Girls were found to like science less and this did not change over the 10 years they examined students of the same age. However, there was evidence that mothers’ support for science in the more recent data has increased and is positively linked with their child’s attitudes and involvement is science.
Parent expectations may also be related to ethnicity, with Asian American parents, for example, having particularly high expectations for their child’s science education (Aschbacher et al., Citation2010; Gilmartin et al., Citation2006). Socio-economic differences are another factor linked to STEM participation (Archer et al., Citation2012; Aschbacher et al., Citation2010; Royal Society, Citation2006; Tai et al., Citation2006). Aschbacher et al. (Citation2010) link high achievement in science with affluent families with strong scientific social capital. Archer et al. (Citation2012) build on this research by demonstrating that when socio-economic, cultural and ethnic beliefs are in alignment, science is a ‘natural’ choice, i.e. those who are middle class, have an ethnic background that values science and have social and science capital are more likely to consider science.
Parental background, attitudes, beliefs and expectations influence their child’s attitude towards physics and science more broadly; whether they like physics, their performance in physics and their ability to see physics as being for them. When these attitudes are negative about girls’ competencies or belonging in any field of science, the research suggests that daughters are more likely to avoid science, and by extension, physics, participation in the future. However, as previously stated, research focussed specifically on physics, with a large dataset and in the English context is very limited. This research aims to address this issue.
Introduction to the survey
The Parent and Carer survey (PAC) in England was set up by the Professional Practice Group at the Institute of Physics (IOP) in August 2019 as part of the Improving Gender Balance (IGB) randomised control trial which ran from April 2019 until March 2021. The over-arching aim of the IGB research trial was to test the efficacy of interventions focusing on stereotypes, bias, physics teaching and careers to increase the proportion of girls progressing to A-level physics in intervention schools. This work built on a previous IOP pilot project between 2014 and 2017 which successfully tripled the number of girls choosing A-level physics in Partner Schools (IOP, Citation2017, p. 25). The IGB research trial was designed as a randomised control trial, in order to provide causal evidence on the link between bespoke whole school stereotype and bias mitigation strategies alongside physics-specific teaching support with the uptake of physics at A-level. Secondary schools in England were identified, then invited by letter, to participate in the IGB research trial. Participating schools were randomised to control (business as usual) or intervention (IOP support) groups. The intervention schools received bespoke support by an IOP Coach to explore and tackle the causes of gender imbalances that exist in physics in their school from January 2020 until March 2021. Interventions involved working across the whole school, including those teachers of the (2019–20) year 9 students whose parents and carers are discussed in this study. It is worth noting that the schools in the IGB research trial are not a representative sample of all schools; so, whilst these results are informative and revealing, it is not necessarily the case that they would be repeated nationally. All year 9 parents in the IGB research trial, in both intervention and control schools, were invited to fill in the survey.
Method
This article presents the views of parents and carers through the development and analysis of the survey. The survey was developed based on the background literature above and aimed to answer the specific research questions presented in the next paragraph. Survey questions were developed using previously validated scales where possible, with the addition of some new items.
Research questions
This survey aims to answer the following research questions:
What is the relationship between parents’ attitudes and their child’s likelihood of taking A-level physics?
What is the relationship between parents’ attitudes and the parent/carer being able to picture their child in a physics career/studying physics in the future?
Do the relationships in RQs 1 and 2 differ with the gender of the child?
Sample
The English secondary schools invited for the IGB research trial were all co-educational or single-sex (girls only) state (non-special schools), that had not recently participated in any previous IOP gender-focussed project. Single-sex boys’ schools were not invited as the focus of the project is to improve the proportion of girls choosing to take physics A-level. All parents and carers of Year 9 students at schools in the IGB research trial, both intervention and control, were invited to fill in the Parent and Carer Survey. The survey was shared by the schools in either paper form or electronically (via a website, newsletter, text message) – whichever the school felt was most appropriate. Data collection occurred between November and December 2019.
Development of scales/survey items: choice and operationalisation.
Dependent/Outcome variables
Participation in physics could not be used as all students take science, including physics at this stage in their schooling, we therefore need to develop variables to predict future participation on physics. The planned outcome measure was a 10-point scale measuring the parent’s views of how likely their child was to take A-level physics. Additionally, an independent variable was created from three Likert-style items to measure how much a parent could picture their child in physics. Initial analysis and theoretical consideration of the two measures, showed the scale picture child in physics to be very similar to likelihood of studying A-level physics (with ‘picture child in physics’ explaining over 50% of the variance in likelihood of taking A-level physics). The decision was therefore made to use ‘picture child in physics’ as an outcome variable. Factor analysis confirmed that both sub-factors loaded on the same factor, however, the factors were different enough that it did not make statistical sense to combine them into one scale. The decision was made to keep the variables as two separate outcome measures that measure slightly varying aspects of future participation in physics (e.g. Field, Citation2009). The advantage of having two separate, but related outcome variables is if the results are similar for both it increases the validity of the findings. The following variables were collected to measure parent/carer attitudes and judgements about the child. All Likert-style items are on a five-point scales from strongly disagree to strongly agree.
What is the likelihood of your child taking A-level physics? (New item, 10-point scale from extremely unlikely to extremely likely).
Parent picturing their child in physics (new scale, 3 Likert-style items (see ), adapted from ‘Future participation in science’, Kind et al., Citation2007).
Table 1. Factor analysis results for attitudinal items and Cronbach’s Alpha for resulting scales.
Independent variables (parent/carer attitudes and judgements about child)
The section in the literature above lists the factors associated with participation in physics and our independent variables are therefore directly based on this. Many of the scales and items have already been validated and demonstrate good validity. However, we will validate them again for the new context of working with parents. To improve the content validity, we have added new items to match any key factors listed in the literature that are not included in existing surveys. The items and scales are listed below and see for exact wording:
The usefulness of physics for a job (new Likert-style item)
The parent/carer’s confidence in advising their child about physics as a subject choice for their next stage in education (new Likert-style item)
Valuing physics (new scale, 4 Likert-style items, adapted from the scale importance science, Kind et al., Citation2007)
Physics stereotypes (8-point validated scale, images of scientists, from DeWitt et al., Citation2011)
Gender stereotypes in physics (adapted from equality subscale from Women in Science Scale, Erb & Smith, Citation1984; Owen et al., Citation2007)
Parent’s enjoyment of physics (new scale, adapted from learning science at school, Kind et al., Citation2007)
The child’s career plans (new item open response – careers that would suit their child)
Characteristics that match their child (new item adapted from Archer et al., Citation2013; Gaucher et al., Citation2011)
Independent variables (background variables)
Gender of child (dichotomous item)
Child’s school (open response)
Gender of parent (dichotomous item)
Parent having worked in STEM (dichotomous item)
Parent attended school in the UK (dichotomous item)
Parent went to university (dichotomous item)
Cultural capital (5-point scale measuring the number of books in the home, adapted from Sieben & Lechner, Citation2019)
Development of scales using factor analysis and Cronbach’s Alpha
The survey was developed with five theoretical factors/scales of attitude detailed in the section above (valuing physics, physics stereotypes, gender stereotypes in physics and parents’ enjoyment of physics). As mentioned above, these scales have been previously validated but have been adapted for use in a new setting (i.e. with parents). We therefore present details of how we validated these scales for this project and present evidence for construct validity, including results of Exploratory Factor Analysis (EFA), demonstration of convergent and divergent validity, tests for internal reliability and male/female invariance. presents the results of exploratory factor analysis using Varimax rotation (see for example Field (Citation2009, pp. 627–685). We can see from that factor analysis revealed five clear factors, as expected. We next demonstrate convergent and discriminant validity, which is described by Campbell and Fiske (Citation1959) and is demonstrated if the items in the scale are highly correlated, typically with factor loadings of above 0.5 (Hair et al., Citation1998) compared to measures of other traits. This is clearly demonstrated for our factors in . To demonstrate reliability, Cronbach’s Alpha is used as a measure of internal consistency, for which various benchmarks have been cited. These from 0.7 to above 0.9 (e.g. Tavakol & Dennick, Citation2011). shows the alphas are between 0.7 and 0.9 for all five scales, which is ideal for scales of this length (between 3 and 7 items) as greater than 0.9 would indicate redundancy but above 0.7 indicates good internal consistency (Tavakol & Dennick, Citation2011). The scales were tested for male and female invariance (key characteristics in our research) by repeating the EFA separately for males and females. The factors were identical for each group, demonstrating male and female invariance.
Table 2. Demonstration of convergent and divergent validity in our scales.
The first factor is a three-item scale measuring the extent to which the parent can picture their child in physics (with my child would struggle in physics reversed). Similarly, three items form a scale measuring the parent’s enjoyment of physics (with the negatively worded item reversed) and three items form a scale measuring any parent gender stereotypes concerning physics. The fourth factor and fifth factors were slightly different to what was expected. The positively worded items for the physics stereotype scale did not fit the scale and a better fit was found in the ‘valuing physics’ scale (e.g. people who use physics have to be creative in their work and are brainy). Factor four forms a seven-item valuing physics scale and factor five, a four-item physics stereotype scale.
Analysis and results
We begin the analysis by presenting background statistics from our sample. We also present analysis to ascertain whether the sample is different to the national sample in order to determine the generalisability of the findings and the likelihood of any bias due sample/nation population differences. Multiple regression analysis is used to model the relationship with the independent variables and the outcome variables to directly answer the research questions. The models are repeated for each outcome variable in turn. The analysis will be re-run, where sample sizes allow, to compare the results for girls and boys. As the main sample includes single-sex girls’ schools but no single sex boys’ schools, a co-education-only sample is also used in the analysis to make fair comparisons between boys and girls. To deal with the difficulties in interpreting results for dichotomous items, scales and Likert-style items together, the models are re-run treating all variables as dichotomous. This enables direct comparisons between the size of the coefficients of the independent variables and their strength of association with the outcome variables. For items that are scales, the sample mean was used to form a dichotomous variable (i.e. above the mean are ‘0’ and equal/below the mean are ‘1’ and for the Likert-style items the cut off was used that best split the sample into equal groups.
Background statistics from the sample and comparisons to national population
Description of the sample
There were 2,049 parents and carers, from 60 schools, that chose to take part in the study. Between one and 67 parents responded from each school. To interpret our results and comment on their generalisability to other populations, we need to investigate the nature of our sample of respondents. We can do this by comparing our sample of parents to other parents in England (which is not possible, as we do not have data on all parents in England). However, we can compare the nature of the schools in our sample compared to the rest of non-special state schools in England, giving us an indication of whether bias exists. We have general information on the schools in our sample and the rest of state schools in England from school league tablesFootnote1. Key school level variables for the schools in our sample are presented in along with data from the rest of the schools not in our sample. Single-sex schools have been removed from both samples as there are no boys’ schools in our sample. This meant removing 3 schools, leaving a total of 57 schools in the sample data. Data from a ‘matched’ sample is also presented in . The four key variables selected are the mean Attainment 8 score (a measure of attainment for pupils at the end of compulsory education at age 16 in England), the proportion of students from deprived backgrounds (as measured by proportion of students in each school who are eligible for free school meals), and the proportion of girls and proportion of selective schools (schools which select students based on higher academic ability at the age of 11) in the sample. Comparing just the sample and the rest of the country, the sample has higher mean attainment, with a mean attainment 8 score over 5 points higher than that of the rest of England. The proportion of students eligible for free school meals differs too, with a mean of 17% in the sample compared to 28% in the rest of England. The proportion of girls is in both samples is very similar, having taken away the single-sex girls’ schools, with 48% compared to 49%. There is also a higher proportion of selective schools in our sample (by a factor of ten) compared to the rest of England. The sample in this study is therefore biased towards higher attaining, more selective and less deprived schools.
Table 3. Description of co-ed schools in the sample, compared to all state, co-ed (non-special) schools in England with the addition of a broadly representative sample.
As our sample is biased (towards higher achievement and higher socio-economic backgrounds), we need to provide evidence as to whether the sample will give different results compared to the general population. To do this, a sample has been created that broadly matches the population on the means we can measure, making it more likely to be representative. Rather than sophisticated methods of matching or weighting (which cannot be used here, as the unit of analysis is the parent and there are varying responses from each school), a reduction method has been used at school level, which involved reducing schools until the sample means match the population means for the school level variables. Schools were removed from the sample, beginning with those with the smallest proportion of free school meals, until the means more accurately matched those of the population, without reducing the sample size too much for the multiple regression analysis.
Secondly, to match the population sample one selective school was randomly selected to stay in the sample and 6 parents were randomly selected to stay in the sample. The resulting sample is therefore broadly representative of the rest of the population, not in exact terms, but likely to be a lot closer than the full co-education sample we have. If the result of our main analysis is broadly similar to the results of our ‘matched’ sample, then we have some evidence that our findings do not differ for the whole population of England. As mentioned above, also presents the means of this ‘matched’ sample, and it is now evident that the means are a much closer match to rest of England.
Evidence on the nature of the sample can be found by looking at descriptive statistics of the background variables in our survey and by comparing our full sample of 2,049 parents to our co-education-only sample of 1,947 parents and our matched sample of 425 parents. The results are presented in .
Table 4. Proportions of parent-level background variables, split by the full sample, co-education sample and the matched sample.
There are far more female respondents amongst the parents/carers in all three samples. However, the split of the gender of the children is much more equal in the two samples where the single-sex girls’ schools have been removed. This shows that sample is not particularly biased in terms of the gender make-up of the children. There are more parents/carers who have not worked in STEM compared to those who have, and this is consistent across the different samples. The sample has more parents who have attended university compared those who have not in the full and co-educational-only sample, but this changes for the matched sample, where more parents/carers have not attended university. The majority of respondents in all our samples have multiple bookshelves in the home. Around 12% of parents attended school outside of the UK and this percentage reduces to 9% for the matched sample. As only the parents in the sample completed the surveys, it is difficult to know if these survey responses are representative of the general population of Year 9 parents in England. Data from Mayhew et al. (Citation2004) show the participation in university between 1994 and 2000 (a likely time period for parents’ of 14/15 year-old children) was around 32% or 33%, leading us to suspect that this sample is biased towards parents that went to university. However, the matched sample is a lot closer to this figure than the other samples. It is likely other variables will be biased too. When just looking at those in the sample whose children attend co-educational schools, the proportion attending university drops slightly, bring it closer to the national average.
Descriptive statistics from the survey results
This section presents descriptive statistics from the survey. presents the means of the Likert-style items and the scales, split by the three samples explored above, i.e. the full sample, the sample with single-sex schools removed and the ‘matched’ sample.
Table 5. Summary of descriptive statistics for the Likert-style items and scales in the survey, split by the three samples (1 = strongly disagree to 5 = strongly agree).
Comparison of results of variables in , show they only vary by a maximum of one decimal point between our three samples, showing that by removing the schools that biased our sample the results do not change. There is stability in our findings. This gives us greater confidence that these findings will be broadly similar to the whole population.
When looking at the individual items and scales, a mean of 3.0 indicates the parents neither agree nor disagree with the scale/item, i.e. they are neutral. In terms of the results, we can see that parents in all groups responded most positively to the two Likert-style items asking about how useful they think physics is for finding a job and how confident they are in giving subject advice for the next stage in their child’s education. The positive response about subject advice may be due to most children having to take science subjects at 16 years of age, so the amount of choice and therefore advice required is limited. Out of the four scales, ‘valuing physics’ scores highest. Parents in general have a favourable attitude towards physics in terms of its usefulness and value. With a mean between 2.9 and 3.0, in general parents are neutral about their enjoyment of physics. There are some who enjoyed physics and some who did not. This is true for all samples, but the result may decrease further with a more representative sample. The two scales looking at physics and gender stereotypes have means below the average value of 3.0. This means on the whole parents do not agree with stereotypes. However, with means of 2.3 and 2.5 there are still plenty of parents who hold to these stereotypes. We will look at how these variables relate to the outcome variables when we put them into our regression models further on in the analysis.
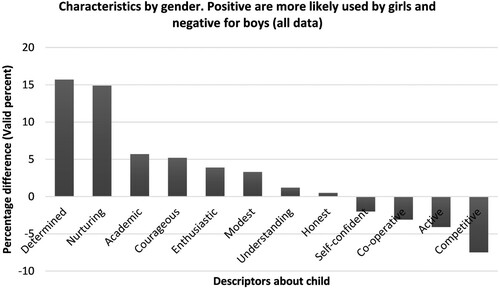
Our final descriptive statistics are shown in . Parents and carers were asked to describe their child by choosing 2-5 characteristics from a list. presents the difference between the percentage of girls being assigned a particular characteristic by their parent and the percentage of boys being assigned the characteristic. Any percentages above zero mean the characteristic is more likely to be assigned to girls. Where negative, it is more likely to be assigned to boys. We can see the strongest gender differences, in preference for the girls, were to describe them as determined and nurturing, with academic, courageous, enthusiastic, modest and understanding also being more likely to be assigned to the girls. Being honest is broadly equal for both sexes. Being described as competitive is the strongest gender difference in favour of the boys, with active, co-operative and self-confident also being more likely to be assigned to boys. These results show there are clear differences, based on gender, in how the parents describe their child’s characteristics. Whether or not these characteristics or any of the variables presented above are related to whether children choose A-level physics will be explored in the next section.
Figure 1. The percentage difference (between boys and girls) in the proportion of pupils being described by each characteristic by their parents.
Results of multiple regression models
The aim of the multiple regression analysis was to investigate which variables had a statistically significant relationship with the outcome variables and to investigate the strength of any relationships. Several methods were used to do this, including manually building models, ‘forwards selection’, ‘stepwise selection’ and ‘backwards deletion method’ Chowdhury and Turin (Citation2020). All methods indicated the same key variables as being significant, so for the interest of parsimony, backward deletion results are presented here. This method puts all variables into the model and each one is deleted one at a time until all variables left have a statistically significant (p < 0.1) relationship with the outcome variable. The strength of the relationship of each variable in the model is represented by the size of the coefficient. A coefficient of 1 means the variable is associated with a change in one unit in the outcome variable. For the likelihood of taking A-level physics, this means one point up on the 10-point scale and for the picturing child in physics scale, going from one point on the Likert scale to the next. The models were tested for issues such as multicollinearity and lack of normality in the outcome variable residuals and all passed showing we have good models.
The results of the multiple regression analysis are presented in for the outcome variable likelihood of taking A-level physics and in for the outcome variable picturing your child in physics. In order to make comparisons between variables, the coefficients presented are where all variables entered in the model are dichotomous. The tables show the results split by four samples (all data, all girls from co-education sample and all boys from the co-education sample and the matched sample). and present the coefficients from the full sample as a bar chart, with confidence intervals (p < 0.05).
Figure 2. Chart showing the coefficients for all significant (p < 0.10) independent variables, with 95% confidence intervals (outcome: Likelihood of taking A-level physics).
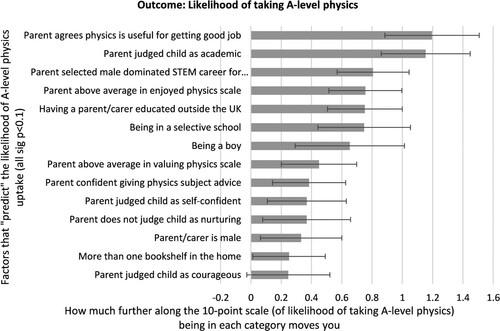
Figure 3. Chart showing the coefficients for all significant (p < 0.10) independent variables, with 95% confidence intervals (outcome: Picturing child in physics scale).
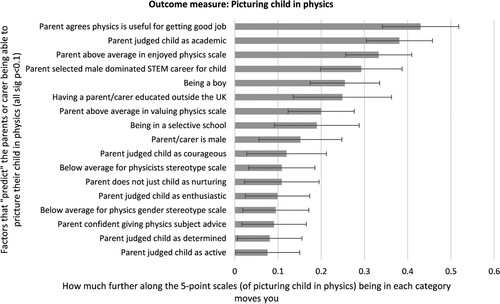
Table 6. Multiple regression results of models with all independent variables as dichotomous variables and ‘Likelihood of taking A-level physics’ as outcome variable.
Table 7. Multiple regression results of models with all independent variables as dichotomous variables and ‘Picturing child in physics’ as outcome variable.
The first thing to note in and , by looking at the R-squared results (the proportion of the outcomes variable explained by the independent variables) are that the models explain a large amount of the variance in the outcome variable. The full sample, using the full variables explains just under 40% of the variance in a parent being able to picture their child in physics. In fact, all samples and outcome variables have between 24% and 39% explaining by the independent variables.
The best way to interpret these charts is to look at the overall patterns in the data for all samples and both outcome variables. The two outcome variables are two ways of measuring how likely it is that the child will go on to take physics. If they are both showing similar results, we can be more confident in our findings. Similarly, if we find similar results across our samples, we can be more confident in the generalisability of our findings.
Looking at and , the reason the full sample for both outcome variables has more independent variables in the model compared to the other models is likely to be due to the size of the sample. Looking at all samples, the three variables that all models have in common for having the strongest association with both outcome variables are:
Physics being useful
Judging their child as academic
Parent/carer enjoyed physics
Other key variables that are common to most models are:
Valuing physics
Being judged by parents as being interested in male dominated STEM job
Being a boy
Having a parent who was educated outside of the UK
Being in a selective school
In terms of characteristics, not being described as nurturing is a key variable, especially for girls. Other characteristics that are statistically significant in a number of models are ‘courageous’, ‘self-confident’, ‘determined’ and ‘not active’. The variables that were consistently not associated with the outcome variables were ‘parent having attended university’, ‘having or having had a career in STEM and the characteristics ‘modest’, ‘honest’, ‘understanding’ and ‘co-operative’.
When comparing the results for girls and boys, they have a lot of key variables in common when explaining outcome variables, such as ‘being described as academic’, the parent judging physics as ‘useful for getting a job’ and the parent having ‘enjoyed physics’ themselves. The interesting difference comes with the characteristics. Girls who are not described as ‘nurturing’, that is, to show characteristics relating to the care, protection and feeding of something or someone, are more likely to be linked to physics in the future. However, the characteristic is not significant for boys. The characteristics of ‘courageous’ and ‘determined’ are related to the child taking physics in the future, but again not for boys. These results clearly demonstrate that parental attitudes vary according to the gender of the child. Results are summarised in the next section, along with how they fit in with previous literature and the implications on our understanding of the importance of parental attitude and background on the potential participation of young people in physics.
Discussion and summary
The findings show that we can explain up to 40% of the variance in a parent believing their child will go on to study physics at A-level or for their parent to be able to picture their child in physics in the future. This highlights the importance of a parent’s attitude around physics and gender and the potential subject-choice outcomes for their child. We do not know if the relationship between parental attitudes and student outcomes is causal, however this gives us confidence that this is an important area to investigate further. If the parent’s attitudes can be modified and there is a causal link, then it is perhaps possible that targeted interventions, for example guidance around job opportunities from physics, that their children will have a greater likelihood of choosing physics in the future. This should be a key focus of future research.
The first two research questions ask which parent attitudes are related to the ‘likelihood of taking A-level physics and parents being able to ‘picture their child in physics’. The strongest relationships (for both outcome variables) were the positive relationship with whether the parent enjoyed physics, whether they judged their child to be academic and whether they considered physics useful for getting a job. Other key variables include, valuing physics, being judged by parents as being interested in male-dominated STEM job, being a boy, having a parent who was educated outside of the UK and being in a selective school. The factors are similar for all samples and both outcome variables. These findings (in particular, physics being useful for a job, physics being enjoyable, and child being interested in a male-dominated STEM career) are similar to findings of Mujtaba and Reiss (Citation2013a, Citation2013b) who found students’ likelihood of future participation in physics were strongly associated with extrinsic motivational gain, i.e. whether physics is useful for your future job and physics being interesting as a subject.
Research question three compares how parents and carers view their children. The key differences are that the characteristics of not being nurturing and being courageous and determined are statistically significant for girls and not for boys. This gives evidence that, in general, girls who take physics are more likely to be perceived as tough in character and not have nurturing as a key characteristic in describing them. These findings are similar to findings from Archer et al. (Citation2013) and DeWitt et al. (Citation2013) that physicists are perceived as ‘clever/brainy’, ‘not nurturing’, ‘geeky’ and ‘specialists’. These stereotypes exist but could be challenged when considering the nurturing skills in many physics’ jobs, including medical physics, physics teaching and any job that involves line managing an individual or team. Characteristics of ‘courageous’ and ‘determined’ match the Archer et al. (Citation2017) idea that girls need to be ‘exceptional’ in order to overcome these barriers to visualising themselves in physics.
Some of the factors associated with the outcome variables cannot be changed, such as where the parent went to school, the gender of the child and the deprivation index for the school. However, some variables could be manipulated in an intervention to establish causality. Firstly, potential interventions with parents could include highlighting aspects of physics that they enjoy and how it is useful it is as a subject in terms of job opportunities. Secondly, sessions with parents looking at the reality, and challenging any stereotypes, of how academic those who work or study physics are. In particular how this relates to their view of how academic their child is in order to widen the view that ‘physics is for them’. Thirdly, work on broadening the careers options in physics, so for example parents realise there are options out there that match non-stereotypical perceptions of physicists, such as physics jobs that demonstrate ‘nurturing’ characteristics – this would perhaps diversify participation in post-16 physics further. Finally, we need to consider how generalisable these results are. The sample is biased towards schools with higher exam results and lower deprivation. However, we created a broadly matched sample on those variables we could measure. The results were similar, with the same key variables being important in all the models. This gives us some confidence over the stability of these findings and the fact that they are likely to apply to other settings, especially secondary schools in England.
Disclosure statement
No potential conflict of interest was reported by the author(s).
Correction Statement
This article has been republished with minor changes. These changes do not impact the academic content of the article.
Additional information
Funding
Notes
1 Data was downloaded from 2018/19 school league tables, removing independent schools, single sex schools and special schools [Accessed May 2020 from: https://www.compare-school-performance.service.gov.uk/download-data ]
References
- Adamuti-Trache, M., & Andres, L. (2008). Embarking on and persisting in scientific fields of study: Cultural capital, gender, and curriculum along the science pipeline. International Journal of Science Education, 30(12), 1557–1584. doi:https://doi.org/10.1080/09500690701324208
- Andre, T., Whighman, M., Hendrickson, A., & Chambers, S. (1999). Competency beliefs, positive affect, and gender stereotypes of elementary students and their parents about science versus other school subjects. Journal of Research in Science Teaching, 36(6), 719–747. doi:https://doi.org/10.1002/(SICI)1098-2736(199908)36:6<719::AID-TEA8>3.0.CO;2-R
- Archer, L., DeWitt, J., Osborne, J., Dillon, J., Willis, B., & Wong, B. (2010). Doing’ science versus ‘being’ a scientist: Examining 10/11 year old school children’s constructions of science through the lens of identity. Science Education, 94(4), 617–639. doi:https://doi.org/10.1002/sce.20399
- Archer, L., DeWitt, J., Osborne, J., Dillon, J., Willis, B., & Wong, B. (2012). Science aspirations and family habitus: How families shape children’s identification and engagement with science. American Educational Research Journal, 49(5), 881–908. doi:https://doi.org/10.3102/0002831211433290
- Archer, L., DeWitt, J., Osborne, J., Dillon, J., Willis, B., & Wong, B. (2013). Not girly, not sexy, not glamorous’: Primary school girls’ and parents’ constructions of science aspirations. Pedagogy, Culture & Society, 21(1), 171–194. doi:https://doi.org/10.1080/14681366.2012.748676
- Archer, L., Moote, J., Francis, B., DeWitt, J., & Yeomans, L. (2017). The ‘exceptional’ physics girl: A sociological analysis of multimethod data from young women aged 10-16 to explore gendered patterns of post-16 participation. American Educational Research Journal, 54(1), 88–126. doi:https://doi.org/10.3102/0002831216678379
- Aschbacher, P. R., Li, E., & Roth, E. J. (2010). Is science me? High school students’ identities, participation and aspirations in science, engineering, and medicine. Journal of Research in Science Teaching, 47(5), 564–582.
- Atherton, G., Cymbir, E., Roberts, K., Page, L., & Remedios, R. (2009). How young people formulate their views about the future. Department for Children, Schools and Families.
- Barmby, P., Kind, P. M., & Jones, K. (2008). Examining changing attitudes in secondary school science. International Journal of Science Education, 30(8), 1075–1093. doi:https://doi.org/10.1080/09500690701344966
- Breakwell, G. M., & Robertson, T. (2001). The gender gap in science attitudes, parental and peer influences: Changes between 1987-88 and 1997-98. Public Understanding of Science, 10(1), 71–82. doi:https://doi.org/10.3109/2Fa036856
- Campbell, D. T., & Fiske, D. W. (1959). Convergent and discriminant validation by the multitrait-multimethod matrix. Psychological Bulletin, 56(2), 81–105. doi:https://doi.org/10.1037/h0046016
- Chowdhury, M. Z. I., & Turin, T. C. (2020). Variable selection strategies and its importance in clinical prediction modelling. Family Medicine and Community Health, 8(1), e000262. doi:https://doi.org/10.1136/fmch-2019-000262
- DeWitt, J., & Archer, L. (2015). Who aspires to a science career? A comparison of survey responses from primary and secondary school students. International Journal of Science Education, 37(13), 2170–2192. doi:https://doi.org/10.1080/09500693.2015.1071899
- DeWitt, J., Archer, L., & Moote, J. (2019). 15/16-year-old students’ reasons for choosing and not choosing physics at a level. International Journal of Science and Mathematics Education, 17(6), 1071–1087. https://doi.org/https://doi.org/10.1007/s10763-018-9900-4
- DeWitt, J., Archer, L., & Osborne, J. (2013). Nerdy, brainy and normal: Children’s and parents’ constructions of those who are highly engaged with science. Research in Science Education, 43(4), 1455–1476. https://doi-org.ezphost.dur.ac.uk/10.1007/s11165-012-9315-0
- DeWitt, J., Archer, L., & Osborne, J. (2014). Science-related aspirations across the primary-secondary divide: Evidence from two surveys in england. International Journal of Science Education, 36(10), 1609–1629. doi:https://doi.org/10.1080/09500693.2013.871659
- DeWitt, J., Archer, L., Osborne, J., Dillon, J., Willis, B., & Wong, B. (2011). High aspirations but low progression: The science aspirations-careers paradox among minority ethnic students. International Journal of Science and Mathematics Education, 9(2), 243–271. doi:https://doi.org/10.1007/s10763-010-9245-0
- Erb, T. O., & Smith, W. S. (1984). Validation of the attitude TowardWomen in Science Scale for early adolescents. Journal of Research in Science Teaching, 21(4), 391–397. doi:https://doi.org/10.1002/tea.3660210407
- Field, A. (2009). Discovering statistics using SPSS (3rd ed.). SAGE.
- Francis, R., Archer, L., Moote, J., DeWitt, J., MacLeod, E., & Yeomans, L. (2017). The construction of physics as a quintessentially masculine subject: Young people’s perceptions of gender issues in access to physics. Sex Roles, 76(3-4), 156–174. https://doi.org/https://doi.org/10.1007/s11199-016-0669-z
- Freeman, C. E. (2004). Trends in Educational equity of girls and women: 2004 (NCES 2005–016). U.S. Department of Education, National Center for Education Statistics. U.S. Government Printing Office.
- Gaucher, D., Friesen, J., & Kay, A. C. (2011). Evidence that gendered wording in job advertisements exists and sustains gender inequality. Journal of Personality and Social Psychology, 101(1), 109–128. doi:https://doi.org/10.1037/a0022530
- Gilmartin, S. K., Li, E., & Aschbacher, P. (2006). The relationship between secondary students’ interest in physical science or engineering, science class experiences, and family contexts: Variations by gender and race/ethnicity. Journal of Women and Minorities in Science and Engineering, 12(2-3), 179–207. doi:https://doi.org/10.1615/JWomenMinorScienEng.v12.i2-3.50
- Gorard, S., & See, B. H. (2008). Is science a middle-class phenomenon? The SES determinants of 16–19 participation. Research in Post-Compulsory Education, 13(2), 217–226. https://doi.org/https://doi.org/10.1080/13596740802141345
- Hair, J., Anderson, R., Tatham, R., & Black, W. (1998). Multivariate data analysis (5th ed.). Prentice Hall.
- Harvard Crimson. (2005). Full Transcript: President Summers’ Remarks at the National Bureau of Economic Research, Jan. 14 2005.” URL: http://www.thecrimson.com/article.aspx?ref = 505844
- Helford, E. R. (Ed.) (2000). Fantasy girls: Gender in the new universe of science fiction and Fantasy television. Rowman and Littlefield.
- IOP. (2017). Improving gender balance: Reflections on the impact of interventions in schools. An Institute of Physics Report, London. Accessed June 19, 2020. https://beta.iop.org/sites/default/files/2019-07/IGB-reflections-intervention.pdf
- IOP. (2018). Why not physics? A snapshot of girls’ uptake at A-level An Institute of Physics Report, London. Accessed June 19, 2020. https://www.iop.org/sites/default/files/2018-10/why-not-physics.pdf
- Jacobs, J. (1991). Influence of gender stereotypes on parent and child mathematics attitudes. Journal of Educational Psychology, 83(4), 518–527. doi:https://doi.org/10.1037/0022-0663.83.4.518
- Jacobs, J. E., Chhin, C. S., & Bleeker, M. M. (2006). Enduring links: Parents’ expectations and their young adult children's gender-typed occupational choices. Educational Research and Evaluation, 12(4), 395–407. https://doi.org/https://doi.org/10.1080/13803610600765851
- Kind, P. M., Jones, K., & Barmby, P. (2007). Developing attitudes towards science measures. International Journal of Science Education, 29(7), 871–893. doi:https://doi.org/10.1080/09500690600909091
- Lindahl, B. (2007). A longitudinal study of students’ attitudes towards science and choice of career. Proceedings of the 80th NARST International conference, April 15-18, 2007, New Orleans, LA.
- Losh, S. C. (2010). Stereotypes about scientists over time among US adults: 1983 and 2001. Public Understanding of Science, 19(3), 372–382. doi:https://doi.org/10.1177/0963662508098576
- Lyons, T., & Quinn, F. (2010). Choosing science: Understanding the decline in senior high school science enrolments. University of New England.
- Ma, Y. (2011). Gender differences in the paths leading to a STEM baccalaureate. Social Science Quarterly, 92 (5), 1169–1190. https://doi.org/https://doi.org/10.1111/j.1540-6237.2011.00813.x
- Markus, H., & Nurius, P. (1986). Possible selves. American Psychologist, 41(9), 954–969. doi:https://doi.org/10.1037/0003-066X.41.9.954
- Mayhew, K., Deer, C., & Dua, M. (2004). The move to mass higher education in the UK: Many questions and some answers. Oxford Review of Education, 30(1), 65–82. doi:https://doi.org/10.1080/0305498042000190069
- Mujtaba, T., & Reiss, M. J. (2013a). Inequality in experiences of physics education: Secondary school girls’ and boys’ perceptions of their physics education and intentions to continue with physics after the age of 16. International Journal of Science Education, 35(11), 1824–1845. doi:https://doi.org/10.1080/09500693.2012.762699
- Mujtaba, T., & Reiss, M. J. (2013b). What sort of girl wants to study physics after the Age of 16? Findings from a large-scale UK survey. International Journal of Science Education, 35(17), 2979–2998. https://doi.org/https://doi.org/10.1080/09500693.2012.681076
- Murphy, C., & Beggs, J. (2005). Primary science in the UK: A scoping study. Final report to the Wellcome trust. Wellcome Trust.
- Murphy, P., & Whitelegg, E. (2006). Girls in the physics classroom: A review of the research on the participation of girls in physics. Institute of Physics.
- Newton, D. P., & Newton, L. D. (1992). Young children's perceptions of science and the scientist. International Journal of Science Education, 14(3), 331–348. https://doi.org/https://doi.org/10.1080/0950069920140309
- Newton, L. D., & Newton, D. P. (1998). Primary children's conceptions of science and the scientist: Is the impact of a national curriculum breaking down the stereotype? International Journal of Science Education, 20(9), 1137–1149. https://doi.org/https://doi.org/10.1080/0950069980200909
- Nord, C., Roey, S., Perkins, R., Lyons, M., Lemanski, N., Brown, J., & Schuknecht, J. (2011). The nation’s report card: America’s high school graduates (NCES 2011-462). U.S. Department of Education, National Center for Education Statistics, U.S. Government Printing Office.
- Nosek, B. A., Smyth, F. L., Sriram, N., Lindner, N. M., Devos, T., Ayala, A., Bar-Anan, Y., Bergh, R., Cai, H., Gonsalkorale, K., & Kesebir, S. (2009). National differences in gender-science stereotypes predict national sex differences in science and math achievement. Proceedings of the National Academy of Sciences, 106(26), 10593–10597.
- Owen, S. V., Toepperwein, M. A., Pruski, L. A., Blalock, C. L., Liu, Y., Marshall, C. E., & Lichtenstein, M. J. (2007). Psychometric re-evaluation of the Women in Science Scale (WiSS). Journal of Research in Science Teaching, 44(10), 1461–1478. https://doi.org/https://doi.org/10.1002/tea.20187
- Räty, H., & Kärkkäinen, R. (2011). Are parents’ academic gender stereotypes and changes in them related to their perceptions of their child’s mathematical competence? Educational Studies, 37(3), 371–374. https://doi.org/https://doi.org/10.1080/03055698.2010.506344
- Riegle-Crumb, C., Farkas, G., & Muller, C. (2006). The role of gender and friendship in advanced course-taking. Sociology of Education, 79(3), 206–228. doi:https://doi.org/10.1177/003804070607900302
- Sieben, S., & Lechner, C. (2019). Measuring cultural capital through the number of books in the household. Measurement Instruments for the Social Sciences, 1(1), 15–27. doi:https://doi.org/10.1186/s42409-018-0006-0
- Tai, R. H., Qi Liu, C., Maltese, A. V., & Fan, X. (2006). Planning early for careers in science. Science, 312(5777), 1143–1144. doi:https://doi.org/10.1126/science.1128690
- Tavakol, M., & Dennick, R. (2011). Making sense of Cronbach's alpha. International Journal of Medical Education, 2, 53–55. doi:https://doi.org/10.5116/ijme.4dfb.8dfd
- Tenenbaum, H. R., & Leaper, C. (2003). Parent-child conversations about science: The socialization of gender inequities? Developmental Psychology, 39(1), 34–47. doi:https://doi.org/10.1037/0012-1649.39.1.34
- Terzian, S. G., & Grunzke, A. L. (2007). Scrambled eggheads: Ambivalent representations of scientists in Six hollywood film comedies from 1961 to 1965. Public Understanding of Science, 16(2), 407–419. doi:https://doi.org/10.1177/0963662506067908
- The Royal Society, with OPM. (2006). Taking a leading role—scientists survey. The Royal Society.