
Abstract
Objective
Though recent studies have pointed out different manifestations between obese and nonobese patients with polycystic ovarian syndrome (PCOS), there is no clear evidence to confirm this viewpoint. Therefore, the metabolic characteristics of obese and nonobese patients with PCOS were systematically compared through meta-analysis in this study.
Methods
Data were searched from PubMed, Web of Science, Embase, Cochrane Library, CNKI, and Wanfang databases. Articles on obese and nonobese patients with PCOS published from database inception to January 2022 were included. Meta-analysis was performed using Stata 16.0 statistical software.
Results
A total of 739 articles were initially retrieved, and ultimately 14 studies were involved in the meta-analysis. Specifically, there were 801 patients in the observation group (obese patients with PCOS) and 925 patients in the control group (nonobese patients with PCOS). Compared with the control group, the observation group had significantly lower levels of sex hormone-binding globulin (SHBG), high-density lipoprotein (HDL), luteinizing hormone (LH), follicle-stimulating hormone (FSH), and higher levels of total cholesterol (TC), triglyceride (TG), and low-density lipoprotein (LDL). Nevertheless, there were no significant differences between the two groups in systolic blood pressure (SBP), diastolic blood pressure (DBP), glucose, and testosterone.
Conclusion
Compared with nonobese patients with PCOS, obese patients with PCOS have worse blood lipid parameters and lower levels of LH and FSH. Also, there are significant differences in metabolic characteristics between the two groups of patients. Most importantly, our findings provide guidance for the clinical diagnosis and treatment of PCOS.
Introduction
Polycystic ovarian syndrome (PCOS) is one of the common gynecological endocrine diseases, attacking about 10.01% of women of reproductive age [Citation1]. The etiology and pathogenesis of PCOS have not been elucidated yet, though some studies have reported possible causes such as abnormal hypothalamic-pituitary-ovarian axis function, abnormal adrenal endocrine function, insulin resistance, and hyperinsulinemia, caused by genetic and environmental factors [Citation2]. Generally, the clinical manifestations of PCOS often include menstrual disorders, infertility, hirsutism, acne, obesity, and access nigricans. Patients with PCOS, often accompanied by obesity, are characterized by persistent inflation, polycystic ovarian changes, insulin resistance, as well as clinical or biochemical manifestations like excess androgens [Citation3].
Studies have shown that obesity is closely related to PCOS [Citation4,Citation5]. Both obese and nonobese PCOS patients have more visceral adipose tissue (VAT) than women without PCOS, and VAT is positively correlated with total androgen levels [Citation6]. Compared with normal-weigh PCOS patients, overweight patients present much higher levels of serum-free testosterone and free androgen index [Citation7]. There are significant differences in the clinical manifestations and biochemical characteristics between obese and nonobese PCOS patients, and the elucidation of their differences is of great significance for clinical diagnosis and personalized treatment. At present, researchers pay attention to the metabolic characteristics of PCOS patients, and some researchers utilize meta-analysis to compare the metabolic characteristics of women with PCOS and women without PCOS [Citation2]. However, no one has utilized meta-analysis to compare the metabolic characteristics of obese and nonobese patients with PCOS. In this study, we collected relevant literature on the metabolic characteristics of obese and non-obese PCOS patients. Through relevant data extracted from the collected literature and subsequent meta-analysis, our paper provides guidance for further study on the mechanisms and clinical diagnosis and treatment of PCOS.
Materials and methods
Search strategy
The protocol for this meta-analysis was prospectively registered with PROSPERO (CRD42022351234). Literature searches were conducted on PubMed, Web of Science, Embase, Cochrane Library, China National Knowledge Infrastructure (CNKI), and Wanfang databases from inception to January 2022. In this research, mesh and free terms were searched simultaneously, and Boolean logic operators were used to formulate the search formula. There was no limit to language, nation, or race; and review, systematic review, and meta-analysis were filtered out. The search terms were shown as follows: ‘Polycystic Ovarian Syndrome or PCOS’ AND ‘Obesity’ AND, ‘clinical features’ OR ‘Metabolic characteristics’ OR ‘Endocrine features’ OR ‘hormone’ OR ‘Symptom’. Supplementary Table 1 shows the specific search strategy.
Inclusion criteria: (1) Study subjects: patients with ovulation or anovulation, accompanied by clinical manifestations such as hyperandrogenism or hyperandrogenemia and polycystic ovarian changes, and diagnosed as polycystic ovary syndrome; (2) Intervention measures: according to the body mass index (BMI), patients were divided into observation group (overweight PCOS patients) and control group (nonoverweight PCOS patients); (3) Study design: observational studies (OS) published in relevant medical journals at home and abroad were selected; (4) Outcome measures (at least including one of the following indicators): systolic blood pressure (SBP), diastolic blood pressure (DBP), glucose, sex hormone-binding globulin (SHBG), total cholesterol (TC), triglyceride (TG), low-density lipoprotein (LDL), high-density lipoprotein (HDL), luteinizing hormone (LH), follicle-stimulating hormone (FSH), testosterone; (5) Others: with clear inclusion or exclusion criteria.
Exclusion criteria: (1) Non-CTs; (2) The data required could not be obtained; (3) The diagnostic criteria or outcome measures were not clear; (4) Review, case reports, animal experiments, and other nonclinical trial studies.
Data extraction and quality assessment
Endnote 7.0 software was used to save retrieved literature. The duplicate literature was eliminated by the computer deduplication tool of endnote software first, followed by the screening of the remaining duplicate literature manually. Next, two reviewers independently screened the literature and extracted the required data in strict accordance with the inclusion and exclusion criteria. The extracted relevant data mainly include title, author, literature type, study design, study participants, intervention measures, and outcome measures. Additionally, the risk of bias was assessed using Review Manager 5.30 based on the Cochrane Handbook for Systematic Reviews of Interventions. A third evaluator was consulted in case of disagreement between the two evaluators to reach a consensus.
Statistical analysis
The software Stata16.0 was used for data collation and statistical analysis. Continuous variables were expressed as standardized mean difference (SMD) and 95% confidence interval (CI). Statistical heterogeneity across studies was assessed using the chi-square tests and I2 statistics. I2 < 50% and p > .05 indicated no statistical heterogeneity and the feasibility of fixed-effects model; the random-effects model was applied in case of the presence of statistical heterogeneity (I2 > 50% and p < .05). Further sensitivity analysis was performed for the possible causes of heterogeneity, and a funnel plot was adopted to determine the presence of publication bias. Besides, p < .05 was considered significantly different.
Results
Literature search results
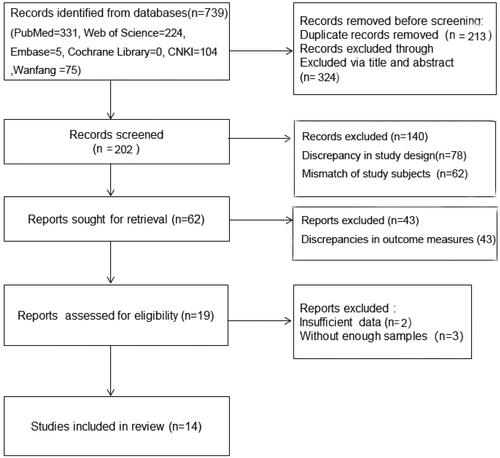
A total of 739 articles were initially retrieved, and 213 duplicate studies were first excluded. Another 324 articles were excluded after reading their titles and abstracts, followed by the removal of 188 unqualified ones. Next, based on the inclusion and exclusion criteria, the evaluators read the full text and excluded five articles without data required by this meta-analysis. Ultimately, 14 articles were included. The literature screening process is shown in .
Figure 1. Flow chart of literature screening.
A total of 1726 patients with PCOS were included, 801 patients in the observation group (obese PCOS patients) and 925 patients in the control group (nonobese PCOS). The characteristics included in this research were displayed in . The risk of bias graph and risk of bias summary were presented in . Thirteen studies were assessed as ‘medium’ quality [Citation8–12,Citation14–21] and only one paper [Citation13] was ‘low’-quality study according to the GRADE approach.
Figure 2. the Result of risk of bias.
A: Risk of bias graph; B: Risk of bias summary
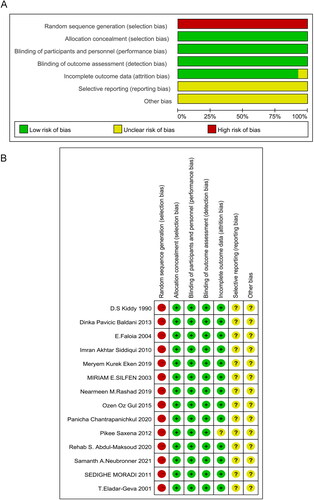
Table 1. Basic characteristics of included literature.
Meta-analysis results of clinical indicators
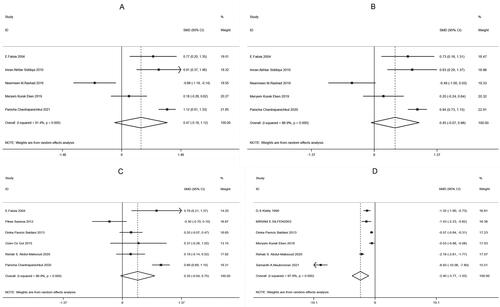
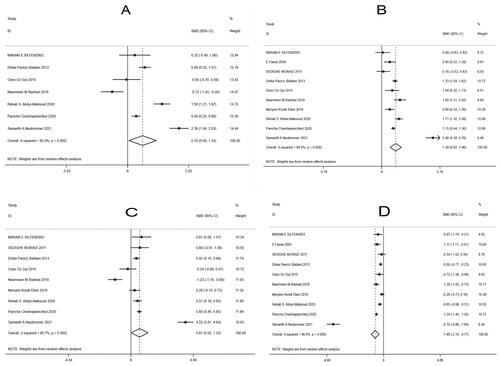
According to the results of this study, five papers [Citation8–12] among the included literature compared SBP, five [Citation8–12] compared DBP, six [Citation8,Citation12–16] compared glucose, and six [Citation11,Citation14,Citation16–19] compared SHBG, between the observation and control groups. There was heterogeneity among the above studies (SBP: I2 = 91.4%, p < .001; DBP: I2 = 86.9%, p < .001; glucose: I2 = 86.9%, p < .001; SHBG: I2 = 97.8%, p < .001), so the random-effects model was used to combine effect sizes. In addition, the study results showed that SHBG [SMD = −2.40, 95% CI (−3.77, −1.03), p = .001, ] in the observation group was much lower than that in the control group, while SBP [SMD = 0.47, 95% CI (−0.18, 1.12), p =.153, ], DBP [SMD = 0.45, 95% CI (−0.07, 0.98), p = .089, ] and glucose [SMD = 0.35, 95% CI (−0.04, 0.75), p = .080, ] had no significant difference between the two groups.
Figure 3. Forest plots for the Comparisons of clinical indicators between two groups of patients with PCOS (A: systolic blood pressure, SBP; B: diastolic blood pressure, DBP; C: glucose; D: sex hormone-binding globulin, SHBG).
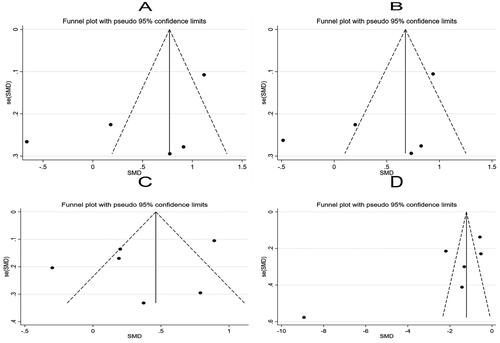
Further sensitivity analysis was carried out on the results of the study using a one-by-one elimination method. Specifically, Panicha Chantrapanichkul 2021 [12] may affect the heterogeneity of SBP while Samanth A. Neubronner 2021 [19] might affect the heterogeneity of SHBG. However, the results after removing the source of heterogeneity showed that the SHBG of the observation group was still lower than that of the control group, indicating that the original meta-analysis results had good stability (). Following a bias analysis of the included studies of SBP, DBP, Glucose, and SHBG, the results are shown in , with a scatter in the funnel plot indicating some publication bias.
Figure 4. Sensitivity analysis of clinical indicators in two groups of patients with PCOS (A: systolic blood pressure, SBP; B: diastolic blood pressure, DBP; C: glucose; D: sex hormone-binding globulin, SHBG).
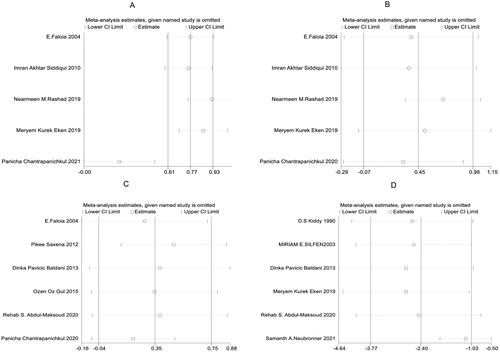
Figure 5. Funnel plots of clinical indicators in two groups of patients with PCOS (A: systolic blood pressure, SBP; B: diastolic blood pressure, DBP; C: glucose; D: sex hormone-binding globulin, SHBG).
Meta-analysis results of blood lipid parameters
Eight [Citation10–12,Citation14–16,Citation18,Citation19], 10 [Citation8,Citation10–12,Citation14–16,Citation18–20], nine [Citation10–12,Citation14–16,Citation18–20], and 10 [Citation8,Citation10–12,Citation14–16,Citation18–20] studies among the included literature compared the levels of TC, TG, LDL, and HDL between the two groups, respectively. The random-effects model was used because of significant heterogeneity among the studies (TC: I2 = 95.0%, p < .001; TG: I2 = 94.0%, p < .001; LDL: I2 = 95.7%, p < .001; HDL: I2 = 96.0%, p < .001). Compared with the control group, the observation group showed much higher levels of TC [SMD = 0.70, 95% CI (-0.05, 1.34), p = .034 <.05; ], TG [SMD = 1.39, 95% CI (0.82, 1.96), p < .001; ] and LDL [SMD = 0.67, 95% CI (0.02, 1.33), p = .044; ] and markedly lower levels of HDL [SMD = −1.46, 95% CI (-2.15, −0.77), p < .001; ].
Figure 6. Forest plots for the comparison of blood lipid parameters between two groups of patients with PCOS (A: total cholesterol, TC; B: triglyceride, TG; C: low-density lipoprotein, LDL; D: high-density lipoprotein, HDL).
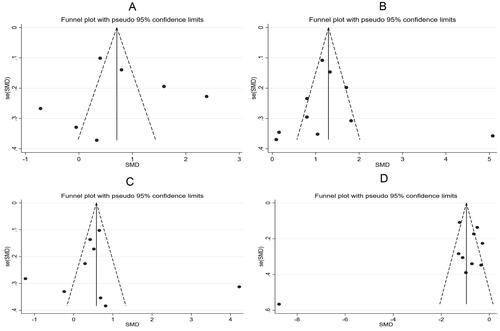
After the one-by-one elimination, sensitivity analysis results revealed that Samanth A. Neubronner 2021 [Citation19] might be the source of heterogeneity in the meta-analysis results of TG. However, significant differences could be observed between the original results and the sensitivity analysis results of TC, LDL, and HDL, indicating that the meta-analysis results were robust and reliable (). Subsequently, a bias analysis was performed for studies on each indicator. In terms of TC, the data points on the funnel plot presented a diffused distribution, indicating the possibility of some publication bias. Actually, the bias may be caused by the small number of included studies. As for TG, LDL, and HDL, the data points were approximately symmetrically distributed on both sides of the funnel except for a few scatter points, indicating slight publication bias ().
Figure 7. Sensitivity analysis of blood lipid parameters in two groups of patients with PCOS (A: total cholesterol, TC; B: triglyceride, TG; C: low-density lipoprotein, LDL; D: high-density lipoprotein, HDL).
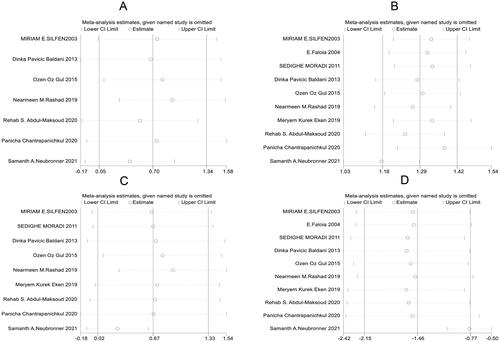
Figure 8. Funnel plots of blood lipid parameters in two groups of patients with PCOS (A: total cholesterol, TC; B: triglyceride, TG; C: low-density lipoprotein, LDL; D: high-density lipoprotein, HDL).
Meta-analysis results of hormone indicators
In the included literature, seven [Citation10,Citation13,Citation14,Citation17–19,Citation21], and seven [Citation8,Citation10,Citation13,Citation17–19,Citation21] articles compared the levels of LH, FSH and testosterone between the two groups, respectively. According to the results of the random-effect model (LH: I2 = 94.8%, p < .001; FSH: I2 = 95.0%, p < .001; Testosterone: I2 = 97.4%, p < .001), the observation group showed significantly lower levels of LH [SMD = −1.10, 95% CI (-1.79, −0.41), p = .020, ] and FSH [SMD = −0.99, 95% CI (-1.93, −0.06), p = .037, ] than the control group, while the two groups had no marked difference in testosterone [SMD = −0.21, 95% CI (-0.70, 0.28), p = .401, ].
Figure 9. Meta-analysis of hormone indicators in two groups of patients with PCOS.
C: Forest plots of luteinizing hormone (LH, A), follicle stimulating hormone (FSH, B), testosterone (C); D-F: Sensitivity analysis of LH (D), FSH (E), testosterone (F); G-I: Funnel plots of LH (G), FSH (H), testosterone (I)
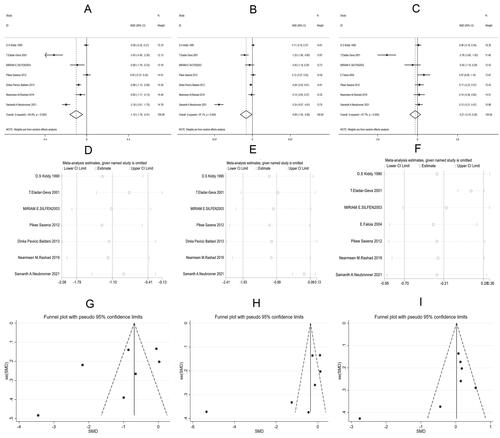
Further sensitivity analysis on the studies reporting LH, FSH, and testosterone showed that Samanth A. Neubronner 2021 [Citation19] might be the source of heterogeneity of FSH, and T. Eladar-Geva 2001 [Citation21] affected the heterogeneity of testosterone (). Subsequently, a bias analysis was performed for each indicator; data points on the funnel plots presented a diffused distribution, suggesting the presence of publication bias ().
Discussion
PCOS, also known as Stein–Leventhal syndrome, is a clinical syndrome first proposed by Stein and Leventhal in 1935. The symptoms of PCOS are mainly manifested as hirsutism (excessive growth of terminal hair of a female in a male pattern), enlarged polycystic ovaries, obesity, chronic anovulation, and infertility [Citation22]. Following the release of Rotterdam diagnostic criteria in 2003 [Citation23], more authoritative international evidence-based guidelines for the evaluation and management of PCOS [Citation24] were issued in 2018. Guidelines published in 2018 have demonstrated that, in addition to the three Rotterdam diagnostic criteria for PCOS, patients are characterized by two of the following three criteria: biochemical parameters of oligoovulation or anovulation, hyperandrogenism, and polycystic ovarian morphology at ultrasound. The importance of clinical and biochemical parameters in the diagnosis and treatment of PCOS has been affirmed at present. Despite being not a necessary indicator for the diagnosis, obesity is closely related to PCOS [Citation4,Citation5]. Many studies have pointed out significant differences in the clinical manifestations and biochemical parameters between obese and non-obese patients with PCOS, as well as the vital role of obesity in the progression and prognosis of PCOS [Citation25–27]. The differentiation between the two types of PCOS patients may contribute to further investigate the mechanism of the disease.
Hyperandrogenism is not only closely associated with obesity but also acts as a major feature of PCOS [Citation28]. Androgens can induce abdominal fat accumulation [Citation29], and a study has shown that the expression of lipogenic enzymes and high-density oligonucleotide arrays against lipolysis in omental adipose tissue of obese women with PCOS is higher than that of obese women without hyperandrogenism [Citation30]. Abdominal fat accumulation and insulin resistance induce androgen synthesis in the adrenal gland [Citation26]. Obese PCOS patients in our study had significantly lower SHBG than non-obese patients, indicating higher free androgen levels in the former. Consistently, Li L et al. [Citation31] concluded in a meta-analysis that obese adolescents with PCOS had notably lower SHBG and HDL cholesterol than normal-weight adolescents with PCOS. In obese PCOS patients, reduced adiponectin decreases the expression of intercellular adhesion molecules, which in turn causes decreased insulin sensitivity, leading to the development of insulin resistance [Citation32]. Insulin resistance can increase androgen production and decrease SHBG levels in the body to increase free testosterone [Citation33]. In our study, there was no significant difference in testosterone between obese and non-obese women with PCOS, which is inconsistent with Li L’s findings. The inconsistency is possibly caused by the small number and low quality of studies on SHBG and testosterone. Another reason may be that testosterone is one of the sex hormones transported by SHBG, and that SHBG levels do not significantly reflect the level of testosterone.
Besides, we found that TC, TG, and LDL were greatly higher, while HDL was notably lower in obese PCOS patients than in nonobese PCOS patients. Another meta-analysis of 30 studies by Lim SS et al. also stated that obese patients with PCOS were worse than nonobese patients in TC and other blood lipids [Citation34]. Hyperandrogenism increases adipogenesis and inhibits fat decomposition, leading to the development of obesity in PCOS. Obesity further aggravates the disorder of endocrine hormones, causing abnormal glucose and lipid metabolism in PCOS patients [Citation35–36]. In addition, in this study, LH and FSH levels in the observation group were significantly lower than those in the control group, while no marked difference was identified in SBP, DBP, and glucose between the two groups. Collectively, obesity-related insulin resistance and hyperandrogenism, obesity-induced abnormal secretion of free fatty acids and adipokines, and obesity-induced disorder of endocrine hormones may jointly participate in the development of PCOS, leaving obese PCOS patients with more severe endocrine and glucolipid metabolism disorders.
The problem of heterogeneity should be considered when examining the results of this meta-analysis. We found significant heterogeneity across the included studies, which may reduce the reliability. However, as PCOS is a form of heterogeneous endocrinopathy with various clinical features, it is reasonable that significant heterogeneity was observed in our meta-analysis. The observed indicators included in this study were performed by a sensitivity analysis using a one-by-one elimination method. After removing the source of heterogeneity, the meta-analysis results did not change significantly. The results indicate that our meta-analysis results had good stability and are reliable.
The results of this meta-analysis revealed significant differences in metabolic characteristics between obese and non-obese PCOS patients, suggesting the possibility of differences in pathogenesis and therapeutic effects between them. All in all, the classification of PCOS patients into obese and non-obese subtypes is of great significance for elucidating their molecular pathological process and personalized treatment. However, there are still some limitations in this study. Firstly, only 14 studies were included, and the small sample sizes in some studies might affect the final results. Secondly, some included studies were of low quality, and analysis results with a lack of repeated validation may lead to bias in the analysis results. Therefore, more high-quality original studies are needed to draw more stable conclusions.
Conclusions
In summary, the blood lipid parameters (SHBG, LH, and FSH) of obese PCOS patients are worse than those of nonobese PCOS patients. Furthermore, significant differences in clinical and metabolic characteristics between obese and nonobese PCOS patients suggest a significant effect of obesity on metabolic disorders and the progression of PCOS. Overall, the number and quality of studies included in this study show some deficiencies, so further large-sample and multicenter OS are still needed to enhance the accuracy and reliability of study results and provide more effective treatments.
Authors’ contributions
Xiaotian Pan wrote the paper, conceived and designed the study, as well as analyzed the data.
Supplemental Material
Download MS Word (12.1 KB)Acknowledgements
Not applicable.
Availability of data and materials
The datasets used and/or analyzed during the current study are available from the corresponding author on reasonable request.
Disclosure statement
No potential conflict of interest was reported by the authors.
Additional information
Funding
References
- Wu Q, Gao J, Bai D, et al. The prevalence of polycystic ovarian syndrome in Chinese women: a meta-analysis. Ann Palliat Med. 2021;10(1):1–10. doi: 10.21037/apm-20-1893.
- Lim SS, Kakoly NS, Tan JWJ, et al. Metabolic syndrome in polycystic ovary syndrome: a systematic review, meta-analysis and meta-regression. Obes Rev. 2019;20(2):339–352. doi: 10.1111/obr.12762.
- Li A, Zhang L, Jiang J, et al. Follicular hyperandrogenism and insulin resistance in polycystic ovary syndrome patients with normal circulating testosterone levels. J Biomed Res. 2017;208–214.
- Ma X, Hayes E, Prizant H, et al. Leptin-induced CART (cocaine- and amphetamine-regulated transcript) is a novel intraovarian mediator of obesity-related infertility in females. Endocrinology. 2016;157(3):1248–1257. doi: 10.1210/en.2015-1750.
- Cena H, Chiovato L, Nappi RE. Obesity, polycystic ovary syndrome, and infertility: a new avenue for GLP-1 receptor agonists. J Clin Endocrinol Metab. 2020;105(8):e2695–e2709. doi: 10.1210/clinem/dgaa285.
- Jena D, Choudhury AK, Mangaraj S, et al. Study of visceral and subcutaneous abdominal fat thickness and its correlation with cardiometabolic risk factors and hormonal parameters in polycystic ovary syndrome. Indian J Endocrinol Metab. 2018;22(3):321–327. doi: 10.4103/ijem.IJEM_646_17.
- Lazurova I, Lazurova Z, Figurova J, et al. Relationship between steroid hormones and metabolic profile in women with polycystic ovary syndrome. Physiol Res. 2019;68(3):457–465. doi: 10.33549/physiolres.934062.
- Faloia E, Canibus P, Gatti C, et al. Body composition, fat distribution and metabolic characteristics in lean and obese women with polycystic ovary syndrome. J Endocrinol Invest. 2004;27(5):424–429. doi: 10.1007/BF03345285.
- Siddiqui IA, Tamimi W, Tamim H, et al. A study on clinical and sonographic features in obese and nonobese patients with polycystic ovary syndrome. Arch Gynecol Obstet. 2010;281(3):467–471. doi: 10.1007/s00404-009-1124-y.
- Rashad NM, Al-Sayed RM, Yousef MS, et al. Kisspeptin and body weight homeostasis in relation to phenotypic features of polycystic ovary syndrome; metabolic regulation of reproduction. Diabetes Metab Syndr. 2019;13(3):2086–2092. doi: 10.1016/j.dsx.2019.04.017.
- Kurek Eken M, Sahin Ersoy G, Yayla Abide C, et al. Association between circulating neuregulin 4 levels and metabolic, aterogenic, and AMH profile of polycystic ovary syndrome. J Obstet Gynaecol. 2019;39(7):975–980. doi: 10.1080/01443615.2019.1581754.
- Chantrapanichkul P, Indhavivadhana S, Wongwananuruk T, et al. Prevalence of type 2 diabetes mellitus compared between lean and overweight/obese patients with polycystic ovarian syndrome: a 5-year follow-up study. Arch Gynecol Obstet. 2020;301(3):809–816. doi: 10.1007/s00404-019-05423-2.
- Saxena P, Prakash A, Nigam A, et al. Polycystic ovary syndrome: is obesity a sine qua non? A clinical, hormonal, and metabolic assessment in relation to body mass index. Indian J Endocrinol Metab. 2012;16(6):996–999. doi: 10.4103/2230-8210.103011.
- Baldani DP, Skrgatic L, Goldstajn MS, et al. Clinical, hormonal and metabolic characteristics of polycystic ovary syndrome among obese and nonobese women in the Croatian population. Coll Antropol. 2013;37(2):465–470.
- Gul OO, Cander S, Gul B, et al. Evaluation of insulin resistance and plasma levels for visfatin and resistin in obese and non-obese patients with polycystic ovary syndrome. Eur Cytokine Netw. 2015;26(4):73–78. doi: 10.1684/ecn.2015.0370.
- Abdul-Maksoud RS, Zidan HE, Saleh HS, et al. Visfatin and SREBP-1c mRNA expressions and serum levels among Egyptian women with polycystic ovary syndrome. Genet Test Mol Biomarkers. 2020;24(7):409–419. doi: 10.1089/gtmb.2019.0192.
- Kiddy DS, Sharp PS, White DM, et al. Differences in clinical and endocrine features between obese and non-obese subjects with polycystic ovary syndrome: an analysis of 263 consecutive cases. Clin Endocrinol (Oxf). 1990;32(2):213–220. doi: 10.1111/j.1365-2265.1990.tb00857.x.
- Silfen ME, Denburg MR, Manibo AM, et al. Early endocrine, metabolic, and sonographic characteristics of polycystic ovary syndrome (PCOS): comparison between nonobese and obese adolescents. J Clin Endocrinol Metab. 2003;88(10):4682–4688. doi: 10.1210/jc.2003-030617.
- Neubronner SA, Indran IR, Chan YH, et al. Effect of body mass index (BMI) on phenotypic features of polycystic ovary syndrome (PCOS) in Singapore women: a prospective cross-sectional study. BMC Womens Health. 2021;21(1):135.
- Moradi S, Mollabashi M, Kerman SR. Relation between C-reactive protein and body mass index in patients with polycystic ovarian syndrome. Gynecol Endocrinol. 2011;27(7):480–485. doi: 10.3109/09513590.2010.501876.
- Eldar-Geva T, Spitz IM, Groome NP, et al. Follistatin and activin a serum concentrations in obese and non-obese patients with polycystic ovary syndrome. Hum Reprod. 2001;16(12):2552–2556. doi: 10.1093/humrep/16.12.2552.
- Stein I, Leventhal M. Amenorrhea associated with bilateral polycystic ovaries. American Journal of Obstetrics and Gynecology. 1935;29(2):181–191. (doi: 10.1016/S0002-9378(15)30642-6.
- Rotterdam EA-SPCWG. Revised 2003 consensus on diagnostic criteria and long-term health risks related to polycystic ovary syndrome. Fertil Steril. 2004;81(1):19–25.
- Teede HJ, Misso ML, Costello MF, et al. Recommendations from the international evidence-based guideline for the assessment and management of polycystic ovary syndrome. Hum Reprod. 2018;33(9):1602–1618. doi: 10.1093/humrep/dey256.
- Sirotkin AV, Fabian D, Babeľová Kubandová J, et al. Body fat affects mouse reproduction, ovarian hormone release, and response to follicular stimulating hormone. Reprod Biol. 2018;18(1):5–11. doi: 10.1016/j.repbio.2017.12.002.
- Delitala AP, Capobianco G, Delitala G, et al. Polycystic ovary syndrome, adipose tissue and metabolic syndrome. Arch Gynecol Obstet. 2017;296(3):405–419. doi: 10.1007/s00404-017-4429-2.
- Shorakae S, Abell SK, Hiam DS, et al. High-molecular-weight adiponectin is inversely associated with sympathetic activity in polycystic ovary syndrome. Fertil Steril. 2018;109(3):532–539. doi: 10.1016/j.fertnstert.2017.11.020.
- Milutinovic DV, Nikolic M, Velickovic N, et al. Enhanced inflammation without impairment of insulin signaling in the visceral adipose tissue of 5alpha-Dihydrotestosterone-Induced animal model of polycystic ovary syndrome. Exp Clin Endocrinol Diabetes. 2017;125(8):522–529.
- Corbould A. Chronic testosterone treatment induces selective insulin resistance in subcutaneous adipocytes of women. J Endocrinol. 2007;192(3):585–594. doi: 10.1677/joe.1.07070.
- Corton M, Botella-Carretero JI, Benguria A, et al. Differential gene expression profile in omental adipose tissue in women with polycystic ovary syndrome. J Clin Endocrinol Metab. 2007;92(1):328–337. doi: 10.1210/jc.2006-1665.
- Li L, Feng Q, Ye M, et al. Metabolic effect of obesity on polycystic ovary syndrome in adolescents: a meta-analysis. J Obstet Gynaecol. 2017;37(8):1036–1047. doi: 10.1080/01443615.2017.1318840.
- Barber TM, Kyrou I, Randeva HS, et al. Mechanisms of insulin resistance at the crossroad of obesity with associated metabolic abnormalities and cognitive dysfunction. Int J Mol Sci. 2021;22(2):546. doi: 10.3390/ijms22020546.
- Zeng X, Xie YJ, Liu YT, et al. Polycystic ovarian syndrome: correlation between hyperandrogenism, insulin resistance and obesity. Clin Chim Acta. 2020;502:214–221. doi: 10.1016/j.cca.2019.11.003.
- Lim SS, Norman RJ, Davies MJ, et al. The effect of obesity on polycystic ovary syndrome: a systematic review and meta-analysis. Obes Rev. 2013;14(2):95–109. doi: 10.1111/j.1467-789X.2012.01053.x.
- Legro RS. Obesity and PCOS: implications for diagnosis and treatment. Semin Reprod Med. 2012;30(6):496–506. doi: 10.1055/s-0032-1328878.
- Anagnostis P, Tarlatzis BC, Kauffman RP. Polycystic ovarian syndrome (PCOS): long-term metabolic consequences. Metabolism. 2018;86:33–43. doi: 10.1016/j.metabol.2017.09.016.