
 ?Mathematical formulae have been encoded as MathML and are displayed in this HTML version using MathJax in order to improve their display. Uncheck the box to turn MathJax off. This feature requires Javascript. Click on a formula to zoom.
Abstract
Background
Polycystic ovary syndrome (PCOS) was known as the common endocrine disease in women, featured as hyperandrogenism, ovulation disorders, etc. Fat mass and obesity-associated protein (FTO), a m6A demethylase, is abnormal in the occurrence of ovarian diseases. However, the mechanism of FTO in the pathogenesis of PCOS is still unclear.
Methods
The level of FTO in clinical samples, PCOS rat with hyperandrogenism and granulosa cells (GCs) lines effected by DHT were investigated by ELISA, qRT-PCR, WB, and IHC, while m6A RNA methylation level was studied by m6A Colorimetric and androgen level was tested through ELISA. Changes in steroid hormone synthetase and androgen receptor (AR)/prostate-specific antigen (PSA) levels in vitro were visualized by WB after transient transfection silenced FTO. The effect of DHT combined with FTO inhibitor meclofenamic acid (MA) on FTO, AR/PSA, and AKT phosphorylation were also demonstrated by WB. The co-localization of FTO and AR in KGN cells was analyzed by confocal microscopy, and the physiological interaction between FTO and AR was studied by Co-IP assay. The effect of FTO-specific inhibitor MA, AKT phosphorylation inhibitor LY294002, and the combined them on GCs proliferation and cell cycle were evaluated by drug combination index, EDU assay, and flow cytometry analysis.
Results
FTO expression was upregulated in follicular fluid and GCs in PCOS patients clinically. The high FTO expression in patients was negative with the level of m6A, but positive with the level of androgen. The upregulation of FTO was accompanied with a decrease in the level of m6A in PCOS rat with hyperandrogenism. Dihydrotestosterone (DHT) promoted the FTO expression and inhibited m6A content as a dose-dependent way in vitro. In contrast, suppression of FTO with siRNA attenuated the expression of steroid hormone synthetase such as CYP11A1, CYP17A1, HSD11B1, HSD3B2 except CYP19A1 synthetase, ultimately inducing the decrease of androgen level. Suppression of FTO also decreased the biological activity of androgen through downregulation AR/PSA. MA treatment as the specific FTO antagonist decreased cell survival in time- and dose-dependent way in GCs lines. Correspondingly, MA treatment decreased the expression of FTO, AR/PSA expression, and AKT phosphorylation in the presence of DHT stimulation. Additionally, we also speculate there is a potential relation between FTO and AR according to FTO was co-localized and interacted with AR in KGN cells. Compared with AKT phosphorylation inhibitor LY294002 or MA alone, LY294002 combined with MA synergistically inhibited cell survival and increased G2/M phase arrest in GC line.
Conclusions
We first evaluated the correlation of FTO and m6A in PCOS clinically, and further explored the mechanism between FTO and hyperandrogenism in PCOS animal and cell models. These findings contributed the potential therapy by targeting the FTO for hyperandrogenism in PCOS.
Introduction
Polycystic ovary syndrome (PCOS) is one of the most common endocrine disorders in women of reproductive age, affecting approximately 6–13% of women worldwide [Citation1,Citation2]. Patients are characterized by polycystic ovarian changes, ovulation disorders, hyperandrogenic signs, or hyperandrogenemia. Patients often present with metabolic dysfunction characterized by insulin resistance and compensatory hyperinsulinemia [Citation3]. Hyperandrogenism is one of the core pathophysiological features of PCOS, which plays an important role in the etiology of this syndrome [Citation4]. The AES criteria proposed by the American Androgen Excess and PCOS (AE-PCOS) Society in 2006 re-emphasized clinical or biochemical hyperandrogenism features as essential for the diagnosis of PCOS [Citation5]. Currently, the exact etiology and pathogenesis of PCOS is not yet clear. Aimed at weight control as the basis of PCOS treatment, to a great extent, is not ideal.
N6-methyladenosine (m6A) modification is a ubiquitous modification of RNA of eukaryotic cells, and it plays an important role in the regulation of gene expression. Fat mass and obesity-associated protein (FTO), is the first reported m6A demethylase [Citation6], which is highly expressed in human brain tissues and glandular tissues such as thyroid, adrenal, endometrium, and ovarian tissues. Multiple studies have confirmed that FTO is associated with obesity, cardiovascular disease, type 2 diabetes, and other metabolic diseases [Citation7–9].
FTO plays an important regulatory role in ovarian function through m6A demethylation involved in the process of ovarian aging [Citation10,Citation11]. In terms of PCOS-related studies, genetic variations in FTO are associated with the risk of PCOS [Citation12,Citation13]. In the progression of PCOS, hyperinsulinemia and hyperandrogenism improved each other: developing into a vicious cycle. Studies have already shown that the genetic variation of FTO is correlated with the characteristics of insulin resistance in PCOS patients [Citation14,Citation15].
The role of FTO in the pathogenesis of PCOS is still lacking in in-depth studies. Hyperandrogenism is the core pathophysiological feature of PCOS, but whether there is a correlation between FTO and hyperandrogenism in PCOS patients remains unknown. In this study, we aimed to clarify the expression pattern of FTO and m6A in granulosa cells (GCs) and follicular fluid (FF) of PCOS patients and the regulatory effect of FTO on m6A; elucidate the relationship and the mechanism between FTO and hyperandrogenism in PCOS. We hope that revealing the role of FTO in the pathogenesis of PCOS, it will provide a new theoretical basis for the clinical diagnosis and treatment of PCOS from the perspective of epigenetics.
Materials and methods
Patient recruitment
This study was approved by the Reproductive Medicine Ethics Committee of the First Hospital of Lanzhou University (LDYYSZLL2022-07). Patients who underwent IVF/ICSI treatment at our clinic from June to September 2022 were recruited and met the following inclusion criteria. The inclusion criteria were as follows: age: 20–35 years; BMI: 20–25 kg/m2; diagnosed with PCOS using Rotterdam criteria, or with tubal factors or male factor infertility (control). Patients were excluded if they had also endometriosis or other systemic conditions, such as diabetes, hypertension, or thyroid dysfunction.
All the enrolled women were on a long-term GnRH agonist regimen during the follicular phase. Triptorelin (3.75 mg, Decapeptyl; Ferring Pharmaceuticals PVT LTD, Swiss) was used for pituitary down-regulation in the GnRH agonist protocol. Recombinant HCG (250 mg, Ovidrel, Merck Serono S.p.A.; Italy) was administered when two leading follicles reached a mean diameter of 18 mm. Oocytes were retrieved transvaginal 36 h after HCG administration.
Follicular fluid collection and granulosa cell isolation
On the day of oocyte retrieval, the first tube of FF with oocytes was collected from each participant. We required this FF clear. After centrifugation of the FF, the supernatant was divided into 1.5-ml enzyme-free centrifuge tubes and stored at −80 °C. The remaining FF of each patient was collected and centrifuged in the 50-ml enzyme-free centrifuge tube. The precipitate was mixed with red blood cell lysate (Solarbio, China). After centrifugation, the supernatant was discarded, and the cell precipitate was transferred to human peripheral blood lymphocyte isolation solution (TBD, China). After centrifugation at 1600 rpm for 10 min, GCs were isolated from the middle layer, followed by washing GCs with PBS, discarding supernatant after centrifugation, adding 1 ml TRIzon Reagent (Kangwei, China) to GCs, and freezing at −80 °C.
FTO, androgen concentration analysis in follicular fluid
FTO and androgen concentrations were evaluated using ELISA kit (Jianglaibio, China), with a microplate reader FlexStation III (Molecular Services, USA). The intra- and inter-assay precision were less than 9% and 11%, respectively, and the minimal detectable concentration was less than 0.1 pg/ml in FTO ELISA kit. The intra- and inter-assay precision in androgen ELISA kit were same with the FTO ELISA, but the minimal detectable concentration was less than 0.1 ng/ml.
PCOS rat model
The study was approved by the Ethics Committee of Lanzhou University No.1 Hospital (LDYYLL-2022-424) and was conducted in accordance with the Declaration of Helsinki. 21-day-old female Sprague–Dawley rats were purchased from Lanzhou Veterinary Research Institute, Chinese Academy of Agricultural Sciences, kept under clean-grade laboratory conditions. All rats were divided into two groups randomly (treatment group, n = 8; control group, n = 8). Treatment groups were subcutaneously injected with dehydroepiandrosterone (DHEA) (6 mg/100 g body weight) (Coolaber, China) daily for 21 days to establish the PCOS model, while control groups were injected with 0.2 ml of sesame oil daily. After injection with DHEA for 14 days, vaginal smears were taken to monitor the estrous cycle every day. Before euthanasia, the rats were anesthetized with 2% pentobarbital sodium (2 ml/100g). Blood and ovaries were collected. After rinsed with PBS, the right ovary was frozen at −80 °C, and the left ovary was fixed in 4% formaldehyde solution for 24 h and then embedded in paraffin. The whole blood samples were left at room temperature for 2 h. The serum was centrifuged and stored at −80 °C.
FTO and hormone test
Serum concentrations of FTO, androgen, follicle-stimulating hormone (FSH), luteinizing hormone (LH), and estradiol were measured in rats using ELISA kits and a microplate readers FlexStation III (Molecular Services, USA). All ELISA kits were from JIANGLAIBIO (China) and all operations were followed the instructions. The intra- and inter-assay precision were less than 10% in every ELISA kit.
Cell culture and transfection
The human ovarian GC line KGN (Procell CL-0603) were provided by Procell Life Science & Technology Co., LTD (China) and cultured in Dulbecco’s Modified Eagle Medium/Nutrient Mixture F-12 (DMEM/F-12) (BasalMedia, China) at 37 °C and 5% CO2. The human ovarian GC line COV434 (RRID: CVCL_2010) were purchased from Zhejiang Meisen Cell Technology Co., LTD (China) and cultured in Dulbecco’s Modified Eagle’s Medium (DMEM) (Gibco, USA) at 37 °C and 5% CO2. The above mediums were both supplemented with 10% fetal bovine serum (ABW, China) and 1% penicillin–streptomycin. Dihydrotestosterone (DHT) was purchased from MCE (HY-A0120/CS-5096, USA). Meclofenamate sodium was purchased from Selleck (S4295, USA) and LY294002 was provided by Selleck (S1105, USA). siRNAs were transfected into KGN cells using Lipofectamine RNAiMAX Reagent (ThermoFisher Scientific, USA). Two small interference RNAs (siRNAs) targeting FTO named si-FTO-1 and si-FTO-2 and a negative control sictrl were purchased from Shanghai Sangon Biotech Co., LTD (China). The sequences for siRNAs were as follows: si-FTO-1: 5′-GCCAGUGAAAGGGUCUAAUAUTT-3′ (sense), 5′-AUAUUAGACCCUUUCACUGGCTT-3′ (anti-sense) and si-FTO-2:5′- UCACGAAUUGCCCGAACAUUATT (sense), 5′- UAAUGUUCGGGCAAUUCGUGATT-3′ (anti-sense). The sequences for sictrl was as follows: 5′-UUCUCCGAACGUGUCACGUTT-3′ (sense),5′-ACGUGACACGUUCGGAGAATT3’ (anti-sense).
Immunohistochemistry
Paraffin sections were placed in a 60°Coven for 1 h and then dewaxed successively in different concentrations of xylene and ethanol. After tissue sections were repaired with citric acid antigen repair buffer (pH6.0), tissue peroxidase blocker was added and incubated for 10 min at room temperature. The sections were rinsed with PBS and incubated with normal goat serum working solution for 15 min at room temperature. After discarding the blocking solution, FTO PolyAb (27226-1-AP, proteintech, China, 1:100 dilution) was directly added and incubated at 4 °C overnight. The sections were rinsed with PBS and incubated with biotin-labeled goat anti-rabbit IgG for 10 min. After rinsing, the sections were incubated with horseradish peroxidase-labeled streptavidin working solution for 15 min at room temperature. After washing the sections with PBS, they were stained with 3,3 N-diaminobenzidine (DAB) for 10 min and counterstained with hematoxylin for 2 min. The sections were rinsed thoroughly with tap water and then dehydrated and transparent in different concentrations of ethanol and xylene. After drying, neutral resin seal. The kit used was ZSGB-BIO (China).
Confocal microscopy analysis
KGN and COV434 cells were seeded in confocal culture dishes (Biosharp, Hefei, China) and then fixed with Immunol Staining Fix Solution (#P0098, Beyotime, China) for 15 min, permeated with 0.5% Triton X-100 (#P0096, Beyotime, China) in PBS for 5 min and were blocked in Immunol Staining Blocking Buffer (#P0102, Beyotime, China) for 1 h at room temperature. The cells were incubated overnight with anti-FSH receptor (FSHR) (22665-1-AP, Proteintech, China; 1:200 dilution), anti-FTO (27226-1-AP, proteintech, China; 1:500 dilution), anti-AR (66747-1-Ig, Proteintech, China; 1:500 dilution) antibodies at 4 °C. The cells were incubated with the secondary antibodies conjugated to Coralite 594, Coralite 488 at room temperature for 1 h in the dark. Then, the cell nuclei were stained with DAPI (1 μg/ml, Sangon) in the dark for 10 min. The cells were observed with a microscope equipped with a laser-scanning confocal imaging system (Zeiss LSM800, Germany).
M6A quantification in total RNA
For analyzing the relationship between the m6A methylation level and FTO expression in hyperandrogenism of PCOS, EpiQuik m6A RNA Methylation Quantification kit (Epigentek, P-9005-48, USA) was carried out for m6A methylation of total RNA. According to the manufacturer’s instructions, after binding 200 ng RNA to wells for 90 min at 37 °C, the samples were incubated for 60 min with capture antibody at room temperature. Then, the RNA mixture was incubated with enhanced solution at room temperature for 30 min after the incubation with detection antibody. After detection signaling was finished, the absorbance at 450 nm was read on a microplate reader FlexStation III (Molecular Services, USA) within 2 to 15 min. The relative amount of m6A was calculated with the following equation:
RNA extraction, reverse‑transcription and quantitative real-time PCR (qRT‑PCR)
Total RNA was extracted using the Trizon Reagent (Cwbio, China) and reverse-transcribed RNA to cDNA with the HiFiScript gDNA Removal cDNA Synthesis kit (Cwbio, China). Then, the qRT-PCR was carried out with the UltraSYBR mixture (Cwbio, China). All the above operations were performed according to the manufacturer’s protocol. The relative expressions of FTO were analyzed based on the formula 2−ΔΔCt. The sequences of primers were as follows: for human FTO: 5′-CTTCACCAAGGAGACTGCTATTTC-3′(forward), 5′-CAAGGTTCCTGTTGAGCACTCTG-3′(reverse) and rat FTO: 5′-ATGACGAGAACTTGGTGGA-3′ (forward),5′-GTATCGGGATCTCTGCCTT-3′(reverse). The sequences of primers of internal control were as follows: for human GAPDH:5′-GGAGCGAGATCCCTCCAAAAT-3′(forward), 5′-GGCTGTTGTCATACTTCTCATGG-3′ (reverse) and rat GAPDH:5′-ATGGCTACAGCAACAGGGT-3′(forward),5′-TTATGGGGTCTGGGATGG-3′(reverse).
Western blot
RIPA lysis buffer was used to extract the protein from rat ovarian tissue, or KGN and COV434 cells according to the manufacturer’s protocols. Whole protein was loaded onto 10% gels and then separated by SDS-PAGE gel and transferred to PVDF membranes. The membrane was blocked with 6% nonfat milk at room temperature for 1 h and then incubated primary antibody overnight at 4 °C. Membranes were then washed and subsequently incubated with the HRP-labeled secondary antibodies. The membrane was visualized using Super ECL Detection Reagent (Yeasen, China). The above primary antibodies were from anti-FTO (EPR24440-12, Abcam, USA; 1:1000 dilution), anti-CYP19A1 (bs-1292R, Bioss, China; 1:500 dilution), anti-CYP17A1(14447-1-AP, Proteintech, China; 1:1000 dilution), anti-CYP11A1(13363-1-AP, Proteintech, China; 1:1000 dilution), anti-HSD11B1(10928-1-AP, Proteintech, China; 1:1000 dilution), anti- prostate-specific antigen (PSA) antibody (5365, Cell signaling technology, USA; 1:1000 dilution), and anti-HSD3B2(67572-1-Ig, Proteintech, China; 1:1000 dilution), anti- androgen receptor (AR) (66747-1-Ig, Proteintech, China; 1:1000 dilution), anti-AKT(10176-2-AP, Proteintech, China; 1:1000 dilution), anti-P-AKT (4060, Cell signaling technology, USA; 1:1000 dilution), GAPDH (60004-1-Ig, Proteintech, China; 1:10000 dilution). The second antibodies goat anti-rabbit/mouse HRP conjugates IgG (H + L) were from Proteintech. Band intensity was analyzed using GraphPad Prism7 software.
Co-immunoprecipitation
Total protein was extracted from 2 × 10⁶ cell using RIPA lysis buffer with PMSF and Phosphatase inhibitor cocktail. ProteinA + G Agarose (P2055, Beyotime, China) was added to the total lysate for removing the nonspecific binding at 4 °C for 2 h. Then the lysate was immunoprecipitated with anti-FTO primary antibody (27226-1-AP, Proteintech, China), anti-AR primary antibody (5153, Cell signaling technology, USA) and anti-IgG HRP-linked Antibody (7074, Cell signaling technology, USA) diluted at 1:100 overnight at 4 °C. The immunoprecipitated protein was incubated with 40 μl protein A + G Agarose at 4 °C for 3 h, and then washed with PBS three times. Finally, the immunoprecipitated protein was detected by Western blotting and visualized in Chemiluminescence Imaging System.
Drug combination index
Cell survival was evaluated by Resazurin sodium salt assay according to the manufacturer instruction (#R8150, Solarbio, China). To detect the effect of meclofenamic acid (MA, FTO-specific inhibitor) on cell growth, 5 × 10³ KGN and COV434 cells were seeded and cultured in 96-well plates with MA at the indicated concentration. Further, for detecting the effect of combination of MA and LY294002 on cell growth, 5 × 10³ cells were seeded in 96-well culture plate and treated with chemicals as indicated for 48 h. The fluorescence values at 555 nm/585 nm were determined by microplate reader FlexStation III (Molecular Services, USA).
5-Ethynyl-2’-deoxyuridine (EdU) assays
Cell viability was determined by YF® Click-iT EdU Imaging Kit (UElandy, #C6015M, China), which measured the rate of DNA replication. The experiment was carried out according to the protocol. Briefly, 5 × 10³ KGN and COV434 cells were seeded and cultured in 96-well plate with MA and LY294002 at the indicated concentration for 48 h. Then, the cells were exposed to 10 uM EdU solution for 2h at 37 °C. After being fixed in 4% paraformaldehyde for 20 min at room temperature, the cells permeabilization with 0.5% Triton X-100 for 20 min at room temperature. Subsequently, the cells were incubated by 100 ul Click-iT working solution according to the instructions for 30 min at room temperature in the dark. After being washed with BSA and PBS, the cells were stained with 1 × Hoechst 33342 for 15 min at room temperature in the dark. Images were captured by the fluorescence microscope (Olympus, Japan). The ratio of EdU-stained cells (with green fluorescence) to Hoechst 33342-stained cells (with blue fluorescence) in three wells was used to calculate the percentage of EdU-positive cells.
Flow cytometry
Cell cycle was studied by Flow cytometry. 5 × 10⁵ KGN cells were seeded and cultured in six-well plate with MA and LY294002 at the indicated concentration for 48 h. The cells were harvested and fixed in 75% ethanol at 4 °C overnight. The cell suspension was transferred into a special tube for flow cytometry after cells were washed with PBS three times gently. KGN cells were stained in the dark with 100 μg/ml RNase, 0.2% triton X-100(Sangon, Shanghai, China) and 50 μg/ml PI solution (Sigma, USA) for 30 min. The cells were detected by BD LSRFortessa Flow Cytometer (BD Biosciences, Franklin Lake, NJ, USA) and the data were analyzed using FlowJo software (BD Biosciences, USA).
Statistical analysis
All the data were presented with mean ± standard deviation (SD) using GraphPad Prism 7.00 software (Chicago, IL, USA). Difference between any two preselected groups was analyzed using one-way ANOVA with Tukey’s test and two-tailed Student’s t-test. Pearson analysis was performed to show the correlation among FTO, m6A, and androgen level. Significance was identified as P value <.05 (*p < .05, **p < .01, ***p < .001).
Results
FTO expression was upregulated in human follicular fluid (FF) and granulosa cells (GCs) clinically
Firstly, we analyzed FTO expression in PCOS women patients clinically. A total of 31 women were included in this study, and the demographic and clinical characteristics are presented in . There were no statistical differences between the two groups in age, BMI, etc. The level of anti-Müllerian hormone (AMH) and basal luteinizing hormone (LH), the antral follicle count (AFC), and the number of retrieved oocytes were significantly higher in the PCOS group compared to that in the control group. The high level of AMH, LH, and the higher number AFC and retrieved oocytes were characterized in PCOS patients. The GCs derived from PCOS patients were identified with FSHR, the specific marker of GCs (). mRNA expression of FTO in the GCs of PCOS patients was significantly higher than that in the control group (p = .0332), while the m6A content in GCs of PCOS group was lower compared with the control group (0.05792 ± 0.01182 vs 0.07232 ± 0.01807, p = .0207) (). Correlation analysis showed FTO expression was negatively with the level of m6A content (Pearson R= −0.3863, p = .0465) (). Furthermore, we detected FTO and androgen secretion in FF of PCOS patients. Compared with the control group, the secretion level of FTO and androgen was significantly higher in the FF of PCOS patients (FTO secretion, 5.240 ± 1.319 vs 4.155 ± 1.28 pg/ml, p = .0243; androgen secretion, 1.180 ± 0.5978 vs 0.7835 ± 0.3506 ng/ml (mean ± SD), p = .0368). And androgen secretion was positively with the level of FTO (Pearson R = 0.5455, p = .0022) (). The clinical samples showed the expression of FTO was higher in PCOS patients, and correlated with m6A level and androgen concentration, respectively.
Figure 1. FTO expression was upregulated in human follicular fluid (FF) and granulosa cells (GCs) clinically. A FSHR expression in GCs of patients. B mRNA expression levels of FTO in GCs in PCOS and control (control, n = 16; PCOS, n = 15). m6A content in GCs in PCOS and control (control, n = 13; PCOS, n = 14). Correlation analysis between FTO and m6A level in GCs. C secretion levels of FTO (pg/ml) and androgen (ng/ml) in human FF of PCOS and control (control, n = 15; PCOS, n = 14). Correlation analysis between FTO and androgen concentration in FF (control, n = 15; PCOS, n = 14). Data are presented as the mean ± SD. *p < .05**p < .01***p < .001.
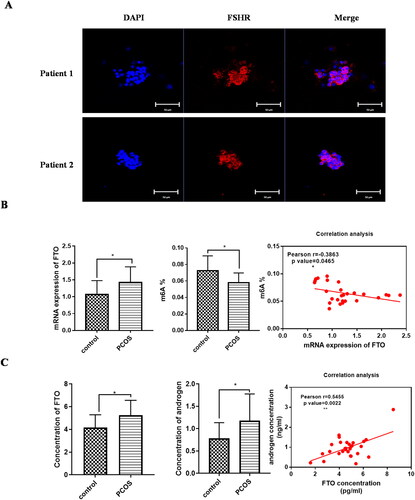
Table 1. Demographic and clinical characteristics of included patients.
FTO expression was increased in PCOS model in vivo and vitro
For further examination of FTO expression in PCOS, we established the PCOS rat model using subcutaneous injection of DHEA, as reported previously [Citation16]. With the DHEA injection, androgen, estrogen 2 and LH were increased in serum of the PCOS rat serum model, while FSH levels were similar to controls (). Compared with the control group, the number of corpus luteum in PCOS ovaries was decreased (p < .05), and the number of cystic follicle (Cys) was increased (p < .001) in DHEA treatment group (). These data showed that the rat group with DHEA treatment injection was identified as PCOS rat model. Compared with the control group, the FTO secretion was increased significantly in serum of the PCOS model rat (2.455 ± 0.5210 vs 1.845 ± 0.4244 ng/ml, p = .0286) (p = .0157) (). Similarly, the protein and mRNA expression of FTO was also increased (p = .0286) in ovarian tissue of PCOS model rat (), while the level of m6A was decreased (0.1567 ± 0.03072 vs 0.1857 ± 0.01625, p = .0331) (). Immunocytochemistry showed that the FTO protein was higher in PCOS model rat compared with the control group (p = .0267) (). The above findings confirmed FTO expression was upregulated in PCOS model in vivo. Moreover, upregulation of FTO expression was negatively associated with m6A level in PCOS rat model.
Figure 2. FTO expression was increased in PCOS model in vivo. A secretion levels of FTO and hormones in serum in PCOS rat and control (control, n = 8; PCOS, n = 8). B ovary sections stained by hematoxylin-eosin. The number analysis of cystic follicles (Cys) and corpora lutea (CL)in PCOS rat and control. C FTO protein level of the ovary of PCOS rat and control by Western blot, band intensity was calculated by Image J. D FTO mRNA expression in the ovary of PCOS rat and control. E the m6A content in the ovary of PCOS rat and control. F FTO protein level of the ovary of PCOS rat and control by immunocytochemistry. Scale bar, 500 μm. Average optical density (AOD) was analyzed by Image-pro plus. Data are presented as the mean ± SD. *p < .05, **p < .01, ***p < .001.
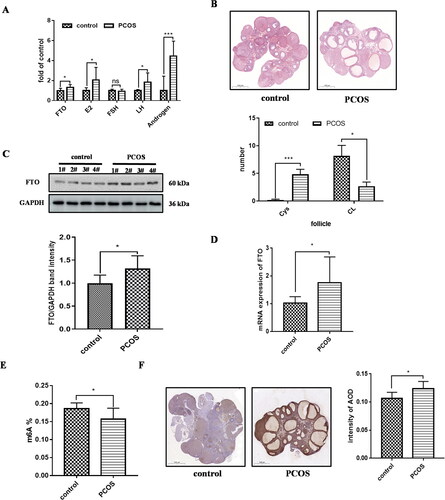
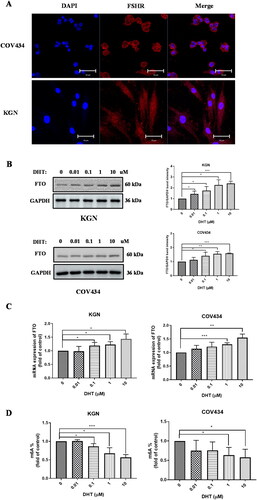
We also investigated the effect of the DHT stimulation on FTO expression in vitro. The identification of human ovarian GC line KGN and COV434 was performed by IF staining with anti-FSHR (). DHT stimulation increased protein and mRNA level of FTO expression (). m6A quantification in total RNA showed that DHT led to the notable reduction of m6A level in ovarian GC line cells (). In conclusion, DHT led to up-regulated FTO expression and downregulated m6A level in vitro.
Figure 3. FTO expression was increased exposed to DHT in GC line cells. A FSH receptor (FSHR) expression in GCs. B and C protein and mRNA level of FTO in GCs treated with a gradient of DHT, band intensity was calculated by Image J. D the m6A content in GCs treated with a gradient of DHT. All experiments were performed three times. Data are presented as the mean ± SD. *p < .05, **p < .01, ***p < .001.
Inhibition of FTO decreased steroid hormone synthetase and androgen receptor (AR) expression
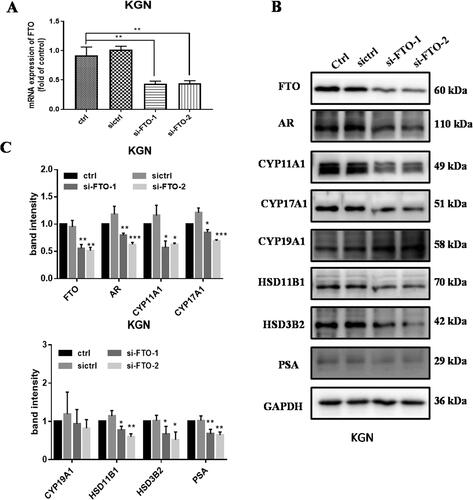
To investigate the functions of FTO in GCs, two small interference RNAs targeting FTO was constructed. Western blot and qRT-PCR showed that the mRNA and protein levels of FTO were downregulated significantly in KGN cells transfected with siRNA targeting FTO (). Importantly, the decrease of FTO expression suppressed the steroid hormone synthetase expression, such as CYP11A1, CYP17A1, HSD11B1, HSD3B2 except CYP19A1 synthetase. Furthermore, the protein levels of AR and PSA were also downregulated significantly due to the inhibition of FTO expression (). In summary, suppression of FTO attenuated the expression of steroid hormone synthetase, AR, and PSA.
Figure 4. Inhibition of FTO decreased steroid hormone synthetase and androgen receptor (AR) expression in GCs. A mRNA expression of FTO in KGN cells transfected with siRNA targeting FTO. B and C the effect of inhibition of FTO expression to steroid hormone synthetase and AR. Band intensity was calculated by Image J. All experiments were performed three times. Data are presented as the mean ± SD. *p < .05, **p < .01, ***p < .001.
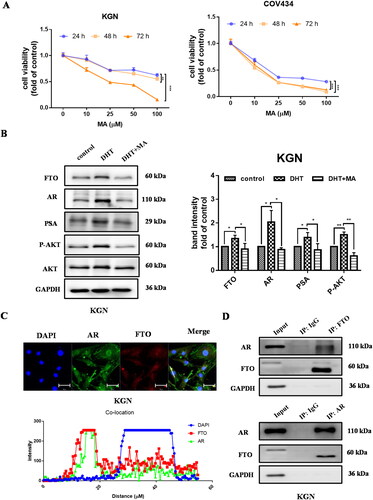
Inhibition of FTO decreased cell survival and AR/AKT signaling for improving hyperandrogenism of PCOS
To explore the role of FTO on GCs growth, MA treatment as the specific FTO antagonist was used to evaluate cell survival in KGN and COV434 cells. Resazurin sodium salt assay showed MA decreased cell survival as time- and dose-dependent way (). Mechanically, MA treatment decreased FTO expression induced by DHT stimulation. Correspondingly, the expression of AR and PSA was inhibited with MA treatment on the presence of DHT stimulation (). Additionally, AKT activation is favorable for GCs proliferation and anti-apoptosis [Citation17,Citation18]. Similarly, we found FTO inhibition by MA suppressed AKT phosphorylation in the presence of DHT stimulation (). To summarize the above results, we supposed the mechanism of FTO signaling was regulated by AR activation as a positive loop feedback way. Further, FTO is reported to be involved in the demethylation of RNA [Citation6,Citation19,Citation20], while AR signaling was regulated by FTO expression. We performed confocal microscopy to examine the potential relation of FTO and AR in GCs cells. The statistical histogram of co-localization analysis showed that FTO (red) and AR (green) exhibited significant co-localization with an overlap coefficient >0.6 with ZEN software in KGN cells (). FTO protein was co-immunoprecipitated with AR and vice versus (). These data suggested that upregulated FTO induced by AR activation facilitated AR-signaling pathway via the interaction of FTO and AR.
Figure 5. Inhibition of FTO decreased cell survival and AR/AKT signaling. A the effect of MA on cell survival. The cells were exposed to gradient MA for 24, 48 and 72h by Resazurin sodium salt assay. B the expression level of FTO, AR/PSA and P-AKT in KGN cells exposed to 1uM DHT with or without 50uM MA for 48h. Band intensity was calculated by Image J. C confocal microscopy analysis to detect the colocalization of FTO and AR in KGN cells. Red, FTO; green, AR; nucleus was stained by DAPI. Scale bar, 20 μm. The plot profile of fluorescence intensity was used to show the overlap of the FTO and AR. Overlap coefficient (OC) was >0.6 as the indication colocalization. D Co-immunoprecipitation assay by the antibody of FTO or AR to show FTO-AR interaction in KGN cell lines.
Combination of MA with AKT inhibitor LY294002 synergistically inhibited GCs cell survival through the induce of cell cycle arrest
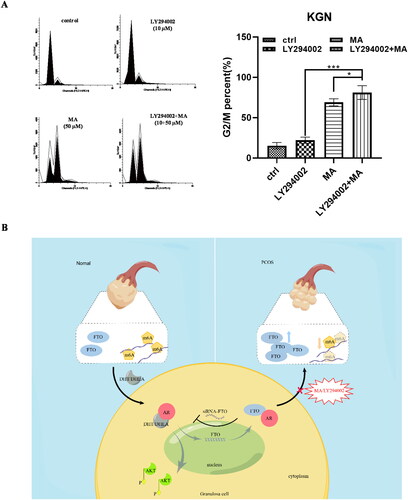
Based on the necessary role of activity of AKT and FTO in PCOS progression, we further detected the effect of combined MA with LY294002 known as the AKT inhibitor on cell growth in GCs cells. Microscopy assay performed the inhibitory effect of a single dose of MA with or without LY294002 treatment in GCs cells. Compared with LY294002 or MA alone, a significant reduction in the number of EdU-positive cells with MA treatment was visualized synergistically in the GCs cells in the presence of LY294002 (). By cell viability assay we demonstrated that non-continuous MA potentiated the inhibitory effect of LY294002. The combinational effect of MA with LY29004 by Chou–Talalay algorithms calculation with Compusyn software. The isobologram analyses indicated that all the points were below the line of additive effects; the fraction-effect (FA) versus combination index (CI) analysis also demonstrated that MA synergistically enhanced the growth inhibition induced by LY294002 in COV434 and KGN cells (). We also explored the influence of the combination of 50 μM MA and 10 μM LY294002 on cell cycle. Cells were treated with MA and LY294002 for 48h and stained with PI for FACS analysis. What’s interesting is that the combination of MA and LY294002 notably increased the ratio of cells at G2/M phase (). We confirmed that there is an approach for inhibiting the cell growth of GC cells featured with hyperandrogenism of PCOS by combination inhibitors MA and LY294002.
Figure 6. Combination of MA with LY294002 synergistically inhibited GCs line cell survival. A cell survival of GCs cells treated with MA in the presence or absence of LY294002 for 48 h using EdU analysis. B-D cell survival of GCs cells treated with MA and LY294002 at indicated concentrations. FA-CI and isobologram analysis for MA and LY294002 combinations was plotted and calculated with Chou–Talalay algorithms. CI < 1, synergism; CI = 1, additive; CI > 1, antagonism. Isobologram analysis represents the synergism of a combination of MA with LY294002. Data were shown as mean ± SD from three independent experiments, and cells in three random fields were analyzed. *p < .05, **p < .01, ***p < .001.
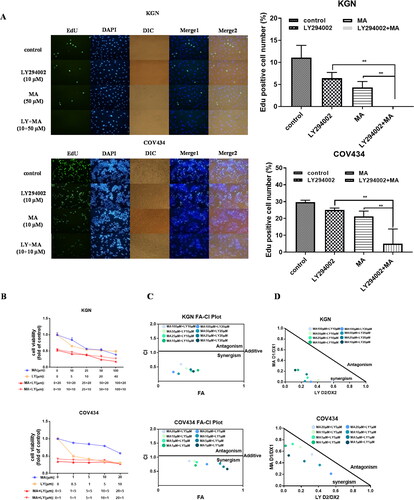
Figure 7. A FACS analysis of cell cycle in KGN cells. The cells were treated with LY29004(10 μM), MA (50 μM), combined MA with LY294002 for 48 h. Untreated cells were used as control. B working model (by figdraw ID: YSPWRbd849). FTO upregulation stimulated by AR activation promoted hyperandrogenism of PCOS. FTO inhibition showed the ability of blocking hyperandrogenism progression and cell proliferation by impeding AR-AKT signaling axis of GCs.
Discussion
Hyperandrogenism of PCOS is a complex endocrine and metabolic disease, with a variety of hormone disorders in patients featured as insulin resistance, obesity, and diagnosed in Rotterdam criteria at percentage of 67.5% to 90% [Citation21]. FTO was reported to be an effector on the molecular mechanism of abnormal m6A-related PCOS diseases, facilitating cell proliferation and insulin resistance by stabilizing the mRNA of FLOT2 [Citation22]. But there still was clarified little underlying role of FTO in hyperandrogenism process of PCOS. Here, we confirmed FTO as a potential driver for therapy strategy to hyperandrogenism of PCOS. AR activation stimulated FTO upregulation, contributing the expression of steroid hormone synthetase and AR/PSA which further promoted hyperandrogenism of PCOS in vitro. Notably, FTO inhibition would show abilities to block hyperandrogenism progression and cell proliferation by impeding AR-AKT signaling axis of GCs cells ().
AR signaling in GC cells with as high androgen from the FF-related microenvironment has shown the potential to promote ovarian follicle growth in the progression of chronic hyperandrogenism. Clinically, androgen expression and secretion in FF from the PCOS patients were higher than normal groups, which was agreed with previous studies [Citation23,Citation24]. We first demonstrated that upregulated FTO was positively associated with androgen in PCOS patients. Furthermore, mRNA expression level of FTO was increased, and negatively correlated with the level of m6A in GCs featured positive FSHR expression of PCOS patients. Female rat injected with DHEA for 21 days were confirmed as PCOS model. Compared with the control group, serum secretion and expression of FTO showed the significant increase in the PCOS rat model with hyperandrogenism, accompanied with a decrease of m6A level in ovarian tissue. These findings showed that FTO overexpression and m6A content decreased in the hyperandrogenism PCOS rat model revealing that the abnormality of m6A demethylation modification mediated by FTO was related to the hyperandrogenism of PCOS patients.
Androgen positively regulates the expression of FTO in GC cells in vitro. AR activated with DHT stimulated FTO expression associated with lower levels of m6A in a dose-dependent way. PCOS patients have overexpression of CYP11A1 and CYP17A1 which were responsible for androgen synthesis [Citation24–26], both of them can lead to increased androgen. And PCOS women had significantly higher levels of HSD3B2 and higher expression of HSD11B1 [Citation24,Citation27], which closely related to androgen production and conversion. By inhibiting HSD3B2 and CYP17A1-17,20 lyase activities, androgen production from steroid cells had reduced [Citation28]. Our study showed that down-regulated FTO resulted in significantly decreased expression of CYP11A1, CYP17A1, HSD3B2 and HSD11B1. The expression of CYP19A1 in PCOS patients is complicated, and there are inconsistent or even opposite conclusions [Citation26,Citation29–31]. The different results may be related to the different sample size and composition of the studied population. The downregulated expression of FTO was only manifested as a decreasing trend in the expression of CYP19A1, and it was no significant difference. Decreased FTO expression significantly reduced the several steroid hormone synthetase, which is related to androgen production. But knockdown FTO had no significant effect on CYP19A1, which is related to the conversion of androgens to estrogens. That is, downregulation of FTO ultimately reduced the level of androgen. It meant the possibility of alleviating androgen excess by affecting FTO expression in PCOS patients. . The serum PSA level of PCOS patients is significantly higher than normal [Citation32,], and it is significantly positively correlated with testosterone and free androgen index [Citation33,]. FTO knockdown in KGN cells resulted in significantly lower expression of AR and PSA, indicating that silence FTO has the possibility of reducing androgen biological effects and thus relieving the clinical symptoms of hyperandrogenic in PCOS. AR as a member of steroid hormone receptor family was expressed abnormally in PCOS patients with endometrial dysfunction [Citation34]. AR promoted PCOS progression through interaction between AR with the other key genes, such as FHL2, TGFβ [Citation35,Citation36], indicating the importance of AR role during PCOS development. The increase of AR coactivators, expression and amplification of AR was also proved in the endometrium of PCOS patients [Citation37]. Furthermore, AR known as nucleus transcription factor was co-localized with FTO and there was the physiological interaction between them in GC line cell, suggesting FTO maybe involve AR function of transcription through protein–protein interaction. But AR transcription regulation assisted by FTO is still needs further exploration.
Inhibition of FTO with FTO-specific inhibitor MA significantly decreased GC line cell growth and reversed the elevation of AR and PSA expression induced by DHT. Furthermore, FTO inhibition suppressed AKT phosphorylation with DHT treatment. The combination of MA and LY294002 was identified a notable approach for attenuating hyperandrogenism, and inhibiting cell growth. Collectively, these data suggested that antagonism of FTO alone or in combination with AKT inhibitor would be feasible and effective in PCOS treatment.
Conclusions
In summary, FTO expression was found to be significantly upregulated in PCOS patients, and it was positively correlated with androgen and negatively correlated with m6A. The rat model with DHEA confirmed that in hyperandrogenism PCOS disease model, FTO was highly expressed in serum and ovarian tissue, while m6A level was decreased. Cell experiments demonstrated that DHT promoted the expression of FTO, and knockdown of FTO also affected the expression of steroid hormone synthetase and the biological activity of androgen. FTO was co-localized with AR and the physiological interaction between them in vitro. Inhibition of FTO decreased cell survival and AR/AKT signaling for improving hyperandrogenism of PCOS. Our study explored the mechanism of m6A demethylases FTO in hyperandrogenism PCOS progression, given a new theoretical basis for the clinical diagnosis and treatment of PCOS.
Ethics approval
This study was approved by the ethics commissions of the First Hospital of Lanzhou University (No. LDYYSZLL2022-07) (No. LDYYLL-2022-424). The procedures used in this study adhere to the tenets of the Declaration of Helsinki.
Consent to participate
All patients agreed to donate their follicular fluid and signed informed consent.
Author contributions
Project development: Yuan-Xue Jing, Hong-Xing Li, Xue-Hong Zhang; Administrative support: Xue-Hong Zhang; Data collection: Yuan-Xue Jing, Feng Yue; Data analysis: Yuan-Xue Jing, Yan-Mei Li, Xiao Yu; Manuscript writing and editing: Yuan-Xue Jing, Jia-Jing He, Xue-Hong Zhang; Final approval of manuscript: All authors.
Data and/or code availability
Data and/or codes are available from the corresponding author upon request.
| Abbreviations | ||
| AMH | = | anti-Müllerian hormone |
| FTO | = | Fat mass and obesity-associated protein |
| FF | = | Follicular fluid |
| FSH | = | Follicle-stimulating hormone |
| AFC | = | Antral follicle count |
| AR | = | androgen receptor |
| DHEA | = | Dehydroepiandrosterone |
| DHT | = | Dihydrotestosterone |
| GCs | = | Granulosa cells |
| LH | = | Luteinizing hormone |
| MA | = | Meclofenamic acid |
| m6A | = | N6-methyladenosine |
| PCOS | = | polycystic ovary syndrome |
| PSA | = | prostate-specific antigen |
Acknowledgments
We thank Xiao-Wei Zhang for her language editing assistance.
Disclosure statement
No potential conflict of interest was reported by the authors.
Additional information
Funding
References
- Bozdag G, Mumusoglu S, Zengin D, et al. The prevalence and phenotypic features of polycystic ovary syndrome: a systematic review and meta-analysis. Hum Reprod. 2016;31(12):1–14. doi: 10.1093/humrep/dew218.
- Neven A, Laven J, Teede H, et al. A summary on polycystic ovary syndrome: diagnostic criteria, prevalence, clinical manifestations, and management according to the latest international guidelines. Semin Reprod Med. 2018;36(1):5–12. doi: 10.1055/s-0038-1668085.
- Teede H, Misso M, Costello M, et al. Recommendations from the international evidence-based guideline for the assessment and management of polycystic ovary syndrome. Hum Reprod. 2018;33(9):1602–1618. doi: 10.1093/humrep/dey256.
- Glueck C, Goldenberg N. Characteristics of obesity in polycystic ovary syndrome: etiology, treatment, and genetics. Metabolism. 2019;92:108–120. doi: 10.1016/j.metabol.2018.11.002.
- Azziz R, Carmina E, Dewailly D, et al. The androgen excess and PCOS society criteria for the polycystic ovary syndrome: the complete task force report. Fertil Steril. 2009;91(2):456–488. doi: 10.1016/j.fertnstert.2008.06.035.
- Jia G, Fu Y, Zhao X, et al. N6-methyladenosine in nuclear RNA is a major substrate of the obesity-associated FTO. Nat Chem Biol. 2011;7(12):885–887. doi: 10.1038/nchembio.687.
- Loos R, Yeo G. The bigger picture of FTO: the first GWAS-identified obesity gene. Nat Rev Endocrinol. 2014;10(1):51–61. doi: 10.1038/nrendo.2013.227.
- Liu C, Mou S, Pan C. The FTO gene rs9939609 polymorphism predicts risk of cardiovascular disease: a systematic review and meta-analysis. PLoS One. 2013;8(8):e71901. doi: 10.1371/journal.pone.0071901.
- Yang Y, Shen F, Huang W, et al. Glucose is involved in the dynamic regulation of m6A in patients with type 2 diabetes. J Clin Endocrinol Metab. 2019;104(3):665–673. doi: 10.1210/jc.2018-00619.
- Sun X, Zhang Y, Hu Y, et al. Decreased expression of m6A demethylase FTO in ovarian aging. Arch Gynecol Obstet. 2021;303(5):1363–1369. doi: 10.1007/s00404-020-05895-7.
- Jiang Z, Wang Y, Li Z, et al. The m6A mRNA demethylase FTO in granulosa cells retards FOS-dependent ovarian aging. Cell Death Dis. 2021;12(8):744. doi: 10.1038/s41419-021-04016-9.
- Liu A, Xie H, Xie H, et al. Association between fat mass and obesity associated (FTO) gene rs9939609 a/T polymorphism and polycystic ovary syndrome: a systematic review and meta-analysis. BMC Med Genet. 2017;18(1):89. doi: 10.1186/s12881-017-0452-1.
- Wang X, Wang K, Yan J, et al. A meta-analysis on associations of FTO, MTHFR and TCF7L2 polymorphisms with polycystic ovary syndrome. Genomics. 2020;112(2):1516–1521. doi: 10.1016/j.ygeno.2019.08.023.
- Tan S, Scherag A, Janssen O, et al. Large effects on body mass index and insulin resistance of fat mass and obesity associated gene (FTO) variants in patients with polycystic ovary syndrome (PCOS). BMC Med Genet. 2010;11(1):12. doi: 10.1186/1471-2350-11-12.
- Kowalska I, Malecki M, Straczkowski M, et al. The FTO gene modifies weight, fat mass and insulin sensitivity in women with polycystic ovary syndrome, where its role may be larger than in other phenotypes. Diabetes Metab. 2009;35(4):328–331. doi: 10.1016/j.diabet.2009.03.004.
- Di Pietro M, Parborell F, Irusta G, et al. Metformin regulates ovarian angiogenesis and follicular development in a female polycystic ovary syndrome rat model. Endocrinology. 2015;156(4):1453–1463. doi: 10.1210/en.2014-1765.
- Andrade G, da Silveira J, Perrini C, et al. The role of the PI3K-Akt signaling pathway in the developmental competence of bovine oocytes. PLoS One. 2017;12(9):e0185045. doi: 10.1371/journal.pone.0185045.
- Shen M, Jiang Y, Guan Z, et al. Protective mechanism of FSH against oxidative damage in mouse ovarian granulosa cells by repressing autophagy. Autophagy. 2017;13(8):1364–1385. doi: 10.1080/15548627.2017.1327941.
- Shi H, Wei J, He C. Where, when, and how: context-dependent functions of RNA methylation writers, readers, and erasers. Mol Cell. 2019;74(4):640–650. doi: 10.1016/j.molcel.2019.04.025.
- Wei J, Liu F, Lu Z, et al. Differential m6A, m6Am, and m1A demethylation mediated by FTO in the cell nucleus and cytoplasm. Mol Cell. 2018;71(6):973–985.e975. doi: 10.1016/j.molcel.2018.08.011.
- Lizneva D, Suturina L, Walker W, et al. Criteria, prevalence, and phenotypes of polycystic ovary syndrome. Fertil Steril. 2016;106(1):6–15. doi: 10.1016/j.fertnstert.2016.05.003.
- Zhou L, Han X, Li W, et al. N6-methyladenosine demethylase FTO induces the dysfunctions of ovarian granulosa cells by upregulating flotillin 2. Reprod Sci. 2022;29(4):1305–1315. doi: 10.1007/s43032-021-00664-6.
- Naessen T, Kushnir M, Chaika A, et al. Steroid profiles in ovarian follicular fluid in women with and without polycystic ovary syndrome, analyzed by liquid chromatography-tandem mass spectrometry. Fertil Steril. 2010;94(6):2228–2233. doi: 10.1016/j.fertnstert.2009.12.081.
- Yang Z, Zhou W, Zhou C, et al. Steroid metabolome profiling of follicular fluid in normo- and hyperandrogenic women with polycystic ovary syndrome. J Steroid Biochem Mol Biol. 2021;206:105806. doi: 10.1016/j.jsbmb.2020.105806.
- Motahari Rad H, Mowla S, Ramazanali F, et al. Characterization of altered microRNAs related to different phenotypes of polycystic ovarian syndrome (PCOS) in serum, follicular fluid, and cumulus cells. Taiwan J Obstet Gynecol. 2022;61(5):768–779. doi: 10.1016/j.tjog.2022.05.013.
- Yu L, Liu M, Wang Z, et al. Correlation between steroid levels in follicular fluid and hormone synthesis related substances in its exosomes and embryo quality in patients with polycystic ovary syndrome. Reprod Biol Endocrinol. 2021;19(1):74. doi: 10.1186/s12958-021-00749-6.
- Svendsen P, Madsbad S, Nilas L, et al. Expression of 11beta-hydroxysteroid dehydrogenase 1 and 2 in subcutaneous adipose tissue of lean and obese women with and without polycystic ovary syndrome. Int J Obes (Lond). 2009;33(11):1249–1256. doi: 10.1038/ijo.2009.165.
- Magyar B, Santi M, Sommer G, et al. Short-Term fasting attenuates overall steroid hormone biosynthesis in healthy young women. J Endocr Soc. 2022;6(7):bvac075.
- Huang X, Wu B, Chen M, et al. Depletion of exosomal circLDLR in follicle fluid derepresses miR-1294 function and inhibits estradiol production via CYP19A1 in polycystic ovary syndrome. Aging (Albany NY). 2020;12(15):15414–15435. doi: 10.18632/aging.103602.
- Panghiyangani, Roselina, Soeharso, Purnomo, Suryandari, Dwi Anita, et al. CYP19A1 gene expression in patients with polycystic ovarian syndrome. J Hum Reprod Sci 2020; 13(2):100–103. doi: 10.4103/jhrs.JHRS_142_18.
- Emami N, Moini A, Yaghmaei P, et al. Differences in expression of genes related to steroidgenesis in abdominal subcutaneous adipose tissue of pregnant women with and without PCOS; a case control study. BMC Pregnancy Childbirth. 2021;21(1):490. doi: 10.1186/s12884-021-03957-5.
- Wang Y, Ma X, Luo J, et al. Expression of serum PSA, nesfatin-1, and AMH in patients with polycystic ovary syndrome. Cell Mol Biol (Noisy-le-Grand). 2022;67(5):57–63. doi: 10.14715/cmb/2021.67.5.8.
- Rudnicka E, Radowicki S, Suchta K. Prostate specific antigen (PSA) in diagnosis of polycystic ovarian syndrome - a new insight. Gynecol Endocrinol. 2016;32(11):931–935. doi: 10.1080/09513590.2016.1200552.
- Wang T, Zhang J, Hu M, et al. In vivo differential expression patterns of glycolytic enzymes and mitochondria-dependent apoptosis in PCOS patients with endometrial hyperplasia, an early hallmark of endometrial cancer, and the impact of metformin. Int J Biol Sci. 2019;15(3):714–725. doi: 10.7150/ijbs.31425.
- Zhou R, Li S, Liu J, et al. Up-regulated FHL2 inhibits ovulation through interacting with androgen receptor and ERK1/2 in polycystic ovary syndrome. EBioMedicine. 2020;52:102635. doi: 10.1016/j.ebiom.2020.102635.
- Azumah R, Liu M, Hummitzsch K, et al. Candidate genes for polycystic ovary syndrome are regulated by TGFβ in the bovine foetal ovary. Hum Reprod. 2022;37(6):1244–1254. doi: 10.1093/humrep/deac049.
- Palomba S, Piltonen T, Giudice L. Endometrial function in women with polycystic ovary syndrome: a comprehensive review. Hum Reprod Update. 2021;27(3):584–618. doi: 10.1093/humupd/dmaa051.