
Abstract
We have evaluated a commercial-fixed porcine platelet preparation (with and without added fixed human red blood cells (RBC)) for the potential standardization of mean platelet volume (MPV) measurements. The standards (Biotechne) were distributed internationally to 19 laboratories including all major hematology instrument manufacturers and academic/pathology laboratories. Overall, the standards demonstrated excellent stability up to 1 month within both MPV values and platelet counts when stored at 4°C. The presence of RBC significantly increased the platelet count and MPV values compared to platelets alone. However, as expected, there were differences in MPV values between different instruments and manufacturers. MPV values were also significantly higher in the whole blood standard compared to the platelet standard in the majority of instruments except with some instruments, where MPV values were significantly higher in the platelet only preparation. To further investigate this phenomenon, two different Platelet MPV preparations (with low and high MPV) in combination with 3 different RBC MCV preparations (with low, normal or high MCVs) were tested to try and further elucidate how RBC populations may impact upon platelet analysis (count, MPV, and PDW) using a single impedance analyzer. Both MPV and MCV values showed good stability over the course of the study for up to 50 days. As expected, the RBC preparation with the lowest MCV had the greatest impact on the MPV. However, this was not observed with an increase in MCV of the RBC or by a larger MPV of the platelet population. To further understand how different gating strategies may also influence results, we investigated the effect of either fixed or floating gate strategies upon MPV raw data from patient samples in a single impedance analyzer. Overall, it was clear that floating and fixed gate strategies also significantly impact upon MPV values. In conclusion, we have demonstrated the potential of an MPV standard with good stability characteristics for calibrating and comparing full blood counters that use different analysis principles, gating and MPV calculations. This may facilitate future instrument calibration and harmonization of results between different technologies.
Introduction
In the 1950s, the discovery of the “Coulter” aperture impedance principle revolutionized particle counting and led to the invention of automated blood counters [Citation1,Citation2]. Hematology laboratories could soon produce blood counts very efficiently with improved accuracy and precision [Citation3,Citation4]. Hydrodynamic focusing coupled with the use of pulse shape analysis eventually enabled platelet measurements to also be performed in whole blood samples. The evolution of modern full blood counters is still continuing and the full blood count including red blood cell (RBC) and platelet counts remains the most commonly used pathology test [Citation5–7]. Mean platelet volume (MPV) and RBC mean cell volume (MCV) therefore became additional parameters of interest to both clinicians and researchers and are routinely available within most modern analyzers. Changes in MPV and MCV are usually associated with thrombocytopenia [Citation8,Citation9] and anemia, respectively [Citation10]. Instrument calibration for MPV is independent of their calibration for MCV and is most often established with a suspension of various size latex beads. However, unlike MCV [Citation11], MPV analysis is still not subject to specific calibration and standardization guidelines. MPV normal values therefore can vary widely between 6.0 and 13.2 fL [Citation12,Citation13].
Some alternative technologies can also measure cell size and MPV using flow cytometry optical principles (i.e. light scatter) and more recently image analysis of blood films [Citation5,Citation14]. A normal MPV impedance distribution gives a classical log-normal distribution and clearly demonstrates heterogeneity in the normal platelet volume distribution [Citation15]. There is also a classical inverse relationship between platelet count and MPV, with the total platelet mass remaining fairly constant under normal conditions [Citation16]. Abnormalities in platelet size by measuring MPV are therefore useful for studying and differentiating between inherited forms of macro-thrombocytopenia and giant platelet syndromes from other inherited conditions and acquired thrombocytopenia [Citation8,Citation17]. However, inaccuracies in both platelet counts and MPV often occur when there is significant overlap between large platelets (e.g. in macro-thrombocytopenia) and normal or small RBC, that is, microcytes (e.g. in thalassemia) and normal platelets [Citation18,Citation19]. This highlights the problem with essentially a one-dimensional impedance analysis that cannot discriminate between different cells or particles of the same volume. Despite this, any detected abnormalities within the platelet distribution can also be used to automatically flag for sample aggregates, thrombocytopenia, abnormal size distributions, microcytes, RBC fragments, and so on. In contrast, technologies that use multidimensional optical analysis with low angle and high scattered light can theoretically improve the resolution of the platelet population from microcytes and cellular debris/fragments. Advia instruments (Siemens) measure scattered light between 2–3° and 5–15° [Citation20,Citation21]. In contrast, the CELL-DYN Sapphire® (Abbott Diagnostics) measure scattered light at 7° and 90° and the Alinity Hq® (Abbott) uses multiple angles (six light detectors), respectively [Citation7,Citation22]. More recently, digital imaging of blood films has been introduced (Cobas m511, Roche Diagnostics) and both cell counts and volumes can be determined [Citation14]. MPV and MCV measurements are performed by high magnification imaging of light absorption (with 4 different wavelengths) at hundreds of points to measure the height of the cells on the film and by converting this to a volume. Individual volumes are then averaged to obtain the volumes from thousands of cells [Citation23].
As MPV measurements are cheap, easily and rapidly obtained as part of the routine normal full blood count, there are also multiple reports on changes in MPV in a variety of pathological and inflammatory conditions [Citation8,Citation24]. An editorial in 2014 by Lippi stated that “It is now undeniable that the assessment of platelet size should be regarded as a valuable tool for diagnosis and therapeutic monitoring of a wide spectrum of arterial and venous disorders” [Citation25]. However, it is also well known that the interpretation of MPV studies still requires some caution when one considers the importance of pre-analytical and analytical variables. The dynamic range of MPV is also narrow and, outside of macro-thrombocytopenia and large platelet syndromes, observed differences between clinical cohorts are often small and patients can typically have MPV values that are still close to or within the normal range [Citation8,Citation12]. Small differences between patients and controls can therefore be easily caused by inadequate standardization of measurements. Pre-analytical variables, such as the anticoagulant used, and the time between blood collection and measurement are well known to significantly affect MPV measurements [Citation26–28]. Although EDTA is traditionally used and recommended for samples destined for blood counting, platelets collected into EDTA anticoagulants undergo time-dependent platelet swelling and activation [Citation28,Citation29]. It is therefore critical that in studies where EDTA is the anticoagulant, the time delay between sampling and analysis is standardized between the controls and test samples so that accurate comparisons can be made. Alternative anticoagulants can also be used (e.g. citrate) to minimize and prevent time-dependent swelling [Citation30–32]. Even after adequately controlling for pre-analytical variables, there are still significant differences in MPV values produced by different full blood counters, especially between those from different manufacturers using different measurement principles [Citation33–35]. These studies therefore highlight the lack of harmonization between different instruments and technologies. Current manufacturers not only can use a variety of methods to determine MPV (e.g. impedance, optical and imaging) but there are also differences in platelet population gating/discriminator strategies (e.g. fixed or floating gates) determining either the lower and/or upper cutoffs of the platelet size distribution that is analyzed [Citation28]. For example, floating gates often find the nadir MPV value between the platelet and red cell distributions and use this for their upper platelet size cutoff [Citation34]. Some manufacturers also log transform their data to normalize the platelet distribution and then use the arithmetic mean to calculate the MPV but still using appropriate lower and upper discriminators [Citation34]. Recently, an editorial in “Platelets” has highlighted many of these issues and made a series of recommendations for future studies and manuscripts where the major focus is MPV [Citation12].
Although, platelet-counting measurements normally perform well in both internal and external quality control (QC) schemes, no suitable standards or QC materials for MPV are currently available. Unlike with the ICSH reference method for platelet counting [Citation36,Citation37], there is also no gold standard reference method currently available for measuring MPV. This makes inter-study comparisons particularly between different technologies. The availability of standards with a range of known MPV values would therefore be of enormous value to the field for not only calibrating MPV but also for helping accurately define both within and between instrument variation and thereby providing more confidence in the reliability of MPV measurements. The ultimate goal would be the future harmonization of MPV measurements [Citation28,Citation33]. In this study, we therefore report the results of the first international inter-laboratory study of some commercially manufactured MPV platelet preparations (Biotechne, Minneapolis, MN, USA) prepared from fixed Platelet Rich Plasma (PRP) in the presence and absence of fixed RBC. The goal of this study was to determine whether these standards are potentially useful as a tool for standardizing MPV and to study their stability and variation both within and between all the currently available hematology analyzers. Secondary outcomes were to investigate the impact of different technologies, gating strategies and any key variables upon reported MPV values.
Materials and methods
MPV standards
In 2017, MPV standards were kindly prepared by Biotechne (Minneapolis, MN, USA). Platelets were isolated from porcine whole blood by conventional low g centrifugation to remove red and white cells. Blood was collected in anticoagulants from multiple healthy human adult male and female donors (>17 years old) that were screened for viruses. Red cells were isolated by high g centrifugation to remove white cells and platelets in the buffy coat. After washing, both preparations were stored in a plasma analog composed of a mixture of sugars, buffer salts and antimicrobial compounds to maintain normal pH and osmolality. When processed and stored as intended, these platelets and RBC maintain their size and numbers and provide a suitable standard with appropriate physical properties similar to a fresh normal sample from human patients. Batches comprised of 3 ml aliquots of a platelet-only MPV standard (P170601, containing fixed normal porcine platelets from PRP, expiry 5/10/2017) and a fixed whole blood MPV standard (containing the above fixed normal porcine PRP mixed with fixed normal human red cells) (RP170601 expiry 5/10/2017) were prepared. Further, quality control materials consisting of human red cells with different MCV values (low, normal, and high) were prepared at a final concentration of 4 x 10¹²/L and a porcine platelet standard (low and high MPV) at a final concentration of 250 × 109 cells/L. The Human blood MCV levels were selected from pools of packed red cells that were screened for red cell volume. All these preparations were then tested within one instrument within Biotechne’s laboratory (CELL-DYN Sapphire, Abbott Diagnostics) at regular intervals to assess long-term stability.
Participants and analyzers
The MPV standards were distributed in cold-packs to a total of 19 international laboratories including a mixture of hospital and academic laboratories and tested on 24 instruments from 7 of the major hematology instrument manufacturers (e.g. Abbott Diagnostics, Beckman Coulter, Horiba, Mindray, Roche, Siemens and Sysmex Corporation).
Study design
The platelet and whole-blood MPV standards were distributed at 4°C to all participants by courier for analysis. On arrival at participating laboratories, standards were stored at 4°C for up to 1 month. Prior to the analysis the standards were warmed up to ambient room temperature for at least 15 minutes and samples mixed to ensure homogeneity (using at least 6 full gentle inversions). Sequential analysis was then performed (N = 5) within all full blood counters on day 1, day 14 and day 28. Usual internal quality control procedures were performed in each laboratory and any potential carry over from previous samples avoided. The 5 RBC counts, MCVs, platelet counts and MPVs (instrument used, with dates and times) were recorded for each sample time point on each instrument. After the last analysis was complete, all data was sent to the study coordinator for data analysis.
Influence of the MCV on the MPV
Based upon the results of the above described study, a subsequent study was designed to evaluate two different platelet MPV preparations in combination with the three different RBC MCV preparations using either a low, normal or high MCV with the aim of understanding how different RBC populations could potentially impact upon the platelet distribution, count and MPV.
Influence of different gating strategies (fixed versus floating) on the MPV
In order to further understand the influence of different gating strategies on the MPV values, a series of pathological samples were tested within a single instrument (Mindray, BC6800). The upper range of the floating gate is between 15 and 31 fl. Samples included patients classified as normal (N = 3, mean platelet count = 187), thrombocytopenia (N = 2, mean platelet count = 14) and thrombocytosis (N = 2, mean platelet count = 1280). Some samples were flagged for the presence of red cell fragments (N = 3, mean platelet count = 182), large platelets (N = 2, mean platelet count = 46), microcytosis (N = 2, mean platelet count = 432), macrocytosis (N = 2, mean platelet count = 209) and platelet clumping (N = 2, mean platelet count = 121). The instrument MPV values were recorded, and all platelet distribution plots and ungated raw impedance data files were sent to the University of Birmingham for further analysis. The impedance data is composed of 64 channels within each platelet histogram, representing a total of 40 fL. Each channel number from 1 to 64 were therefore converted to 0.625–40fL through multiplication of each channel number by 0.625. The impact of using the application of either fixed (lower cutoff of 2 fL and a higher cutoff of 25 fL) or floating gating strategies (fixed lower cutoff of 2 fL and a higher cutoff using the nadir or lowest MPV value between the platelet and red cell distributions) were then studied on the calculation of the MPV values and compared to the recorded instrument values (using an upper floating gate strategy).
Statistical analysis
Statistical analysis was performed in RStudio. Friedman tests were used for the comparison of more than two groups. Where significant, Wilcoxon signed rank post-hoc tests were performed with Holm-Bonferroni correction for multiple group comparisons. Where two groups were compared, Wilcoxon signed rank tests were performed.
Results
Baseline quality control of the PRP and whole blood standards
After optimization and their manufacture, Biotechne performed quality control testing of the batches of PRP and Whole Blood Standards to be distributed in this study. Standards were tested on a range of commercial analyzers in their laboratory and the results are summarized in . The mean values of MPV (7.5 fL) were identical within both standards despite a slight increase in the mean platelet count in the whole blood standard. The results also confirm that platelet counts and MPV values can vary across different analytical platforms.
Table I. Summary of Platelet Counts (x 109/L) and MPV (fL) values in the MPV Platelet and Whole Blood Standards performed on a range of different hematology instruments at Biotechne.
Study data from all laboratories/manufacturers
shows a summary of all Cell Counts and volumes collected from the entire study at the 3 different time points (days 1, 14 and 28). The MPV data from the platelet standard and whole-blood standard show no significant change (p > 0.05, Friedman test) over 28 days () show the difference between the MPV and platelet counts in the standards with and without RBC. The data clearly shows how the presence of RBC in the whole blood standard not only increased the platelet count but also increased the MPV values as well when compared to the platelet-only standard alone. Overall median MPV values (without and with RBC respectively) were 7.5 and 7.86 (p = 0.0011, Wilcoxon ranked sign test) at day 1, 7.63 and 7.93 (p = 0.0055) at day 14 and finally 7.54 and 7.85 fL (p = 0.023) at day 28. a nd 1F show a summary of all the RBC and MCV data (days 1, 14 and 28) from the whole blood standard. Overall, RBC and MCV values were stable for at least 1 month (except the MCV at 28 days that was significantly higher than day 1, p = 0.013, Wilcoxon ranked signed test) under the storage conditions used in the whole blood preparations. show the intra- and inter-assay coefficient of variation of the repeat samples measured with all analyzers showing good precision within the majority of analyzers across all time points.
Figure 1. Summary of the Platelet Counts and MPV values of the standards collected from the entire study at Day 1, Day 14 and Day 28 post-receipt. The platelet standard (blue) and whole blood standard (red) MPV in all instruments used in this study are shown in Figures 1A and 1B (MPV) respectively and do not significantly change over time (Wilcoxon signed rank test). Figures 1C and 1D show significant differences in median MPV and platelet counts between the platelet standard (blue) and the whole blood standard (red) (Wilcoxon signed rank test). Figures 1E and 1F show that both RBC counts in the whole blood standard do not change over time in this study across the three time points (Friedman test and Wilcoxon signed rank test). MCV did not change between day 1 and day 14 but was significantly higher at day 28 (Friedman test p < 0.05 and Wilcoxon signed rank test p < 0.013). Statistical differences are shown * P ≤ 0.05, ** P ≤ 0.01, *** P ≤ 0.001, **** P ≤ 0.0001.
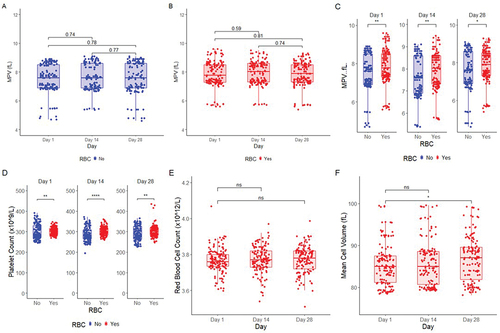
Table II. Summary of the intra-assay coefficient of variation (CV) values for MPV (fL) values within the MPV Platelet and Whole Blood Standards (N = 5) performed on different hematology instruments.
Table III. Summary of the inter-assay coefficient of variation (CV) values for MPV (fL) values within the MPV Platelet and Whole Blood Standards (N = 5) performed on different hematology instruments.
Comparison of MPV values across analytical platforms
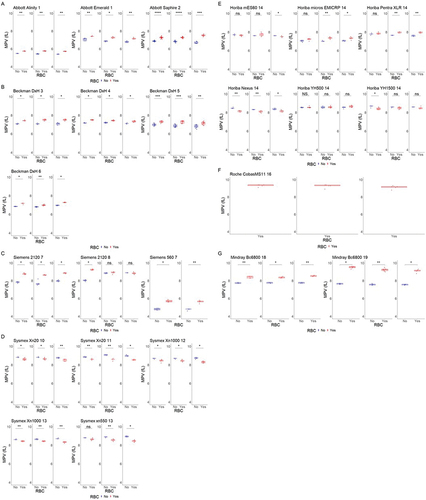
shows a summary of all MPV data for each instrument manufacturer and their range of instruments used in this study. Within any individual instrument, the MPV values were overall stable over the 28-day period. For the majority of instruments, the MPV values were usually higher in the whole blood standard compared to the platelet-only standard. The only exception to this was all Sysmex and some Horiba instruments, which showed the opposite effect with an increase in MPV values in the platelet-only standard. The Cobas M 511 (Roche) instrument gave the highest MPV values (i.e. 9.3, 9.3 and 9.1 fL at days 1, 14 and 28 respectively) of all the instruments in the whole blood standard. This is a slide-based digital imaging instrument where the analysis is also dependent upon the presence of red cells and therefore cannot report any platelet values in the platelet standard alone [Citation14]. In contrast, both the Advia 550 (Siemens) and Alinity hq (Abbott) gave the lowest MPV values below 6 fL. The overall variability between and within instrument results probably reflect differences not only in the technologies but also the type of gating used, the calculations used to derive the MPV and individual instrument calibration.
Figure 2. Mean Platelet Volume (fL) as measured by different manufacturers measured with and without RBC where possible. The figure is divided on manufacturer with a) Abbott, b) Beckman, c) Siemens, d) Sysmex, e) Horiba, f) Roche, g) Mindray. Each subfigure shows MPV measurement in sample on Day 1, Day 14 and Day 28 post-receipt in each instrument stratified by center number. (Centers 9, 15 and 17 are not shown as they did not participate or report all the required study data). In the absence of RBC, the majority of instruments measure MPV significantly lower than in the same preparation with RBC (Wilcoxon signed rank test). In contrast, Sysmex and some Horiba instruments are opposite where inclusion of RBC shows a significant reduction in measured MPV. Statistical differences are shown * P ≤ 0.05, ** P ≤ 0.01, *** P ≤ 0.001, **** P ≤ 0.0001.
Influence of the red cell MCV on the MPV
summarizes the MCV values of the three whole blood standards (with low, normal and high MCV) showing good stability over 50 days. The mean values were 70.2 fL (SD 0.6 fL), 77.7 fL (SD 0.6 fL) and 87.6 (SD 0.3 fL). summarizes the MPV data from the two platelet-only standards alone and the platelet plus RBC standards with different MCV values. There was an inverse relationship between MPV and MCV in the combined preparations: Lower MCV was associated with larger increases in MPV values. In addition, the MPV increase was larger in the platelet preparation with the lower MPV: the low MCV RBC (70.1 fL) resulted in a 44% increase in the MPV in the platelet preparation with the lower MPV. The effect was reduced to an extent with an increase in MCV of the RBC or to an extent by a larger MPV of the PLT population.
Table IV. Summary of MCV values (fL) of six whole blood standards (with low, normal and high MCV) and 2 platelet standards (PLT1 and PLT2) measured over 50 days.
Table V. Summary of the MPV data (fL) from the 2 platelet standards alone and in combination with the Red Cell standards with different MCV values (fL). The % change in the MPV values within the whole blood over the 2 different platelet standards alone is shown. Samples at different time points were measured once on a single instrument (Cell-DYN Sapphire.).
Influence of gating strategies on the MPV
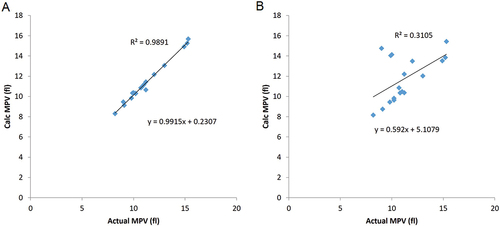
To illustrate how gating strategies influence the MPV. shows examples of typical platelet distributions observed in various pathological conditions. This illustrates the potential impact of large platelets, aggregates and microcytes on MPV values. shows the correlations of the MPV values obtained using either fixed lower and upper gates () and an upper floating gate () applied to the raw data from the above samples. As one might expect, the floating gate strategy agrees almost perfectly with the reported MPV values from the instrument.
Figure 3. Platelet impedance distributions observed in various pathological conditions including a normal sample and patients with macrothrombocytopenia, thrombocytopenia, microcytosis, red cell fragments and macrocytosis to illustrate how an upper floating gate influences the platelet distributions All samples were tested on a Mindray BC6800 analyzer.
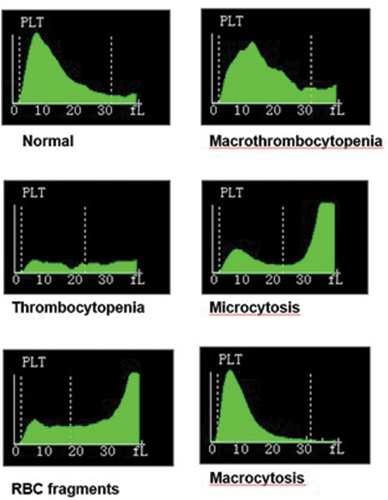
Figure 4. Correlations between the MPV obtained from a range of pathological samples tested on a Mindray BC6800 analyzer compared to two different gating strategies. Samples included patients classified as normal (N = 3), thrombocytopenia (N = 2) and thrombocytosis (N = 2). Some samples were flagged for the presence of Red cell fragments (N = 3), Large platelets (N = 2), microcytosis (N = 2), macrocytosis (N = 2) and platelet clumping (N = 2). (A) MPV calculated from raw data (y-axis) using either fixed lower and upper gates (lower cutoff of 2 fL and a higher cutoff of 25 fL) plotted against the reported value from the analyzer (x axis) and (B) MPV data calculated (y axis) from raw data using a fixed lower cutoff of 2 fL and a higher cut off at the nadir between the platelet and red cell distributions (i.e. the lowest MPV value) against the reported value from the analyzer (x axis).
Discussion
In this study, we have evaluated the potential of a commercial fixed porcine platelet preparation (in the presence and absence of fixed human RBC) for the standardization of MPV measurements. Standards were kindly prepared by Biotechne and distributed internationally to 19 laboratories including all major hematology instrument manufacturers and some academic/pathology laboratories. Overall, the standards demonstrated excellent stability up to 1 month in MPV values and platelet counts when stored at 4°C. The presence of RBC also appeared to slightly increase the platelet count and MPV values compared to the platelet standard alone. However, as previously shown, there were differences in MPV values between different instruments and manufacturers [Citation33–35]. Nebe et al. (2011) in particular showed within a large multicentric study that MPV values did vary between instruments much more than any other hematological parameters [Citation35]. Although the within instrument variation in the MPV values with low CVs at all time points were good over 1 month, additional variation between instruments based on different laboratory locations was observed (comparing either different or identical analyzers). This is especially apparent for the whole blood standard, as the RBC cells are sensitive to storage temperature and transportation environment. The MPV of the whole blood standard between identical analyzers therefore may be falsely elevated due to the possible breakdown of RBC cells. Indeed, a noticeable feature was that the MPV values were also usually higher in the whole blood standard compared to the platelet-only standard in the majority of the instruments. In contrast, within Sysmex and some Horiba instruments the MPV values were higher in the absence of the red cells. The Roche analyzer generated the highest MPV values in the whole blood preparation but it cannot report values in the absence of RBC. Interestingly, this analyzer uses digital imaging technology of blood films to derive both cell counts and volumes [Citation14].
There could be a number of reasons for the differences in MPV results in the presence and absence of RBC. Small RBC and/or RBC fragments could be directly contributing to more events within the expected size range of the platelet distribution [Citation18,Citation19]. These would cause not only a slight increase in the platelet count but potentially change the platelet distribution and the MPV. However, if this was the case, then one might have expected that the differences in results between the two standards across all analyzers would have been identical. Results from the range of Sysmex analyzers, however, revealed that the red cells were probably not directly contributing to a change in the MPV values. However, as these instruments use a floating gate strategy (i.e. between 2 and 6 fL at the low end and 12 and 30 fL at the high end) then this probably compensates for any changes in the platelet and red cell distributions and thus minimizes the any impact of RBC on the MPV However, one might have also expected Mindray instruments to give similar results to Sysmex as they also use a floating gate strategy at the top end of the platelet distribution. Given that the presence of RBC had a significant influence on the platelet distributions in this study, one could argue that any potential MPV standard should reflect the real world and be composed of both RBC and platelets. Furthermore, it is even more important to understand any impact of RBC on MPV values and platelet counts as this is likely to be clinically important. It is well known that microcytes can falsely elevate platelet counts and therefore change the platelet distribution and MPV [Citation18]. Furthermore, the Sysmex MPV is also calculated using the platelet count and the PlateletCrit (PCT) so any changes in these parameters could also explain some of the differences observed. It might be that more subtle changes may also occur in the presence of RBC, which may also contribute to MPV variation, as any differences in RBC distributions between samples could impact upon both platelet counts and MPV values.
In order to further investigate this phenomenon, two different Platelet MPV preparations (low and high MPV) in combination with 3 different RBC MCV preparations (with either low, normal or high MCVs) were tested with a single analyzer that employs impedance technology for MCV and MPV measurements (Abbott CELL-DYN Sapphire) to further elucidate how the presence and characteristics of RBCs may impact upon platelet analysis (count, MPV, and PDW) within a single impedance analyzer (Abbott Sapphire). Both the MPV and MCV values remained relatively stable over the course of the study for up to 50 days demonstrating that the standards exhibited good long-range stability. The RBC preparation with the lowest MCV had the greatest impact on the MPV. However, this was either mitigated by either an increase in MCV or by a larger MPV of the platelet population. To further understand how different gating strategies may influence results, another study was performed to reveal how either a fixed or floating upper gate strategy may impact upon MPV values within a single impedance analyzer (Mindray). Overall, it is clear that different gating strategies can significantly change the derived MPV values.
This study has revealed the potential of a new MPV standard for potentially calibrating and harmonizing MPV values in Hematology instruments [Citation33]. The long-term stability of both standards was shown to be excellent within each instrument, but also the presence of RBC was also shown to impact upon MPV values. The variation in results between different instruments are not only determined by the differences in technology used (i.e. impedance, optical or image analysis), variation in lower and/or upper gating strategies of the platelet distribution and by the actual calculations of MPV. This study also shows the potential difference in using a floating gating strategy to mitigate for any effects of RBC on the platelet distributions. Although standardization of gating strategies and the calculation of MPV values across instruments could offer an approach to harmonizing MPV values, this will advance global standardization and may facilitate appropriate data analysis in future generations of instruments. Measuring MPV values using any technology is still possible providing in-house normal ranges are always established and different instruments and measurement principles are not used within the same study. Indeed, recommendations for MPV measurements, including establishing local normal ranges are detailed in an editorial specifically written for the journal “platelets” in 2016 [Citation12]. Large datasets of MPV data, if available from different technologies, could also be potentially harmonized by normalizing data (e.g. through inverse normal transformation) adjusting for instrument differences or other effects by multivariable analysis.
It also remains unclear what the balance of the impacts of different variables on MPV variability (e.g. anticoagulant, time between phlebotomy and assay, type of instrument and the MCV). Although this study demonstrates the variability between instruments and the effect of MCV on MPV values within commercial standards, further studies will be required to fully understand the relative importance of all the variables involved.
A future ICSH study is now planned to capture the raw data from multiple instruments and determine the impact of harmonization of different gating strategies across different platforms to confirm these findings using whole blood standards containing different platelet and red cell preparations (with varying MPV and MCV values). Furthermore, measuring MPV using cellular displacement of an added fluorescent solution could offer a novel approach for developing a new independent reference method that may facilitate the objective calibration of standards (Dr. Ingmar Schoen, RCSI, personal communication) [Citation38].
Author contributions
PH, AJ, SB, and SM contributed to the study concept and design. PHa, JP, MD, AJ, SB, and XS all contributed to the laboratory analysis of PRP and blood samples. All the authors contributed to the acquisition, analysis, and interpretation of data. PH drafted the manuscript. All the authors critically revised the manuscript for important intellectual content. The corresponding author attests that all listed authors meet authorship criteria and that no others meeting the criteria have been omitted.
Acknowledgments
This paper is dedicated to the memory of Professor Samuel Machin who originally conceived the importance, concept and design of the project. This study was initiated and coordinated by an International Council for Standardization (ICSH) working group. The ICSH coordinates Working Groups of experts from around the globe to examine laboratory methods and instruments for hematological analyses, to deliberate on issues of standardization and to stimulate and coordinate scientific work as necessary toward the development of international standardization materials and guidelines. All standards used in this study were provided by Biotechne. Shipping costs were paid by the ICSH. The authors would like to thank all the participants for taking part in this study. Dr. Steven Marionneaux, Abbott Diagnostics, Santa Clara, CA, USA; Dr. Patrick O’Neil, Beckman Coulter, Miami, Florida, USA; Dr. Robert Langley, Siemens, Tarrytown, New York, USA; Dr. Yosuke Iwasaki, Sysmex Corporation, Kobe, Japan; Scott Lesher, Sysmex Corporation, Mundelein, IL, USA; Dr. Cécile Chabert, Horiba, Montpelier, France; Dr. Ertan Ergezen, Roche Diagnostics, Boston, MA, USA; Dr Albert Huisman, Utrecht, The Netherlands; Dr. Vicki Parsons, Kansas City, Kansas, USA; Dr. Cristian Morales, Barcelona, Spain; Ms. Cordula Sternemann, Bochum, Germany; Professor Marie-Christine Alessi, Marseille, France; Conor O’Malley, Leeds, UK; Dr. Paul Harrison, Birmingham, UK; Dr. Ian Mackie, London, UK; Dr. Sukesh C Nair, Vellore, Tamil Nadu, India; Dr Henk Russcher, Rotterdam, The Netherlands; Dr. Patrick Chan, Hong Kong, China and Dr. JianBiao Wang, Shanghai, China.
Disclosure statement
Alan Johnson, Samuel Baldwin are ex-employees of Biotechne. Marcel Veronneau and Daniel Baertlein are current employees of Biotechne. Xiaoyong Shi is an employee of Mindray. Biotechne holds patents on how to process the materials during manufacture of the reference standards.
Additional information
Funding
References
- Simson E. Wallace Coulter’s life and his impact on the world. Int J Lab Hematol 2013;35:230–236. doi:10.1111/ijlh.12069.
- Robinson JP. Wallace H. Coulter: decades of invention and discovery. Cytometry A 2013;83:424–438. doi:10.1002/cyto.a.22296.
- Crosland-Taylor P, Stewart JW, Haggis G. An electronic blood-cell counting machine. Blood 1958;13:398–409. doi:10.1182/blood.V13.4.398.398.
- Davis RE, Green RE. Automatic platelet counting with the Coulter particle counter. J Clin Pathol 1967;20:777–779. doi:10.1136/jcp.20.5.777.
- Briggs C, Harrison P, Machin SJ. Continuing developments with the automated platelet count. Int J Lab Hematol 2007;29:77–91. doi:10.1111/j.1751-553X.2007.00909.x.
- Buttarello M, Plebani M. Automated blood cell counts: state of the art. Am J Clin Pathol 2008;130:104–116. doi:10.1309/EK3C7CTDKNVPXVTN.
- Baccini V, Genevieve F, Jacqmin H, Chatelain B, Girard S, Wuilleme S, Vedrenne A, Guiheneuf E, Toussaint-Hacquard M, Everaere F, et al. Platelet Counting: ugly Traps and Good Advice. Proposals from the French-Speaking Cellular Hematology Group (GFHC). J Clin Med 2020;9:808. doi:10.3390/jcm9030808.
- Noris P, Melazzini F, Balduini CL. New roles for mean platelet volume measurement in the clinical practice? Platelets 2016;27:607–612. doi:10.1080/09537104.2016.1224828.
- Vinholt PJ, Alnor A, Nybo M, Hvas AM. Prediction of bleeding and prophylactic platelet transfusions in cancer patients with thrombocytopenia. Platelets 2016;27:547–554. doi:10.3109/09537104.2015.1131814.
- Buttarello M. Laboratory diagnosis of anemia: are the old and new red cell parameters useful in classification and treatment, how? Int J Lab Hematol 2016;38:123–132. doi:10.1111/ijlh.12500.
- Koepke JA. Future directions for quality assurance in laboratory haematology. Clin Lab Haematol 1990;12:171–176.
- Harrison P, Goodall AH. Studies on mean platelet volume (MPV) - new editorial policy. Platelets 2016;27:605–606. doi:10.1080/09537104.2016.1225467.
- Demirin H, Ozhan H, Ucgun T, Celer A, Bulur S, Cil H, Gunes C, Yildirim HA. Normal range of mean platelet volume in healthy subjects: insight from a large epidemiologic study. Thromb Res 2011;128:358–360. doi:10.1016/j.thromres.2011.05.007.
- Bruegel M, George TI, Feng B, Allen TR, Bracco D, Zahniser DJ, Russcher H. Multicenter evaluation of the cobas m 511 integrated hematology analyzer. Int J Lab Hematol 2018;40:672–682. doi:10.1111/ijlh.12903.
- Levin J, Bessman JD. The inverse relation between platelet volume and platelet number. Abnormalities in hematologic disease and evidence that platelet size does not correlate with platelet age. J Lab Clin Med 1983;101:295–307.
- Lippi G, Franchini M. Platelets and immunity: the interplay of mean platelet volume in health and disease. Expert Rev Hematol 2015;8:555–557. doi:10.1586/17474086.2015.1069703.
- Noris P, Klersy C, Zecca M, Arcaini L, Pecci A, Melazzini F, Terulla V, Bozzi V, Ambaglio C, Passamonti F, et al. Platelet size distinguishes between inherited macrothrombocytopenias and immune thrombocytopenia. J Thromb Haemost 2009;7:2131–2136. doi:10.1111/j.1538-7836.2009.03614.x.
- Chapman DH, Hardin J, Miers M, Moyle S, Kinney MC. Reduction of the platelet review rate using the two-dimensional platelet method. Am J Clin Pathol 2001;115:894–898. doi:10.1309/C563-49VA-JYDU-LEJG.
- Harrison P, Segal H, Briggs C, Murphy M, Machin S. Impact of immunological platelet counting (by the platelet/RBC ratio) on haematological practice. Cytometry B Clin Cytom 2005;67:1–5. doi:10.1002/cyto.b.20058.
- Harris N, Kunicka J, Kratz A. The ADVIA 2120 hematology system: flow cytometry-based analysis of blood and body fluids in the routine hematology laboratory. Lab Hematol 2005;11:47–61. doi:10.1532/LH96.04075.
- Brummitt DR, Barker HF. The determination of a reference range for new platelet parameters produced by the Bayer ADVIA120 full blood count analyser. Clin Lab Haematol 2000;22:103–107. doi:10.1046/j.1365-2257.2000.00285.x.
- Hummel K, Sachse M, Hoffmann J, van Dun L. Comparative evaluation of platelet counts in two hematology analyzers and potential effects on prophylactic platelet transfusion decisions. Transfusion 2018;58:2301–2308. doi:10.1111/trf.14886.
- Kemble S, Briggs C, Harrison P. Platelets Counting. In: Michelson AD , Cattaneo M, Frelinger AL, Newman PJ, editors. London: Academic Press; 2019. p. 581–591.
- Korniluk A, Koper-Lenkiewicz OM, Kaminska J, Kemona H, Dymicka-Piekarska V. Mean platelet volume (MPV): New perspectives for an old marker in the course and prognosis of inflammatory conditions. Mediators Inflamm 2019;2019:9213074. doi:10.1155/2019/9213074.
- Lippi G. Genetic and nongenetic determinants of mean platelet volume. Blood 2016;127:179–180. doi:10.1182/blood-2015-11-679852.
- Jackson SR, Carter JM. Platelet volume: laboratory measurement and clinical application. Blood Rev 1993;7:104–113. doi:10.1016/S0268-960X(05)80020-7.
- Beyan C, Beyan E. Pre-analytical standardization should be mandatory before reference ranges for mean platelet volume are determined. Scand J Clin Lab Invest 2016;76:588. doi:10.1080/00365513.2016.1203015.
- Lance MD, Sloep M, Henskens YM, Marcus MA. Mean platelet volume as a diagnostic marker for cardiovascular disease: drawbacks of preanalytical conditions and measuring techniques. Clin Appl Thromb Hemost 2012;18:561–568. doi:10.1177/1076029612458147.
- Lance MD, van Oerle R, Henskens YM, Marcus MA. Do we need time adjusted mean platelet volume measurements? Lab Hematol 2010;16:28–31. doi:10.1532/LH96.10011.
- Bath PM. The routine measurement of platelet size using sodium citrate alone as the anticoagulant. Thromb Haemost 1993;70:687–690. doi:10.1055/s-0038-1649650.
- Mannuss S, Schuff-Werner P, Dreissiger K, Kohlschein P. Magnesium sulfate as an alternative in vitro anticoagulant for the measurement of platelet parameters? Am J Clin Pathol 2016;145:806–814. doi:10.1093/ajcp/aqw066.
- Spezia J, Hermann PB, Comar SR, Picheth G, Henneberg R, Utiyama SRR. Anticoagulant choices affect the mean platelet volume measurement by Impedance. Clin Lab 2018;64:217–220. doi:10.7754/Clin.Lab.2017.170806.
- Lippi G, Pavesi F, Pipitone S. Evaluation of mean platelet volume with four hematological analyzers: harmonization is still an unresolved issue. Blood Coagul Fibrinolysis 2015;26:235–237. doi:10.1097/MBC.0000000000000220.
- Latger-Cannard V, Hoarau M, Salignac S, Baumgart D, Nurden P, Lecompte T. Mean platelet volume: comparison of three analysers towards standardization of platelet morphological phenotype. Int J Lab Hematol 2012;34:300–310. doi:10.1111/j.1751-553X.2011.01396.x.
- Nebe T, Bentzien F, Bruegel M, Fiedler GM, Gutensohn K, Heimpfel H, Krebs N, Ossendorf M, Schuff-Werner P, Stamminger G, et al. Multi-centric determination of reference ranges for automated blood counts. J Lab Med 2011;35:25.
- Harrison P, Ault KA, Chapman S, Charie L, Davis B, Fujimoto K, Houwen B, Kunicka J, Lacombe F, Machin S, et al., International Society of Laboratory Hematology Task Force for the Reference Platelet, C. An interlaboratory study of a candidate reference method for platelet counting. Am J Clin Pathol 2001;115:448–459. doi:10.1309/91PR-E4G6-XBAF-N8DY.
- International Council for Standardization in Haematology Expert Panel on, C. and International Society of Laboratory Hematology Task Force on Platelet, C. Platelet counting by the RBC/platelet ratio method. A reference method. Am J Clin Pathol 2001;115:460–464. doi:10.1309/W612-MYEP-FA7U-8UYA.
- Model MA. Methods for cell volume measurement. Cytometry A 2018;93:281–296. doi:10.1002/cyto.a.23152.