
 ?Mathematical formulae have been encoded as MathML and are displayed in this HTML version using MathJax in order to improve their display. Uncheck the box to turn MathJax off. This feature requires Javascript. Click on a formula to zoom.
Abstract
The hybrid-channel platelet counting method (PLT-H) is a new platelet counting technique proposed by Mindray of China. In this study, we aimed to evaluate the accuracy of this technique in various situations and its reliability in platelet transfusion decision-making. A total of 378 venous blood samples were tested. Using the immunological PLT counting method recommended by the International Council for Standardization in Hematology as the reference method (PLT-IRM), Passing-Bablok regression and Bland-Altman analysis were performed on the PLT-H results. The anti-interference performance of PLT-H under different interference levels was explored using intergroup comparisons, and confusion matrices were analyzed at various transfusion cutoff values. In the absence of interference, there was a strong correlation between PLT-H and PLT-IRM (r = 0.993, 95% CI: 0.990–0.996). Under various interference conditions, the correlation between PLT-H and PLT-IRM was between 0.963 and 0.992, with an average deviation of −14.56 to −2.02. The performance of PLT-H against interference did not change significantly with increasing levels of small RBCs, large PLTs, and RBC fragments (P = .5704, 0.0832, 0.9893). In low-value samples (PLT <100 × 109/L), the coefficient of variation (CV) for PLT-H was less than 7.6%, regardless of the presence or absence of interfering substances. In addition, there was a high agreement between PLT-H and PLT-IRM (ICC = 0.972). Confusion matrice analysis at each medical decision level showed similarity to methods using the fluorescence channel (PLT-O) and superiority to the impedance channel (PLT-I). Compared with PLT-I, PLT-H has higher accuracy in PLT counting, stronger anti-interference ability, better performance in low-value samples at no extra economic cost and can be more useful for platelet transfusion decision-making. PLT-H is a novel method for platelet counting that offers higher accuracy, providing physicians with the ability to make better medical decisions, particularly in cases where values are low, or interference is present. As it does not require additional reagents, it is highly likely to replace PLT-I and become the mainstream method for platelet counting in the future.
Introduction
The platelet count is a basic examination in patient management and an important diagnostic tool for bleeding disorders.Citation1 Platelet transfusion has a significant beneficial effect on active bleeding in patients with severe thrombocytopenia.Citation2,Citation3 International guidelines for people with long-term thrombocytopenia recommend either a therapeutic strategy (platelet transfusion to treat bleeding) or a prophylactic platelet transfusion strategy (platelet transfusion when the platelet count falls below a predetermined threshold).Citation4,Citation5 However, platelet transfusion is associated with adverse events that can cause immediate or long-term harm and delay the initiation of life-saving treatment.Citation6,Citation7 Thus, accurate platelet count is essential for clinical management and transfusion decision-making.
There are four main methods of platelet counting in current clinical practice: the manual microscopy counting method, the impedance method, the optical scattering/fluorescence method (PLT-O/F), and the flow cytometry method.Citation8,Citation9 The manual microscopy counting method has a high CV and is time-consuming. The introduction of automated whole blood analyzers using PLT-I has greatly improved precision. However, PLT-I is challenging to distinguish particles of similar size as platelets and can cause false results.Citation10 In recent years, PLT-O/F has been introduced for automated platelet counting. PLT-O/F has good accuracy and precision and solves the limitations of PLT-I. However, PLT-O/F requires expensive reagents, making it challenging to use widely in the clinic. Flow cytometry with monoclonal antibodies is recommended as a reference method for platelet count. Still, it is also not suitable for routine blood analysis due to factors such as expensive reagents and complex operations.
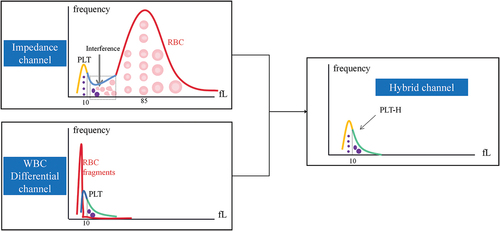
Recently, a new hybrid-channel PLT counting method (PLT-H) has appeared. In this method, smaller-sized PLTs (≤10 fL) are counted in the impedance channel to avoid various interfering factors, such as small RBCs and fragments. The larger-sized PLTs (>10 fL) are counted in the WBC differential (DIFF) channel to maintain intact structures and avoid being affected by hemolysis. This dual channel can count all PLTs by combining these two PLT counting channels (). Theoretically, this method could accurately measure PLTs even in blood samples with interferences.
Figure 1. Illustration of PLT-H.
This study aims to evaluate the accuracy of PLT-H, especially in blood samples with different types of interfering substances. At the same time, the reliability of clinical platelet transfusion decision-making was also analyzed.
Materials and methods
Samples
From November 2021 to January 2022, 399 blood samples were collected consecutively from Ruijin Hospital affiliated to Shanghai Jiaotong University. A total of 378 samples were finally included in this study (5 cases with PLT aggregation confirmed by microscopic examination and 16 cases with the BC-700 alarm “PLT-H histogram abnormal” were excluded). The study protocol adhered to the guidelines outlined in the Declaration of Helsinki and received approval from the Ethics Committee of Ruijin Hospital. The samples used in this study were the remaining blood samples obtained after standard hospital-required testing. Informed consent was not required from the patients following the Chinese government’s Food and Drug Administration regulations. To ensure patient confidentiality, all samples were re-coded based on the date and order of collection.
The samples included in the analysis were divided into the following five groups based on the following conditions:
Noninterference group: The morphology of RBCs and PLTs was normal or roughly normal, the size and ratio of the PLTs were normal, and the whole slide had no obvious abnormal interfering substances.
Small RBCs group: mean corpuscular volume (MCV) ≤ 65 fL or the proportion of small RBCs (diameter <6.8 μm) > 20% as confirmed by MC-80 automated blood cell morphology analyzer.
Large PLTs group: mean platelet volume (MPV) ≥ 13 fL or the proportion of large PLTs (>4 μm) > 10% as confirmed by MC-80 automated blood cell morphology analyzer.
RBC Fragments: the proportion of RBC fragments > 1%, confirmed by MC-80 automated blood cell morphology analyzer.
Multiple interferences group: two or three groups of mixed small RBCs, large PLTs, and RBC fragments.
Sample analysis
Analysis procedures
Three milliliters of venous blood was collected in an ethylenediaminetetraacetic acid (EDTA)-K2 anticoagulant tube and was tested within 6 hours.
PLT-H represents the hybrid channel for PLT count, detected by the BC-700 hematology analyzer (Mindray, China). PLT-I and PLT-O represent the counting principles of impedance channel and fluorescence channel, detected by the BC-6800Plus hematology analyzer (Mindray, China). PLT-O 8× is a mode that increases the counting particles by 8-fold based on fluorescence staining.
The SC-120 instrument (Mindray, China) was used for slide making and staining, and the staining method followed Wright’s staining procedure. The MC-80 (Mindray, China) automated blood cell morphology analyzer (Mindray, China) was used for slide review and analysis.
PLT-IRM analysis
Following the ICSH guidelines and the International Society of Laboratory Hematology,Citation11,Citation12 PLTs were labeled with CD41 and CD61 antibodies and analyzed by flow cytometry. The ratio of RBC events to PLT events (RBC/PLT, R) collected by flow cytometry was calculated. The concentration of PLTs = RBC-i/R. The RBC-i was derived from the average number of RBCs detected by the BC-6800Plus hematology analyzer and BC-700 hematology analyzer.
Statistical analysis
Passing-Bablok regression and Bland-Altman plots were used to analyze the deviation between the test and the reference methods. Passing-Bablok regression analysis tested whether the analysis system had constant system error (95% intercept not include 0) or proportional error (95% slope not include 1). Bland-Altman analysis was used to evaluate the average deviation compared to the reference method. The 95% limits of agreement (LOA) represent the upper and lower limits of agreement, which are +1.96SD and
−1.96SD, respectively. It is considered acceptable when 95% of the comparison points are all within the agreement interval. The spearman correlation coefficient was used to evaluate the correlation between the results, and the intraclass correlation coefficient (ICC) was calculated to quantify the consistency of the two detection methods. The precision was expressed as the coefficient of variation (CV). According to the European Federation of Clinical Chemistry and Laboratory Medicine (EFLM), it is considered ideal precision when the CV% is < 7.6%.Citation13 Statistical analysis was performed in IBM SPSS Statistics (version 22, USA) and Analyse-it (version 5.66, United Kingdom). GraphPad Prism (version 9.0.2, USA) and Excel (version 2021, USA) were used for plotting. The calculation of sensitivity, specificity, precision, recall, F1, accuracy, and kappa comes from the Caret package in the R language (version 4.3.0).
Results
Performance of PLT-H in samples with no interferences
We initially analyzed 80 clinical samples without interfering substances to assess the performance of PLT-H. As presented in , the results demonstrate a strong correlation between PLT-H and the reference method (r = 0.993, 95% CI: 0.990–0.996). The slope 95% CI indicates no proportional error, while the intercept 95% CI (3.069–-0.928) suggests a slight constant error. Bland-Altman analysis reveals a mean difference of −1.26 (95% LOA: −14.53–12.01), which is comparable to the PLT-O method. Even when PLT < 100 × 109/L, PLT-H still exhibits a good correlation with the reference method (r = 0.987, 95% CI: 0.978–0.992), with a mean difference of −2 (95% LOA: −9.19–5.18), but with a constant error.
Table 1. Regression analysis and deviation analysis in samples without interference.
Performance of PLT-H in samples with various interferences
We tested 285 samples with different types of interferences, including samples with small RBCs, large PLTs, RBC fragments, and multiple interferences. Regardless of the type of interference, the correlation between PLT-H and PLT-IRM was found to be better than that between PLT-I and PLT-IRM (). Specifically, in samples with RBC fragments, the correlation coefficient (r = 0.992, 95% CI: 0.987–0.996) between PLT-H and PLT-IRM was comparable to that between PLT-O and PLT-IRM (r = 0.997, 95% CI: 0.994–0.998). In the low-value and interfering samples, PLT-I exhibited poor accuracy with a correlation of only 0.822 (95% CI: 0.735–0.883) and an average deviation of 0.81 (95% LOA: −30.31–31.93). In contrast, PLT-H showed similar performance to PLT-O with a correlation of 0.975 (95% CI: 0.962–0.984) and an average deviation of 0.358 (95% LOA: −14.31–15.03).
Table 2. Regression analysis and deviation analysis in samples with various interferences.
Anti-interference performance of PLT-H under different levels of interferences
To further investigate the anti-interference ability of PLT-H, we used the three parameters of MCV, MPV, and FRC%, of the hematology analyzer to represent the change of red blood cell volume,Citation14–16 platelet volume,Citation17 and RBC fragment.Citation18 Considering the influence of the number of PLT on the deviation, we used the partial correlation analysis.Citation19 After deducting the PLT number’s effect, the trends between the two techniques and PLT-IRM are shown in . It can be seen that the deviation between PLT-I and PLT-IRM presented a weak negative correlation (r: −0.4383, P < .0001) with increasing the volume of RBC and a weak positive correlation (r: 0.4637, P < .0001) with increasing the percentage of RBC fragments, which is consistent with general cognition, while the deviation between PLT-I and PLT-IRM did not show a correlation (r: −0.1201, P = .0195) with increasing MPV, which may be because improvement has been made on discriminating large PLTs from other particles (fitted curve, changing threshold between PLT and RBC).Citation10,Citation16 However, the variation of these three parameters did not affect the deviation trend between PLT-H and PLT-IRM. To further analyze the effect of different levels of interference on the accuracy of PLT-H, we divided the interference samples in each category into subgroups with different levels of interference. shows that the subgroups’ differences were insignificant (P = .5704, 0.0832, 0.9893). Therefore, it is evident that the anti-interference ability of PLT-H did not decrease with increasing levels of interference.
Figure 2. Trend of deviation as MCV, MPV, and FRC% change.
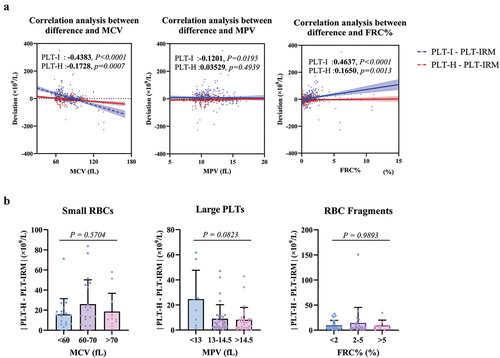
A:The x-axis represents the blood cell parameters, and the y-axis represents the deviation of PLT-I/PLT-H with the reference method. The analysis was performed using partial correlation regression. B: The x-axis represents the blood cell parameters, and the y-axis represents the absolute value of the deviation of PLT-H compared to the reference method. The Kruskal-Wallis test was used to analyze the differences among groups.
Performance of PLT-H in different blood transfusion decision-making medical decision level
Finally, we assessed the repeatability of low-value PLT samples (<100 × 109/L) with and without interferences (). Regardless of the presence of interferences, PLT-O demonstrated good repeatability, with a maximum coefficient of variation of less than 7.0%. The lower variability of PLT-H was affected by PLT-I but remained lower than that of PLT-I. illustrates that the ICC between PLT-H and PLT-O was the highest across the entire range. Additionally, the agreement between PLT-O and PLT-IRM (ICC: 0.977) was the highest among the low-value samples, followed by PLT-H and PLT-O (ICC: 0.975), and then PLT-H and PLT-IRM (ICC: 0.972). At the threshold of 5 × 10⁹/L, the 95% distribution interval of PLT-I and PLT-H bias estimates were found to be −12.83% to 40.31% and −46.17% to −6.70%. This interval is not covered by the prespecified acceptance criterion of 25% (). Therefore, it can be concluded that the criterion for lot equivalence is not met at this medical decision point. Furthermore, the accuracy and kappa of PLT-H at thresholds of 10, 20, 50, and 80 × 109/L were improved compared to PLT-I due to increased specificity (). This suggests that using PLT-H for transfusion assessment may reduce the risk of patients receiving excessive transfusions.
Figure 3. Repeatability and ICC analysis of various platelet count methods.
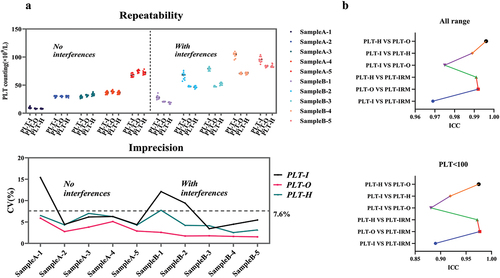
Figure 4. Confusion matrices at different platelet infusion thresholds.
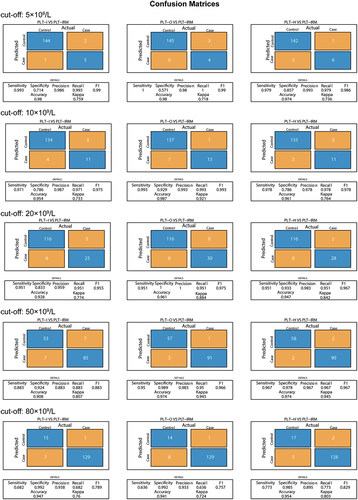
Table 3. Deviation analysis at different levels of medical decision-making.
A:Numbers A-1 to A-5 are non-interfering samples, and numbers B-1 to B-5 are interfering samples. The upper graph shows the results of 10 measurements for each sample. The lower graph shows the CV% of 10 measurements for the three detection techniques. B: The ICC (Intra-class Correlation Coefficient) evaluates the agreement between two measurement methods; the theoretical range of the ICC is 0–1. In general, an ICC between 0–0.5 indicates poor agreement, 0.5–0.75 moderate, 0.75–0.9 good, and 0.9–1 excellent.
Actual represents a judgment using PLT-IRM, and Predicted represents a judgment using PLT-I/PLT-O/PLT-H. Control means that the value of this platelet count method is greater than the set threshold (cutoff), and Case means that the value of this platelet count method is less than or equal to the set threshold.
The medical decision level was derived from the American Association of Blood Banks, the American Red Cross, the World Health Organization, and the German Medical Association. The Clinical Laboratory Improvement Amendments of 1988 (CLIA88) define acceptable performance as ± 25%.
Discussion
PLT-I is a classic and reliable method for counting platelets and has widely been used in clinical laboratories. Limited by its principle, PLT-I is weak in anti-interference ability, and it is difficult to distinguish particles of a similar size as platelets, such as small red blood cells or red blood cell fragments. In the case of large platelets or platelet aggregation, the PLT count results obtained by the PLT-I method will also lead to the wrong result.Citation20
PLT-O/F is a method of PLT-specific staining by nucleic acid fluorescent dyes. It correlates well with the standard method across the full PLT concentration range and in the lower-value segment. Mindray offers the PLT-O 8× technology for severely low-value samples, which significantly enhances the reproducibility level of low-value PLTs. In addition, the PLT-O technology can also dissociate EDTA-pseudothrombocytopenia samples to allow the same amount of blood collection as the replacement of anticoagulants, which will greatly reduce the possible clinical risk.Citation21,Citation22
Although ICSH recommends immunological PLT counting as a reference method for counting, high-value PLTs, PLT aggregation, thrombasthenia, and cold agglutination may still lead to inaccurate counting.Citation11 It is still a reliable method after excluding these conditions, especially for low-value PLT counting.
The PLT-H technology utilizes a high-precision micro-particle optical detection system to collect scattered light from the organelles within platelets in order to count large platelets. Combined with the impedance channel for small-volume platelets, the results from both channels are integrated to obtain the final platelet count. However, during testing, we have also encountered some challenging issues with this technology, such as interference from samples with hemolysis abnormalities (e.g., RBC resistant to lysis) on the DIFF channel and platelet clumps.Citation23 The instrument will provide an alarm in these situations, although the occurrence rate is usually low. All samples used in this study were selected based on the absence of PLT-H histogram abnormalities.
In this study, we initially examined the performance of PLT-H in interference-free samples. Despite a strong correlation and low average deviation compared to the reference method, there is still a constant bias present when using the PLT-H method. We hypothesize that this bias may be attributed to the differences between instruments. Therefore, further analysis of PLT-I/PLT-H and PLT-IRM on the same instrument is necessary, along with evaluation using more normal samples. In samples with small RBCs, PLT-H exhibits both constant and proportional biases. Notably, the upper limit of the 95% LOA is reduced compared to the impedance method, resulting in an improvement in correlation. The reason why the average deviation is higher than that of the impedance method is that the impedance method simultaneously has similar positive and negative deviations. In samples with RBC fragments, a proportional bias is observed. Additionally, both the upper and lower limits of the 95% LOA are reduced compared to the impedance method, leading to a noticeable improvement in correlation (0.992 > 0.969). When samples contain various types of interference, PLT-H demonstrates a more substantial improvement in interference. Furthermore, it is not affected by the degree of interference (). It is important to note that while PLT-H cannot completely eliminate interference in some samples, it still possesses a clear advantage in the majority of cases.
In recent years, due to the influence of various cytotoxic therapeutic drugs, the number of patients with thrombocytopenia has significantly increased. According to the patient’s condition and the reversibility of bone marrow failure, many guidelines and recommendations on the PLT transfusion threshold in different clinical settings have been published. The lowest recommended number is 5 × 10⁹/L, but a lowering of the threshold is usually accompanied by a higher CV, which manifests as the phenomenon of when the PLT count is in the range of 5–10 × 109/L, 11–20 × 109/L, or 21–35 × 109/L, the CV of the samples can be as high as 32%, 20% or 15%, respectively.Citation24 A large multicenter study compared the current hematology analyzers in patients with severe thrombocytopenia. Compared with the reference value, two-thirds of the hematology analyzers overestimated the PLT count, which will lead to inadequate PLT transfusion at different thresholds, similar to the research by Hong et al.Citation24–27
In low-value PLT samples, especially in the presence of interferences, impedance-based method tends to produce higher CV, which, according to our study, is decreased for the PLT-H method. In the low-value samples, impedance-based platelet counts are overestimated, resulting in reduced sensitivity in identifying patients who may require platelet transfusions, similar to the findings of Segal et al.Citation28 At transfusion thresholds between 10 × 109/L and 80 × 109/L, decision-making using PLT-H was more accurate and had a higher kappa than PLT-I, demonstrating a more consistency with PLT-IRM. Since the samples lower than 5 × 10⁹/L were only 7 cases, the reliability of its conclusion needs to be further verified. Also, in the regression analysis, PLT-I and PLT-H had unacceptable deviations at a threshold of 5 × 10⁹/L. In the analysis of such very low-value samples, we should consider the CV up to 3% for PLT-IRM at 40 × 109/L.Citation12 We believe that more studies should be available to demonstrate whether PLT-H can lead to more clinical benefits.
The limitations of this study are summarized as follows: First, only ten high-PLT samples (≥600 × 109/L) were included, and the performance of various detection techniques in the high-value segment was not analyzed in detail. Second, PLT assay techniques from different manufacturers were not included together in our statistical analysis. Finally, this study was done at one center study and needed to be validated in more hospitals or laboratories.
This is the first comprehensive, systematic, and detailed study of the new technology of PLT-H. A detailed analysis of different types and degrees of interfering factors was performed and the reliability of PLT-H in low-PLT samples was analyzed. The results indicate that PLT-H is a reliable technique in the clinical laboratory and PLT transfusion decision-making without incurring additional costs. Its performance is far superior to the traditional impedance method and can be used for final confirmation of the PLT count, a technique that could replace the impedance method in the future.
Disclosure statement
No potential conflict of interest was reported by the author(s).
Additional information
Funding
References
- Estcourt LJ, Birchall J, Allard S, Bassey SJ, Hersey P, Kerr JP, Mumford AD, Stanworth SJ, Tinegate H, British Committee for Standards in Haematology. Guidelines for the use of platelet transfusions. Br J Haematol. 2017;176(3):365–10. doi:10.1111/bjh.14423.
- Kaufman RM, Djulbegovic B, Gernsheimer T, Kleinman S, Tinmouth AT, Capocelli KE, Cipolle MD, Cohn CS, Fung MK, Grossman BJ, et al. Platelet transfusion: a clinical practice guideline from the AABB. Ann Intern Med. 2015;162(3):205–13. doi:10.7326/M14-1589.
- Lippi G, Favaloro EJ, Buoro S. Platelet transfusion thresholds: how low can we go in respect to platelet counting? Semin Thromb Hemost. 2020;46(3):238–44. doi:10.1055/s-0039-1696943.
- Killick SB, Carter C, Culligan D, Dalley C, Das‐Gupta E, Drummond M, Enright H, Jones GL, Kell J, Mills J, et al. Guidelines for the diagnosis and management of adult myelodysplastic syndromes. Br J Haematol. 2014;164(4):503–25. doi:10.1111/bjh.12694.
- Wandt H, Schafer-Eckart K, Greinacher A. Platelet transfusion in hematology, oncology and surgery. Dtsch Arztebl Int. 2014;111(48):809–15. doi:10.3238/arztebl.2014.0809.
- Schmidt AE, Henrichs KF, Kirkley SA, Refaai MA, Blumberg N. Prophylactic preprocedure platelet transfusion is associated with increased risk of thrombosis and mortality. Am J Clin Pathol. 2017;149(1):87–94. doi:10.1093/ajcp/aqx151.
- Callow CR, Swindell R, Randall W, Chopra R. The frequency of bleeding complications in patients with haematological malignancy following the introduction of a stringent prophylactic platelet transfusion policy. Br J Haematol. 2002;118(2):677–82. doi:10.1046/j.1365-2141.2002.03616.x.
- Briggs C, Harrison P, Machin SJ. Continuing developments with the automated platelet count 1. Int J Lab Hematol. 2007;29(2):77–91. doi:10.1111/j.1751-553X.2007.00909.x.
- Baccini V, Geneviève F, Jacqmin H, Chatelain B, Girard S, Wuilleme S, Vedrenne A, Guiheneuf E, Toussaint-Hacquard M, Everaere F, et al. Platelet counting: ugly traps and good advice. Proposals from the French-speaking cellular hematology group (GFHC). J Clin Med. 2020;9(3):808. doi:10.3390/jcm9030808.
- Zandecki M, Genevieve F, Gerard J, Godon A. Spurious counts and spurious results on haematology analysers: a review. Part I: platelets. Int J Lab Hematol. 2007;29(1):4–20. doi:10.1111/j.1365-2257.2006.00870.x.
- International Council for Standardization in Haematology Expert Panel on, C. and C. International society of laboratory hematology task force on platelet, platelet counting by the RBC/platelet ratio method. A reference method. Am J Clin Pathol. 2001;115(3):460–4. doi:10.1309/W612-MYEP-FA7U-8UYA.
- Platelet counting by the RBC/platelet ratio method. A reference method. Am J Clin Pathol. 2001;115(3):460–4. doi:10.1309/W612-MYEP-FA7U-8UYA.
- EFLM biological variation database, thrombocytes. https://biologicalvariation.eu/search?query=Thrombocytes.
- Deng J, Xie S, Chen Y, Ma Q, He Y, Liu M, Wang D, Yu X. Application of the fluorescence method on Sysmex XN9000 hematology analyzer for correcting platelet count in individuals with microcytosis. Lab Med. 2023;54(1):e10–e13. doi:10.1093/labmed/lmac063.
- Lakos G, Mukhtar Z, Masi L, Valente S, Papa F. Alinity hq platelet count is not impacted by severe microcytosis. Clin Lab Anal. 2022;36(4):e24218. doi:10.1002/jcla.24218.
- Tantanate C, Khowawisetsut L, Pattanapanyasat K. Performance evaluation of automated impedance and optical fluorescence platelet counts compared with International reference method in patients with thalassemia. Arch Pathol Lab Med. 2017;141(6):830–6. doi: 10.5858/arpa.2016-0222-OA.
- Chen S, Mao Z, Wang S, Deng J, Liao H, Zheng Q. Micro–red blood cell, fragmented red blood cell, platelet distribution width, mean platelet volume, and platelet–large cell ratio on Sysmex XN series hematology analyzers can be used for the reflex test of impedance platelet count in clinical practice. Arch Pathol Lab Med. 2023. doi:10.5858/arpa.2022-0030-OA.
- Briggs C. Quality counts: new parameters in blood cell counting. Int J Lab Hematol. 2009;31(3):277–97. doi:10.1111/j.1751-553X.2009.01160.x.
- Kim S. ppcor: an R package for a fast calculation to semi-partial correlation coefficients. Commun Stat Appl Methods. 2015;22(6):665–74. doi:10.5351/CSAM.2015.22.6.665.
- Kemble S, Briggs C, Harrison P. Platelet counting. In: Michelson AD editor. Platelets. 4th ed. London: Academic Press; 2019. p. 581–91.
- Bao Y, Wang J, Wang A, Bian J, Jin Y. Correction of spurious low platelet counts by optical fluorescence platelet counting of BC-6800 hematology analyzer in EDTA-dependent pseudo thrombocytopenia patients. Transl Cancer Res. 2020;9(1):166–72. doi:10.21037/tcr.2019.12.58.
- Guo P, Cai Q, Mao M, Lin H, Chen L, Wu F, Wang J. Performance evaluation of the new platelet measurement channel on the BC-6800 plus automated hematology analyzer. Int J Lab Hematol. 2022;44(2):281–7. doi:10.1111/ijlh.13753.
- Zandecki M, Genevieve F, Gerard J, Godon A. Spurious counts and spurious results on haematology analysers: a review. Part II: white blood cells, red blood cells, haemoglobin, red cell indices and reticulocytes. Int J Lab Hematol. 2007;29(1):21–41. doi:10.1111/j.1365-2257.2006.00871.x.
- De la Salle BJ, McTaggart PN, Briggs C, Harrison P, Doré CJ, Longair I, Machin SJ, Hyde K. The accuracy of platelet counting in thrombocytopenic blood samples distributed by the UK national external quality assessment scheme for general Haematology. Am J Clin Pathol. 2012;137(1):65–74. doi:10.1309/AJCP86JMBFUCFCXA.
- Hong KH, Kim MJ, Lee KW, Park KU, Kim HS, Song J. Platelet count evaluation using three automated haematology analysers compared with the immunoplatelet reference method, and estimation of possible inadequate platelet transfusion. Int J Lab Hematol. 2009;31(3):298–306. doi:10.1111/j.1751-553X.2008.01032.x.
- Sehgal K, Badrinath Y, Tembhare P, Subramanian PG, Talole S, Kumar A, Gadage V, Mahadik S, Ghogale S, Gujral S. Comparison of platelet counts by CellDyn Sapphire (Abbot Diagnostics), LH750 (Beckman Coulter), ReaPanThrombo immunoplatelet method (ReaMetrix), and the international flow reference method, in thrombocytopenic blood samples. Cytom Part B Clin. 2010;78(4):279–85. doi:10.1002/cyto.b.20515.
- Hummel K, Sachse M, Hoffmann J, van Dun L. Comparative evaluation of platelet counts in two hematology analyzers and potential effects on prophylactic platelet transfusion decisions. Transfusion. 2018;58(10):2301–8. doi:10.1111/trf.14886.
- Segal HC, Briggs C, Kunka S, Casbard A, Harrison P, Machin SJ, Murphy MF. Accuracy of platelet counting haematology analysers in severe thrombocytopenia and potential impact on platelet transfusion. Br J Haematol. 2005;128(4):520–5. doi:10.1111/j.1365-2141.2004.05352.x.